HAL Id: hal-01446389
https://hal.archives-ouvertes.fr/hal-01446389
Submitted on 7 Apr 2017HAL is a multi-disciplinary open access archive for the deposit and dissemination of sci-entific research documents, whether they are pub-lished or not. The documents may come from teaching and research institutions in France or abroad, or from public or private research centers.
L’archive ouverte pluridisciplinaire HAL, est destinée au dépôt et à la diffusion de documents scientifiques de niveau recherche, publiés ou non, émanant des établissements d’enseignement et de recherche français ou étrangers, des laboratoires publics ou privés.
How diffraction limits ultrasonic screening in phononic
plate composed of a periodic array of resonant slits
Aliyasin Ayouch, Mahmoud Addouche, Philippe Lasaygues, Younes Achaoui,
Morvan Ouisse, Abdelkrim Khelif
To cite this version:
Aliyasin Ayouch, Mahmoud Addouche, Philippe Lasaygues, Younes Achaoui, Morvan Ouisse, et al.. How diffraction limits ultrasonic screening in phononic plate composed of a periodic array of resonant slits: Quasi-omnidirectional ultrasonic screening based on coupled Fabry-Perot resonators in a phononic plate. Comptes Rendus Physique, Centre Mersenne, 2016, 17 (5), pp.518 - 523. �10.1016/j.crhy.2016.02.006�. �hal-01446389�
This document is the author’s final manuscript of
Aliyasin Elayouch, Mahmoud Addouche, Philippe Lasaygues, Younes Achaoui, Morvan Ouisse, and Abdelkrim Khelif - Quasi-omnidirectional ultrasonic screening based on coupled Fabry-Perot resonators in a phononic plate (2016)
This paper has been published by Elsevier Masson and can be found at http://dx.doi.org/10.1016/j.crhy.2016.02.006
Quasi-omnidirectional ultrasonic screening based on coupled Fabry-Perot resonators in a phononic plate
Aliyasin Elayouch,1 Mahmoud Addouche,1 Philippe Lasaygues,2 Younes Achaoui,2
Morvan Ouisse,1 and Abdelkrim Khelif1
1)Institut FEMTO-ST, Universit´e de Franche-Comt´e, CNRS; 32 avenue de
l’Observatoire 25044 Besan¸con Cedex, France
2)Laboratoire de M´ecanique et d’Acoustique, UPR CNRS 7051,
31 chemin Joseph Aiguier, 13402 Marseille cedex 20 - France
We report an experimental demonstration of a quasi-omnidirectional acoustic shield-ing in the ultrasonic frequency range. The proposed structure is a periodically slitted plate with subwavelength apertures. A single slit acts as a Fabry-Perot resonator, where the coupling between them exhibits an attenuation frequency band that re-mains stable with respect to the angle of the incident wave. The experimental mea-surements proved to be in good agreement with finite element method simulations. Thus, centred around the frequency of 170kHz, the attenuation can reach at least 20dB, when the incident angle goes from 0 to 45 degrees. Beyond this incident angle of 45 degrees, scattered radiations occur at 175kHz, thereby lowering the attenu-ation ability of the phononic structure. This scattering is related to a diffraction phenomenon, as supported by analytical calculations.
Keywords: Fabry-Perot acoustic resonator, acoustic screening, acoustic metamateri-als
I. INTRODUCTION
The understanding of wave phenomena has experienced a turning-point with the arrival of new artificial structures such as phononic crystals and acoustic metamaterials. Their counterintuitive behavior never ceases to surprise and permits to overcome many challenges in the acoustic domain. For instance, resonance-based mechanisms can be very efficiently used to control the propagation of acoustic waves. In 2000, P. Sheng opened the way with the locally resonant sonic materials that permitted to exhibit phononic bandgaps at frequencies that are much lower than the relevant wavelength. From there, other structures having a periodic distribution of local resonators in the form of inclusions have emerged. This is the case for structures with inclusions in the form of masses attached to a membrane1–4,
pillars on a surface5–7, or subwavelength apertures8–14. In particular, the transmission of
acoustic waves through a periodically perforated plate has been the subject of a great deal of study. Thus, originally found and developed for light transmission, the extraordinary acoustic transparency (EAT) has been concretely described as a significant enhancement of the acoustic transmission at the particular resonant frequencies of the Fabry-Perot cavities. It is worth noting that such a EAT was reached for the case of rigid solid conditions, so that the resonant cavities cannot use the material as a means of coupling 12,13. By taking
into account the elasticity of the acoustic grating, a new coupling between Fabry-Perot resonators has been highlighted15–20, underlying a huge acoustic screening effect21. In these
conditions of finite impedance ratio between the fluid and the solid, the transmission of an acoustic wave through a periodically perforated plate have showed the presence of a series of resonances and antiresonances that permit to create, at normal incidence, an acoustic blocking effect, breaking the conventional mass-density law. Although the idea of using periodically perforated plates with subwavelenth apertures can be applied to prohibit the propagation over a broadband frequency range, using the resonant cavities for waves coming from different incident directions may limit the angular frequency band for this structure.
In this paper, we experimentally investigate the omnidirectional ability of a phononic structure to maintain ultrasonic opacity. For this purpose, the structure is subjected to acoustic waves coming from different incident angles, and experimental measurements are realized and compared to FEM simulations realized on Comsol Multiphysics. Furthermore, the experimental results highlight the diffractive ability of the phononic structure. Indeed,
as well as being resonators, apertures also act as diffractive elements.
II. ULTRASONIC SETUP
The phononic structure used for experiments is constituted of a 180×165mm2 aluminium
plate, featured with a periodic slits array. The thickness is t = 5mm, and the apertures are distanced by a pitch of a = t = 5mm, and are d = 0.17a = 0.85mm wide. The structure is 33 times periodic, with 150mm-tall slits. The experiments are conducted in a water tank at hundred of kilohertz frequencies. For the experimental setup, chirped ultrasounds were generated by a 25mm diameter immersion transducer. We use an Imasonic transducer as a transmitter and a Precision Acoustics hydrophone as a receiver. Both of them are initially oriented towards the orthogonal axe centered on the plate. Each position of transmission-reception is in a plane orthogonal to the plate, and perpendicular to the slits, as presented in the scheme of Figure 1a.
Figure 1. (a) is a scheme of the experimental set-up used for the directional characterization of the phononic structure. The dotted arrows represent the incident directions, with θidefined as the incidence angle at which we work. In reception, 31 measurements are performed for each incident direction. (b) and (c) are respectively the input and output ultrasonic chirped signals for the θi = 0◦ and θtr = 0◦ configuration, for the phononic structure. (d) is the directional spectra we build from the measurements obtained in (b) and (c).
phononic structure for two incidence positions, at normal incidence θi = 0◦, at θi = 30◦, and
at θi = 45◦. For instance, Figure 1b shows the signal input at θi = 0◦ , representing a typical
emitted chirp, and Figure 1c the ultrasonic signal recorded at normal transmission θtr = 0◦
after crossing the phononic structure. Thus, for each incident position of the transducer, the hydrophone measures the temporal signal, from θtr =−60◦ to +60◦ with a step of 4◦. For
each incident position, the discrete Fourier transform of the 31 time signals measurements are computed. An example of transmission spectrum for θi = 0◦ and θtr = 0◦ is represented
in Figure 1d. Adding the spectra for all θtr will permit us to visualize all transmission spectra
depending on the reception angle θtr. In Figure 1d, the radial axis corresponds to frequencies,
and the transmission amplitude is represented through a colorbar. In the following results, the directional transmission spectra for a homogeneous plate will be compared to those obtained with our phononic structure, at different incident angles θi = 0◦, θi = 30◦ and
θi = 45◦.
In addition, the field on the output side of the phononic structure is detected with a hydrophone, in the near field of the transmitted wave. The hydrophone is attached to a 3D motorized translation stage controlled by a computer. By moving the hydrophone in a rectangular grid, we are able to scan the spatiotemporal distribution of the output field. By digitally filtering output chirped signals recorded at each grid point at a particular fre-quency, we are able to produce a snapshot of the outgoing amplitude field, and so investigate frequency and incident angle dependencies of the outgoing acoustic beam.
III. EXPERIMENTAL RESULTS AND DISCUSSION
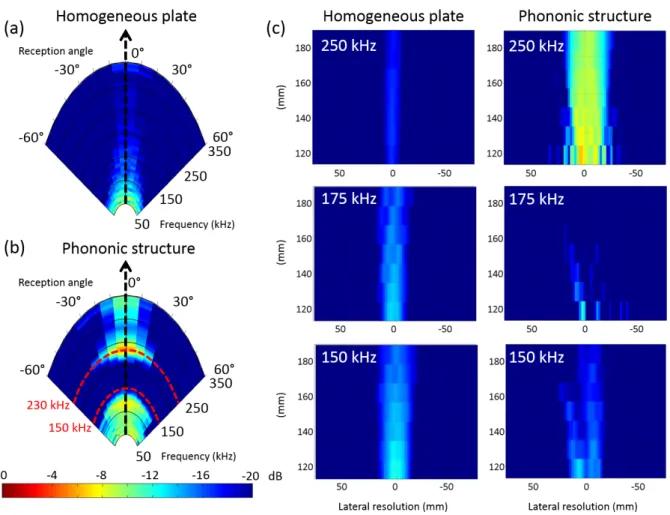
The following section presents the experimental results corresponding to the setup pre-sented above. Figure 2a and 2b are the comparison between transmission spectra for the case of a homogeneous aluminium plate and that of the phononic structure described above, at normal incidence θi = 0◦. We observe that the energy is present in a direction normal to
the plate for both structures, which means that the propagation direction is not modified in both cases. The difference between the two systems is due to the attenuation that follows the classical "mass law" for the homogenous plate, as can be seen in Figure 2a, whereas the phononic structure generates an attenuation zone from around 150kHz to 200kHz. Fig-ure 2c displays snapshots of the output fields for the two cases, at representative frequencies
Figure 2. (a) and (b) are the directional spectra, at normal incidence, of a homogeneous aluminium plate (a), and the phononic structure (b). (c) are a comparison of snapshots of the output fields at representative frequencies of 150kHz, 175kHz and 250kHz, for the case of a homogeneous plate and a perforated one, at normal incidence.
of 150kHz, 175kHz and 250kHz, at normal incidence θi = 0◦. We can directly observe the
transmitted acoustic beam at frequencies occurring within and beside the attenuation band. In order to confirm these conclusions, we compare, in Figure 3, two transmission spectra extracted from these measurements taken in the direction of waves propagation, in the case of a homogeneous aluminium plate and the case of the phononic structure, as well as the transmission obtained by performing finite elements simulations in Comsol. In the numerical study, we used the same geometrical parameters as those chosen for the experiment. Due to the 1D periodicity of the phononic structure, we carried out the simulation on a unit-cell by applying periodic conditions. The structure, made of aluminium, is surrounded by water.
Physical properties are listed in Table I.
Table I. Characteristics of materials Material Density cl (m/s) ct(m/s)
Aluminium 2.700 6420 3040
Water 1.0 1480
-The measured shape of transmission fits well with the simulation results, with notably the occurrence of resonances at the frequencies 120kHz and 230kHz, as shown in Figure 3.
Figure 3. Amplitude transmission spectra related to the aluminium plate perforated with peri-odically distributed slit arrays. The measured transmission is depicted by the black line. The transmission obtained by simulation is represented by the red line. Similar data are obtained experimentally for a homogeneous aluminium plate, depicted by the blue solid curve.
We now consider ultrasonic waves that impinge on the phononic structure with an incident angle of 30◦. We observe, in the directional transmission spectra of Figure 4a, that an
attenuation frequency band is maintained. Indeed, the amplitude around the frequency 175kHz is greatly reduced. To highlight this attenuation even more convincingly, we compare the amplitude pressure field for a homogeneous plate and the phononic structure, at three
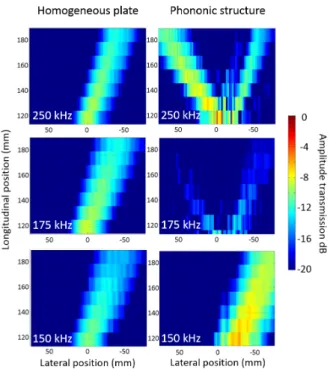
frequencies. Figure 5 displays snapshots of the output fields at representative frequencies of 150kHz, 175kHz and 250kHz, respectively at an incidence of θi = 30◦. We observe that
around the central frequency of 175kHz, the transmission of waves is greatly attenuated, which was already the case at normal incidence.
Figure 4. The directional spectrum of the phononic structure, at incidence (a) θi=30◦ and (b) θi=45◦. The white lines show the frequency localization of the first orders of diffraction obtained analytically.
The snapshots in Figure 5 also permit to observe the presence of two transmitted beams in the case of the phononic structure, at 250kHz, whereas only one beam was transmitted in the case of the homogeneous aluminium plate at the same frequency. The second beam we observe is another order of diffraction of the structure. This order of diffraction is clearly apparent on the directional transmission spectra of Figure 4a and 4b, from around 200kHz to 350kHz. Besides, we can see that the transmitted angle for this order depends on the frequency.
The experiment results we see can be verified analytically, especially regarding the tion. Indeed, this phononic structure constituted of slits array can be considered as a diffrac-tion grating that obeys the following law22:
Figure 5. The comparison between snapshots of the output fields at representative frequencies of 150kHz, 175kHz and 250kHz, for the case of a homogeneous plate and that of the phononic structure, at incidence angle of θi = 30◦.
Where i stands for incidence, a is the slits array period, m is the considered order of diffraction, λ is the wavelength, and n the refractive index. Thus, for an incidence angle of 30◦, and by considering only the -1, 0 and 1 orders of diffraction, we obtain analytically the
curves of Figure 4, which provides the frequency localization of these orders of diffraction. In Figure 4a, in the angular range −60◦ to +60◦, we can observe the 0 order whose the
transmission is at θm = 30◦, from 50kHz to 350kHz. The -1 order is in the negative part of
the directional diagram. This is confirmed experimentally, as we can see in the snapshots of Figure 5, by the presence of an acoustic beam negatively transmitted against the positive value θi = 30◦ of the incident wave. Besides, the angle θm at which this order is transmitted
depends on the frequency. In Figure 4a, the angle θm of the -1 order goes from −60◦ to
−20◦, in the [200, 350]-frequency range. The order of diffraction 1 is not visible in the
directional diagram of the Figure 4a, because the analytical value of the angle θm, at these
frequencies, is 90◦.
Finally, we notice in the directional transmission spectra of the Figure 4a that the at-tenuation is maintained around 175kHz. This is not the case of θi = 45◦, because of the
Figure 6. Frequency localization of the -1 order of diffraction obtained analytically in the case of θi=15◦ in black, θi=30◦ in blue, and θi=45◦ in red.
diffraction limit which closes the attenuation frequency band , as can be seen in Figure 4b. Based on the same analytical formula describing the diffraction grating law, we represent in Figure 6 the frequency localization of the order of diffraction m=-1, for different incident angles. At θi = 45◦, the diffraction is observable at 175kHz, which corresponds to the center
of the attenuation frequency band.
We also observe in Figure 4a that from 230kHz to slightly more than 250kHz, another attenuation band appears for the 0 order of diffraction. In this frequency range, energy seems to be rather redirected to the -1 diffractive order.
IV. CONCLUSION
In summary, we have experimentally demonstrated a quasi-omnidirectional screening around the frequency of 175kHz. We have obtained transmission losses up to 20dB, with a relative bandwidth of 15%, up to an oblique incidence of 45 degrees. Experimental re-sults, confirmed by analytical predictions, highlight the diffractive ability of the structure by showing the simultaneous transmission of beams in different directions, at given frequencies. They provide information on the limits of the screening ability by pointing out the first diffractive modes, at frequencies where the attenuation occurs. Such an ultrasonic screening has many potential for applications, particularly in the underwater acoustics and ultrasound.
V. ACKNOWLEDGMENT
We acknowledged the financial support from the Region of Franche-Comte under the ref-erence 2012C-08901, as well as the support of the French National Research Agency (project ANR-12-JS09-008-COVIA). This work was partly supported by the french RENATECH network and its FEMTO-ST technological facility.
REFERENCES
1Z. Yang, J. Mei, M. Yang, N. H. Chan, and P. Sheng, Phys. Rev. Lett. 101, 204301 (2008),
URL http://dx.doi.org/10.1103/PhysRevLett.101.204301.
2Z. Yang, H. M. Dai, N. H. Chan, G. C. Ma, and P. Sheng, Applied Physics Letters 96,
041906 (2010), ISSN 0003-6951, 1077-3118, URL http://scitation.aip.org/content/ aip/journal/apl/96/4/10.1063/1.3299007.
3G. Ma, M. Yang, Z. Yang, and P. Sheng, Applied Physics Letters 103, 011903 (2013),
ISSN 00036951, URL http://apl.aip.org/resource/1/applab/v103/i1/p011903_s1.
4J. Mei, G. Ma, M. Yang, Z. Yang, W. Wen, and P. Sheng, Nature communications 3, 756
(2012), ISSN 2041-1723.
5A. Khelif, Y. Achaoui, and B. Aoubiza, AIP Advances 1, 041404 (2011), ISSN
2158-3226, URL http://scitation.aip.org/content/aip/journal/adva/1/4/10.1063/1. 3675923.
6A. Khelif, Y. Achaoui, S. Benchabane, V. Laude, and B. Aoubiza, Physical Review B 81,
214303 (2010), URL http://link.aps.org/doi/10.1103/PhysRevB.81.214303.
7V. Laude, L. Robert, W. Daniau, A. Khelif, and S. Ballandras, Applied Physics Letters 89,
083515 (2006), ISSN 0003-6951, 1077-3118, URL http://scitation.aip.org/content/ aip/journal/apl/89/8/10.1063/1.2338523.
8H. Estrada, P. Candelas, A. Uris, F. Belmar, F. Meseguer, and F. J. Garcde Abajo, Applied
Physics Letters 93, 011907 (2008), ISSN 00036951, URL http://apl.aip.org/resource/ 1/applab/v93/i1/p011907_s1.
9X. Wang, Applied Physics Letters 96, 134104 (2010), ISSN 00036951, URL http://apl.
10L. Zhou and G. A. Kriegsmann, The Journal of the Acoustical Society of America 121,
3288 (2007), URL http://link.aip.org/link/?JAS/121/3288/1.
11Z. He, S. Peng, R. Hao, C. Qiu, M. Ke, J. Mei, and Z. Liu, Applied Physics Letters 100,
091904 (2012), ISSN 00036951, URL http://apl.aip.org/resource/1/applab/v100/ i9/p091904_s1.
12H. Estrada, P. Candelas, A. Uris, F. Belmar, F. Meseguer, and F. J. Garcde Abajo,
Wave Motion 48, 235 (2011), ISSN 0165-2125, URL http://www.sciencedirect.com/ science/article/pii/S0165212510001022.
13J. Christensen, L. Martin-Moreno, and F. J. Garcia-Vidal, Physical Review Letters 101,
014301 (2008), URL http://link.aps.org/doi/10.1103/PhysRevLett.101.014301.
14F. Liu, F. Cai, Y. Ding, and Z. Liu, Applied Physics Letters 92, 103504 (2008), ISSN
00036951, URL http://apl.aip.org/resource/1/applab/v92/i10/p103504_s1.
15X. Zhang, Physical Review B 71, 241102 (2005), URL http://link.aps.org/doi/10.
1103/PhysRevB.71.241102.
16M. Lu, Phys. Rev. Lett. 99, 174301 (2007), URL http://dx.doi.org/10.1103/
PhysRevLett.99.174301.
17F. Liu, M. Ke, A. Zhang, W. Wen, J. Shi, Z. Liu, and P. Sheng, Physical review. E,
Statistical, nonlinear, and soft matter physics 82, 026601 (2010), ISSN 1550-2376.
18S. Peng, C. Qiu, Z. He, Y. Ye, S. Xu, K. Tang, M. Ke, and Z. Liu, Journal of Applied
Physics 110, 014509 (2011), ISSN 00218979, URL http://jap.aip.org/resource/1/ japiau/v110/i1/p014509_s1.
19H. Estrada, J. M. Bravo, and F. Meseguer, New Journal of Physics 13, 043009 (2011),
ISSN 1367-2630, URL http://iopscience.iop.org/1367-2630/13/4/043009.
20C. Qiu, R. Hao, F. Li, S. Xu, and Z. Liu, Applied Physics Letters 100, 191908 (2012),
ISSN 00036951, URL http://apl.aip.org/resource/1/applab/v100/i19/p191908_s1.
21A. Elayouch, M. Addouche, E. Herth, and A. Khelif, Applied Physics Letters 103,
083504 (2013), ISSN 0003-6951, 1077-3118, URL http://scitation.aip.org/content/ aip/journal/apl/103/8/10.1063/1.4819021.