COST MODELING FOR
MONOCLONAL ANTIBODY MANUFACTURING
byChristina M. Simpson A.B. Engineering Brown University, 2005
Submitted to the MIT Sloan School of Management and the Department of Mechanical Engineering in Partial Fulfillment of the Requirements for the Degrees of
MASSACHUSETTS INSTITUTE
Master of Business Administration OF TECHNOLOGY
AND
Master of Science in Mechanical Engineering
JUN 15 2011
In conjunction with the Leaders for Global Operations Program at the
LIBRARI
ES
Massachusetts Institute of TechnologyJune 2011
ARCHVES
C 2011 Massachusetts Institute of Technology. All rights reserved.
Signature of Author
May 6, 2011 Department of Mechanical Engineering MIT Sloan School of Management Certified by
unaries L. Looney, i netrs
aupervisor
Robert T. Haslam (1911) Professor of Chemical Engineering
Certified by
Rdy Welsch, Thesis Supervisor Eastman Kodak Leaders for Gloal Operations Projegsor of Management Certified by
CerDf b
b
i E. Hardt, Thesis Reader
Ralnh E. and Eloise F. Qft5,s Professor of Methanical EngineeringAccepted by
David E. Hardt Chairman, Committee on Graduate Students
n ..- -' 1 -' ngineering
Accepted by
Ljewoie Berechman
Executive Director, MIT Sloan MBA Program MIT Sloan School of Management
COST MODELING FOR
MONOCLONAL ANTIBODY MANUFACTURING
By
Christina M. Simpson
Submitted to the MIT Sloan School of Management and the Department of Mechanical Engineering on May 6, 2011 in Partial Fulfillment of the Requirements for the Degrees of Master of Business
Administration and Master of Science in Mechanical Engineering
ABSTRACT
The Novartis BioPharmOps division is responsible for manufacturing large molecule products, including monoclonal antibodies, for late stage clinical trials and commercial sales. The BioPharmOps site in Huningue, France is expanding their product line but is also trying to reduce costs; cost pressures are increasing as biotech products become a larger part of Novartis' pipeline.
The site uses a standard cost method to calculate their product costs. However, when using standard costs it can be time-consuming to extrapolate and predict costs when inputs and assumptions (such as product mix or process parameters) are changed. This project describes development of a model that allows the factory to quickly and easily simulate new product mixes and process flows. This model provides the site with a different view of their costs that will help them understand their cost drivers more completely and thereby help enable strategic decision-making at the site.
A model of this type can be used to provide unexpected insights but the data in it are not meant to stand alone. By using results from a cost model like this along with operational metrics like throughput time or changeover time, a site should be able to quickly predict the cost impact of process changes or changes in the production plan.
THESIS SUPERVISORS
Charles L. Cooney, Thesis Supervisor
Robert T. Haslam (1911) Professor of Chemical Engineering Department of Chemical Engineering
Roy Welsch, Thesis Supervisor
Eastman Kodak Leaders for Global Operations Professor of Management MIT Sloan School of Management
David E. Hardt, Thesis Reader
Ralph E. and Eloise F. Cross Professor of Mechanical Engineering Department of Mechanical Engineering
Acknowledgments
There are many people I would like to thank who have supported me during my internship and during my two years in the LGO program.
First of all, thank you to the LGO program administrators and staff. Pursuing two masters degrees at MIT is a wonderful opportunity and the support each student receives from LGO along the way makes this opportunity possible.
I would also like thank my project sponsor, Jean-Frangois Guilland, and my project supervisor, Daniel Stark, both from Novartis. It was your joint vision for the project that brought me to Huningue in the first place and your support that guided the project as it progressed. Thank you as well to the many other Novartis employees who helped me; Florence Amate, Sophie Mathis, my officemates, the Manufacturing Technology group, and many more, all welcomed me to the site, taught me the production process, tutored me as I stumbled through new French phrases, and answered my many questions. Merci beaucoup!
Next I would like to acknowledge my advisors, Roy Welsch and Charles Cooney. Through various meetings, site visits, emails, and phone discussions, your suggestions and questions helped direct this thesis and make it more complete.
Thank you as well to my incredible LGO classmates. Through a summer of barbeques, semesters of spirited class debates, trips throughout Switzerland, and more, I have thoroughly enjoyed getting to know you all over the past two years and I feel honored to be associated with a group of such accomplished yet grounded people. I look forward to many years of LGO class bonding still to come.
Finally, thank you very much to my family. Regardless of where in the world I am working or traveling, or what new project I have undertaken, you are always there for me and willing to support me in my next adventure.
Table of Contents
Acknow ledgm ents ... 5
Table of Contents ... 7
List of Figures... 9
List of Tables ... 9
List of Equations ... 10
1. Introduction... 11
1.1 Problem Statem ent ... 11
1.2 Hypothesis ... 12
1.3 R e su lts ... 12
1.4 Thesis Goals and Organization... 13
2 Business Context ... 15
2.1 Industry Background ... 15
2.1.1 Industry Overview ... 15
2.1.2 Industry Regulation... 16
2.1.3 Industry Cost Structure ... 17
2.2 Com pany Background ... 18
2.2.1 Com pany Overview ... 18
2.2.2 Organizational Analysis... 18
2.3 Biotech Production Process ... 20
2.3.1 Cell Culture... 21
2.3.2 Purification... 21
2.3.3 Batch Production... 22
3 Cost M odeling Context ... 23
3.1 Current Cost Accounting M ethod ... 23
3.2 Current Pharm aceutical Cost Studies ... 24
3.3 Gap between Available and Required Cost Inform ation... 25
3.3.1 Cost Accounting System Origins ... 26
3.3.2 Challenges with Cost Accounting M ethods... 26
3.4 Bridging the Gap with the Overall Cost M odel... 28
4 M ethod ... 30
4.1 M odel Considerations and Goals... 30
4.1.1 Easy to Use ... 31 7
4.1.2 Provides Intuitive Results ... 31
4.1.3 Connects Finance and Operations with the Right Data ... 32
4.2 Assum ptions ... 35
4.3 M odel Software Selection... 40
4.3.1 SuperPro... 40
4.3.2 Aspen Batch Process Developer ... 40
4.3.3 BioSolve... 41
4.3.4 M icrosoft Excel... 41
4.3.5 Software Selection ... 41
5 M odel Developm ent ... 43
5.1 M odel Layout ... 43
5.2 Process Flow Cost M odel... 45
5.2.1 Inputs ... 45
5.2.2 Outputs... 47
5.3 Overall Cost M odel ... 47
5.3.1 Inputs ... 48
5.3.2 Outputs... 53
6 Research Analysis ... 56
6.1 M odel Verification and Data Sources ... 56
6.1.1 Data Inputs: M aterial Cost Components... 56
6.1.2 Data Inputs: Non-Material Cost Components (both Variable and Fixed) ... 58
6.1.3 Cost Allocation Param eters... 59
6.1.4 Overall Costs... 60
6.2 Research Analysis... 60
6.2.1 Results... 60
6.2.2 Case Studies... 64
7 Conclusion ... 69
7.1 Applicability to other Com panies and Industries ... 69
7.2 Potential Future Research... 70
7.3 Conclusions ... 71
Appendix 1 -W orksheet Layout: Details of a Process Step... 72
Appendix 2 -W orksheet Definitions ... 73
Bibliography... 75
List of Figures
Figure 1: Pharmaceutical Product Development Cycle (innovation.org) ... 16
Figure 2: Simplified Structure of Novartis Pharma ... 19
Figure 3 Determining Variable Costs (VCs) ... 33
Figure 4 : Different Allocations of Idle Capacity ... 34
Figure 5: Representation of Product Cost Components... 36
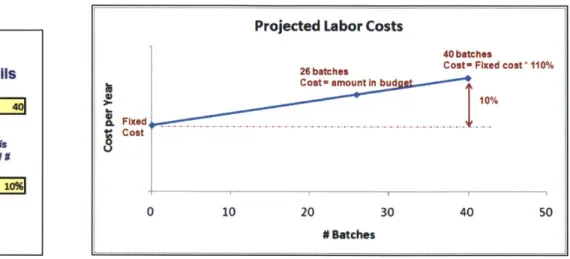
Figure 6: Projected Direct Labor Costs... 39
Figure 7: Cost M odel Layout... 44
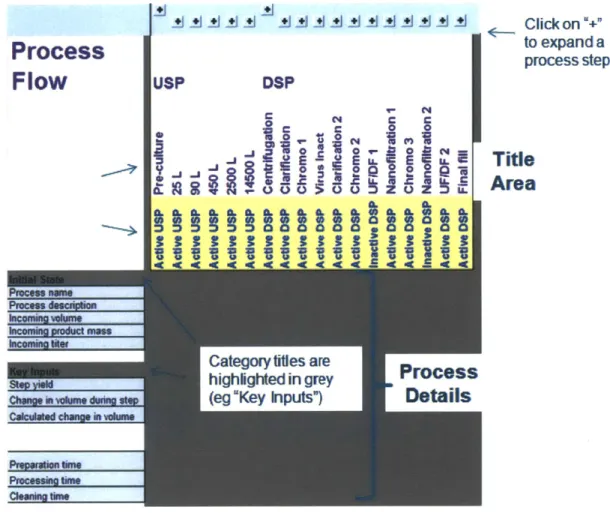
Figure 8: Process Flow Layout ... 46
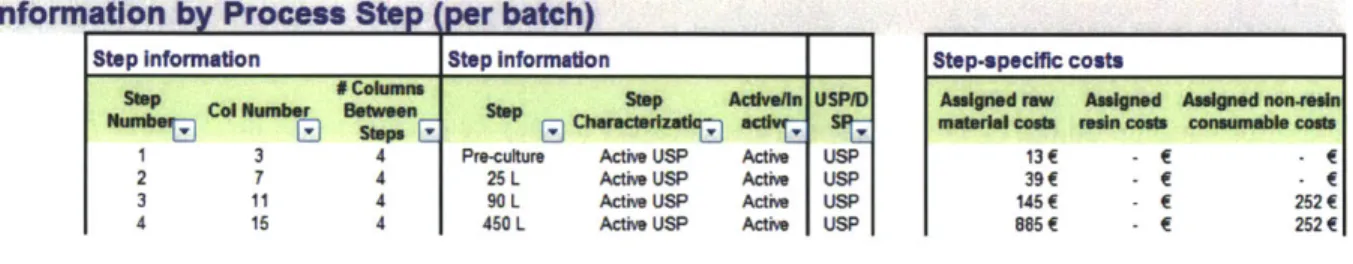
Figure 9: Process Flow Summary Table ... 47
Figure 10: Novartis Budget Information... 49
Figure 11: Variable Costs ... 49
Figure 12: Sample Scenario Input Area... 51
Figure 13 : Visual Representation of Scenario Input Parameters ... 52
Figure 14: Sample Gantt Chart ... 53
Figure 15: Cost Summary Data... 54
Figure 16: Campaign Cost Information ... 55
Figure 17: Overall Product Costs by Cost Type - View 1... 61
Figure 18: Overall Product Costs by Cost Type - View 2... 61
Figure 19: M aterial Costs by Process Step ... 63
Figure 20: Direct Costs by Process Step... 64
Figure 23: Impact of Titer on Cost per Gram ... 65
Figure 24: Impact of Resin Parameters on Costs ... 66
Figure 21: Cost Comparison: 3 vs. 4 batches, Idle Costs Included... 67
Figure 22: Cost Comparison: 3 vs. 4 batches, Idle Costs Separate... 67
Figure 25: Change in Cost as Capacity Utilization Increases ... 68
List of Tables
Table 1: Production Cost Options ... 27Table 2 : Impact of Idle Capacity on Costs (plant capacity = 4 batches/yr) ... 34
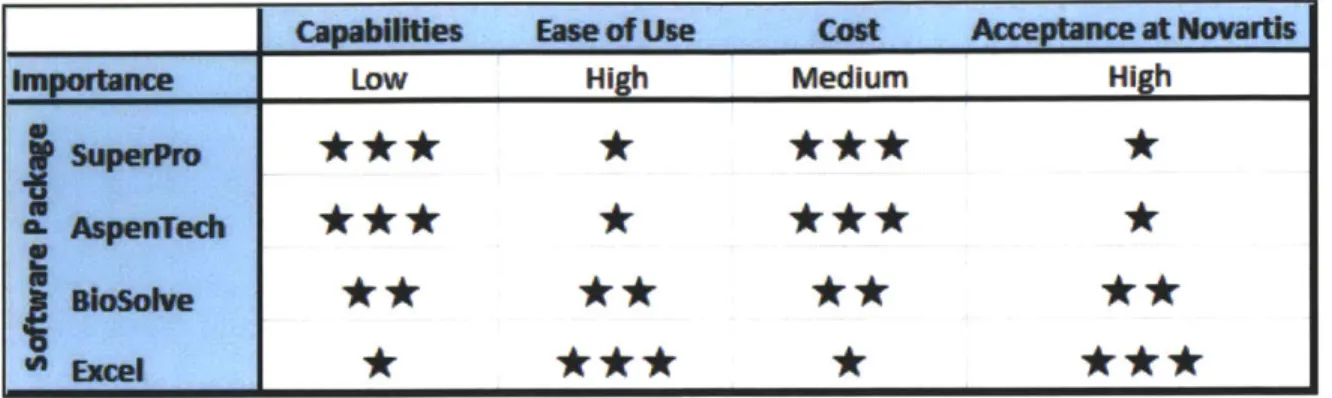
Table 3: Simulation Software Analysis ... 42
Table 4 : Verification of M aterial Costs ... 58 9
Table 5: Verification of Non-M aterial Costs ... 59
Table 6: Cost Allocation Param eters ... 59
List of Equations
Equation 1: Batch Cycle Time ... 52
Equation 2: Campaign Duration ... 52 Equation 3: Time Dedicated to Cam paign... 52
1. Introduction
1.1 Problem Statement
Since Novartis A.G. was founded in 1996 with the merger of Ciba-Geigy and Sandoz, it has grown to be one of the largest pharmaceutical companies in the world. It employs over 100,000 people and has a well-developed product pipeline spread across pharmaceuticals, vaccines, and generic drugs. Over the past few years, the development of biologic products has grown in importance to the company. The biologics group appears well positioned for the future as well, with a pipeline that comprises about 25%
of Novartis' new development. (Novartis AG)
As growth in biologics continues, the division faces new challenges. One area that will be of particular importance in the future is costs; what strategies can be pursued to continue to bring costs down? As belts keep tightening within the pharmaceutical industry, this focus on costs is likely to continue growing.
The focus on costs will extend throughout the product development lifecycle, and one important area within this is the manufacturing process. Companies would love to reduce manufacturing costs and receive higher margins. However, before any cost reduction can occur, it is necessary to understand which factors drive costs in the first place. Like most established companies, Novartis has a robust cost system in place that is used to value any biotech products already being produced. The system is used throughout the company and uses a common method for accounting, "standard costing," to track each division's finances and to report external results. This system, while sufficient for its intended purposes, was not designed to answer every potential question the division might have about its costs. Therefore, it can be time-consuming when it is used to predict costs for the future or to do sensitivity analysis of different scenarios.
The biotech manufacturing sites would like to address some of these challenges and find a solution that makes it easier for them to take action on their financial results. In particular, Novartis would like a
different way of looking at their costs internally that will enable faster and easier analysis of different scenarios impacting costs (such as changes to the process or product mix) and will make cost data more intuitive to understand.
1.2 Hypothesis
As described above, a company's financial results can be difficult to understand and accounting methods like standard costing add a layer of complexity that is often not understood much outside of the finance department. The goal of this thesis is to show another way of looking at costs that will address some of these difficulties.
The thesis describes the development and use of a cost model that provides Novartis with a new view of their biotech production costs. This cost model uses the same financial data sources as the current system but aggregates and presents the data in a different way. Using these data, the model quickly and easily predicts the impact that process changes and new products have on the relevant outputs. For example, the model makes it clearer which costs are fixed and which are variable, thereby allowing users to focus on the costs that they can influence. It also shows users breakdown of each cost component so they can test changes in different variables to see their impact, which provides insight into the importance of each input parameter. This approach makes it easier to understand the interactions between different cost drivers than was previously possible. It also makes it easier to connect financial results with operational metrics that are tracked on the factory floor, which allows management to make educated and proactive decisions.
1.3 Results
Before the model was used, it was verified with several sets of historical results. This verification was completed for material costs, non-material costs, and allocation parameters. Through this process, it was shown that the model does give the same results as pre-existing (albeit more complicated) cost models at the site. Information about the verification process was provided so future users of the model will be able to find the data sources should they wish to verify their data as well.
The goal of this project was to show how a model of this type could be beneficial. Therefore, the next step was to provide examples of analyses that the model can complete. Several different scenarios were investigated. The model was first used to understand the breakdown of overall product costs. These results showed that fixed costs are a high proportion of overall costs, and within the variable costs the resins and filters are most significant. The next analysis showed how including a cost for idle time in overall product costs can produce misleading results. Finally, several analyses were done to show tradeoffs in various process parameters. For example, a scenario was tested where both the titer and fermentation time increased. The higher fermentation time will hurt costs, but this analysis showed that, in this case, the improved titer would have a larger impact and costs would still go down as titer goes up.
In another example, adding another product to the factory actually causes only a small increase in overall costs.
Through these results, it was shown that the model can be useful for a variety of cost predictions and scenario analyses and should be used for more of these in the future.
1.4 Thesis Goals and Organization
The intention of this thesis is to illustrate the background and development of the cost model and also to explain situations where the model can be used. It focuses on several areas:
* Explain several ways cost data are used by companies today
* Illustrate some challenges associated with this cost data and some potential areas for improvement
* Describe the cost model as one possible way to address these challenges e Provide sample results and benefits
By explaining the cost model in the broader context, instead of focusing immediately on just one factory, it is possible to see how these concepts could apply to other companies and other industries outside of pharmaceutical.
The thesis is organized into sections that broadly relate to these overall goals.
Chapter 1, the Introduction, describes the problem statement as well as the motivation behind the development of this cost model. It also provides an overview of the project results.
Chapter 2 starts looking at the Business Context that surrounds the project. It outlines the pharmaceutical industry and emphasizes several of the features that make the industry unique. The organization and structure of Novartis are explained, as is the biotech production process.
In Chapter 3, the discussion of the project context is continued; however, this chapter focuses on the Cost Modeling Context instead of on the industry and company features. It explains the background for cost accounting methods used in various industries. From there, it explains several challenges with these methods and some solutions that have been used for cost analyses at other pharmaceutical companies.
The model development is introduced in Chapter 4, the Method section. This section describes the assumptions and criteria used to develop the model. For example, it illustrates several features that were integral to making the model successful. It also explains the selection process used to choose the model software.
Chapter 5 gets into the details of Model Development. It steps through the model layout and explains the input and output parameters. It also explains what drove the selection of each of these parameters.
The Research Analysis is conducted in Chapter 6. This chapter first shows how the model was tested and verified. From there, it shares several case studies that provide some sample results.
Finally, Chapter 7 is a Conclusion that ties together the preceding chapters and explains how this research could be applicable to other areas and industries.
2 Business Context
This chapter sets the context for the cost modeling project. It first provides an introduction to the pharmaceutical industry. Several factors set this industry apart and impact the model development, such as very long product development timelines, extensive regulations, and a high level of uncertainty. The chapter then introduces Novartis as a company and explains where in the company the cost model fits in. Finally, it describes the production process used at Novartis for the biologic products it develops.
2.1 Industry Background
2.1.1 Industry Overview
The pharmaceutical industry started expanding late in the 19th century (Cosper) and since then has grown
into an established industry with revenues well over $700 billion annually. (Zarur and Fleming)
Pharmaceuticals come in many different varieties but products are commonly distinguished by specifying whether the drug is on-patent or off-patent and whether the drug is a small or large molecule.
While a product is on-patent, the company holding the patent is allowed to prevent anyone else from selling it. This allows the patent-holder to protect the value of the drug and to recover the investment made to develop it. Once a product goes off-patent, it is known as a "generic" drug. Other companies are now allowed to enter the market so competition increases and margins reduce dramatically. This thesis focuses on products that are still on-patent, although the methodology developed here could apply to both.
The other distinction, between small and large molecule drugs, does not describe the stage of
development; instead, it describes the type of product. Many common medicines like Paracetamol (a pain killer) and Tetracycline (an antibiotic) are small molecules. These products are usually smaller than 100
atoms and are created using a process of chemical synthesis. Large molecule products (also referred to as biologics), which have only been developed since the 1970's, rely on biological growth instead of
chemical synthesis. Factories for these products grow a group of genetically modified cells and then use those cells as miniature factories to produce the product in question. These products are typically much
more complex than small molecules -some of them have over 25,000 atoms -but biologics often have enough similarities to one another that several products can be produced using a common platform. (Genentech, Inc.) Monoclonal antibodies (or mAb's) are a common example of a development platform. By changing aspects of these antibodies they can treat many different diseases. Therefore, since most
mAb's are produced in a similar way, they can often utilize the same facilities and factories for producing many products. This sharing greatly reduces risk, time for technical development, and capital investment.
One key feature of the industry is the combination of extremely long and costly product development cycles with very high risks. A typical product takes 10-15 years and $800M - $1 B to develop from an early stage idea to a product that is ready for sale (see Figure 1).
Figure 1: Pharmaceutical Product Development Cycle (innovation.org)
Adding to the uncertainty, very few products actually make it through the entire development cycle because testing often shows that they were not as effective or safe as they should be. For example, for a typical large molecule product, fewer than 15% of the products entering Phase I clinical trials will end up being approved by the FDA (Suresh and Basu, Improving Pharmaceutical Product Development and Manufacturing: Impact on Cost of Drug Development and Cost of Goods Sold of Pharmaceuticals). In order to undertake research of this scale, a company has to be prepared to shoulder high risk for a prolonged time period.
2.1.2 Industry Regulation
Another feature that distinguishes pharmaceutical companies from many others is the strict regulatory environment in which they operate. The drugs they produce can be life-saving to patients that take them, but they can also be life-threatening if side effects are not understood or if anything goes wrong during the manufacturing process. Because of these risks, various regulatory agencies audit and monitor both the
initial qualification and the ongoing manufacturing of all products. While this helps ensure that our medicines are safe, it also means that it can be difficult and time-consuming to make process improvements in a factory once a product is approved. These restrictions have contributed to the reluctance of companies to wholeheartedly pursue any cost improvement programs. (Suresh and Basu, Improving Pharmaceutical Product Development and Manufacturing: Impact on Cost of Drug
Development and Cost of Goods Sold of Pharmaceuticals)
2.1.3 Industry Cost Structure
In part because of the high risks and large investment costs, the pharmaceutical industry has a different cost structure from many others. For example, the ratio of cost of goods sold (COGS) to sales in the automotive industry is typically well above 70% (YCharts). In contrast, many pharmaceutical companies will only spend 27% of their revenues on COGS, and the ratio for biotech companies is closer to 15% (Basu, Joglekar and Rai).
Understanding this structure helps explain why manufacturing cost reduction has not historically been one of the primary goals in the pharmaceutical industry. Since production costs were relatively low, it was more cost-effective and impactful to spend resources elsewhere. Companies would invest extensively in new research programs but there was less incentive to adopt manufacturing improvements like lean or Six Sigma. However, several changes in the industry are causing this cost climate to change. First, many key drugs are going off-patent over the next few years. For example, products generating over $142 billion in sales will go off patent by 2016 (Zacks Equity Research). These losses mean that many companies will have fewer products to rely on for a steady revenue stream. In addition, with skyrocketing US healthcare costs and an increased focus on healthcare reform, the pharmaceutical industry is under unprecedented pressure to reduce prices. Due to these changes and others, many companies in the industry are starting to search for cost savings wherever possible. Since manufacturing is an area that has not been a focus in the past, it has the potential for high savings now. Therefore, the next few years will probably see many more cost-reduction programs being implemented across the industry.
2.2 Company Background
2.2.1 Company Overview
With nearly 120,000 employees and 2010 revenues of $50.6 billion, Novartis is one of the largest pharmaceutical companies in the world. (Novartis AG) Historically, the company's focus was on small molecule products but the past few years have seen growing investment in large molecule products as well; biologics, including several monoclonal antibodies, now comprise 25% of Novartis' pipeline. (Novartis AG)
The company is divided into four divisions: Pharmaceuticals, Vaccines and Diagnostics, Sandoz, and Consumer Health. While each division is connected at a high level, they still operate very independently. Even within the same division there can be substantial separation between different groups. This project focused on work with the Pharmaceuticals division (aka "Pharma"). This is the area that does all development and manufacturing for prescription drugs (both small and large molecules) that are still patent protected. The project could also be relevant for Sandoz, the division that manufactures generics,
since their methods for calculating costs and some of their production methods are similar to the methods used in Novartis Pharma.
2.2.2 Organizational Analysis
Research conducted at the MIT Sloan School of Management led to the development of a method for assessing organizational dynamics within a company. (Carroll) This assessment provides insights into company standards and behaviors using three different views, or "lenses": the strategic, political, and cultural lens. These insights can help in understanding the real-world issues that plague implementation of many projects. Looking at them here sheds light onto the way decisions are made within Novartis and also reveals (and helps avoid) potential challenges for project implementation.
The strategic view refers to the structure of the company and the way it is organized. For example, as stated above, Novartis is divided into four divisions. Each division is then broken down further into a number of different groups. For a simplified layout diagram of the Pharmaceutical division, see Figure 2.
Novartis Pharmaceuticals
DevelementBioPharrnOps
Factory
Factory
Factory
12
3
Figure 2: Simplified Structure of Novartis Pharma
The BioPharmOps group shown in this diagram is responsible for process development and
manufacturing for all patented biologic products. The diagram shows how BioPharmOps is distinct from the Development organization. BioPharmOps owns all of the factories and manufacturing whereas Development discovers and develops the new products. Nonetheless, the groups still depend heavily on one another. For example, both Development and BioPharmOps need to use capacity in the
BioPharmOps factories; BioPharmOps uses capacity to manufacture commercial products and Development needs a way to produce drugs for clinical trials. Since BioPharmOps owns the factories, Development relies on them to produce this clinical trial material. At the same time, Manufacturing relies on Development to come up with formulations for all new products.
This structure means that the two groups have to work closely together to manage capacity -and share the costs -for each factory. Since each group has a different set of incentives and motivations it can be challenging to determine who should pay for each aspect of production. The key takeaway for this project is that any model that is developed, in order to be useful, needs to consider the incentives and needs from both sides.
The cultural lens refers to the customs and standards for behavior within a company. People are
accustomed to talking about the culture of a country, or cultural differences from one country to another, but each company (or even division) has a culture of its own as well. Cues for cultural aspects of an organization can be found anywhere. For example, signs posted on the wall, employees' working hours, or the arrangement of the desks all provide insight into the culture of a group. For example, Novartis BioPharmOps tends to be a fairly open and un-hierarchical group; it is easy to approach people and ask for help or to ask questions. This is apparent from peoples' verbal response when you ask to set up a
meeting but can also be inferred from the arrangement of the desks; six or more desks are clustered together in each office, which encourages a collaborative work environment. Another insight into the culture's division is found in the languages spoken at the site. Novartis is a Swiss company (located in the German-speaking area of Switzerland), but the company's official language is English. In Novartis' French biotech factory, the majority of employees are either bi or tri-lingual. Nonetheless, the language heard most commonly, and the one used in most wall decorations and site emails, is French. In this case, learning the local language is one way to become more integrated into the organization. These
observations suggest that the division will be open to new ideas but it may be easier to implement change if it is done by working very closely with local employees.
The final organizational view, using the political lens, focuses on decision-makers and the control of information in an organization. As in any large company, decisions and information at Novartis are spread throughout the organization. Of particular relevance to this thesis is financial data. Novartis is understandably protective of its financial information. Not only is this data important for overall financial results but it can also be easily misrepresented; if someone looks at financial results but does not
understand the assumptions behind them, it is easy to draw inaccurate conclusions. Because of these concerns, any project working with financial data must be carefully managed. These considerations suggested that the model should be developed in a modular way so it can be shared across the company without revealing confidential information.
2.3 Biotech Production Process
As described earlier, the production process for small and large molecule products is very different. Small molecule products depend on chemical synthesis whereas biologic products rely on cell growth. Despite the complexity of these biologics, the manufacturing process for different products is often surprisingly similar. For example, monoclonal antibodies share almost all basic steps from product to product. The function of each antibody may be very different but the fundamental structure is similar enough that many manufacturing steps and pieces of equipment can be shared.
There are two main stages in this antibody production process. The first stage is Cell Culture, which is where cells are grown and the antibody is produced. After this stage is completed, the product goes through the Purification steps where the product is cleaned and filtered. Most products follow similar sub-steps within each of these broad categories as well, so a company is able to develop each process much more quickly and can often use a factory for several different products.
This cost model was developed to model an mAb factory that could produce multiple mAb's during a given year. While the steps for each product are often the same, different process parameters (such as the material selection or cycle time) impact the product output. The following section describes details of the production process as well as some parameters that are important to the process reliability, efficiency, and cost.
2.3.1 Cell Culture
The cells used during production are essentially miniature factories for the mAb product. To begin production, the company creates a "master cell bank", or a group of cells that have been encoded with
instructions for producing the antibody. During cell culture, the product proceeds through a series of steps where cells are grown and then antibody is produced. (Abu-Absi, Yang and Thompson) There are two common types of cell culture production, called fed-batch and perfusion; this model is designed for a fed-batch process.
Inoculation: Cells from the master cell bank have been replicated and are now used to start production of each new batch.
Cell Culture: After the batch is begun, the cells are given food so they can grow and multiply. More food is added regularly and cells are transferred into larger vials and tanks as they grow. Once the final tank is reached, the cells stop dividing and produce
the mAb. At the end of the cell culture process, factory workers measure the concentration of product in the tank, commonly referred to as the titer. This is a key parameter since it largely defines how much product will be obtained from each batch.
Harvest: The drug substance is removed from the final tank and sent through a centrifuge. During this step, the product (the antibody) is saved and the larger pieces (cells, DNA, and other remnants) are discarded.
2.3.2 Purification
The final drug substance must not contain any impurities. The goal of the purification steps is to isolate the antibody and remove all unwanted materials. (Kelley, Blank and Lee, Downstream Proce'ssing of Monoclonal Antibodies: Current Practices and Future Opportunities)
Clarification: The solution is filtered for the first time. Many filters used during purification steps are expensive and comprise a significant part of the production cost.
Protein A Chromatography: The solution is run past a special material called a resin. The product attaches to the resin and is saved while much of the debris, not captured by the resin, is discarded. Each batch of Protein A resin can be used for multiple batches of product before being discarded but it is still one of the most expensive materials used during production.
Chromatography 2: A purification step with a new resin removes additional impurities.
Chromatography 3: A third chromatography step removes even more impurities. The resins for Chromatography 2 and 3 are still expensive but they are far less significant than the Protein A resin.
Ultrafiltration / Diafiltration: The substance is filtered one final time and the product concentration and composition are adjusted. Filters used during this step can also be costly.
Final fill: The solution is frozen so it can be put into vials or syringes at a later time.
2.3.3 Batch Production
Although the production process is similar from product to product, it is challenging to run different products in a factory at the same time. Therefore, products are run in campaigns, where several batches of the same product are run in sequence before switching to the next product. When one campaign is coming to an end the factory completes a changeover and initiates production for the next product.
The raw materials and consumables described above, such as food for the cells or filters for purification, are a substantial component of the production costs. However, a large part of the cost comes from overhead expenses for the many non-material costs. For example, the factory equipment is expensive and needs to be paid for, as do direct labor and support personnel working at the site. These factors are investigated in later sections and will be considered alongside material costs in the cost model.
3 Cost Modeling Context
Reporting a product's cost seems like it should be straightforward; calculate what was spent for all individual cost components (such as raw materials, consumables, depreciation, and labor), add them up, and you should know how much your product costs. Unfortunately, implementation is much more complex than the theory and tracking and allocating the extensive data required for this process is a formidable task. By reviewing some literature relevant to this topic and by examining practices in use at companies today, this chapter describes a method commonly used for cost accounting today as well as the history that led to the this method's implementation. Looking at the questions these studies are designed to answer helps explain what data companies use to make decisions. From there, the chapter explains what some of the gaps are: what information do companies want from their cost data that they cannot currently acquire without an extensive and in depth study? These gaps are usually not due to a
misunderstanding or misuse of a company's financial data. Instead, they often arise because we try to use the system for something it was not intended to do. The final step is to explain how the cost model can help bridge the gap between the data that are currently available and the questions that companies would like to answer.
3.1 Current Cost Accounting Method
Like many companies, Novartis uses a method called "Standard Costing" to evaluate and report their costs. There is substantial literature related to the development and use of this method. Essentially, the theory behind standard costing is that a manufacturing company establishes a standard - or expectation
-at the beginning of the year for the amount they plan to spend. Using a "standard cost" and a "standard quantity", they then predict what they expect to spend for the year. These standards are related to the expected inputs they will use during production. (Baggaley and Maskell)
One important aspect of standard costing is related to allocations. Some components of cost are easy to attribute to a specific product. For example, money paid for the reagents used to make a batch of product should clearly be a part of the product's cost. However, many costs are harder to determine. For example, in a factory that produces 10 different products, which product should bear the cost for the factory manager? Standard costing allocates these indirect costs to different products using different allocation keys. Ideally these keys are based on the actual amount of time that the manager spends on each product but it is hard to get the allocations to be completely accurate.
During the year, as product is produced, the site "absorbs" costs. The goal at the end of the year is to have absorbed 100% of the costs. However, a company never ends up producing or spending exactly what they expected. Instead, they have "variances" from expectations. These variances take many forms (such as an "efficiency variance" or a "price variance"), but they all reflect the idea that actual spending was different from expected. If variances are high, companies often spend a significant amount of time and focus tracking down the potential root cause. (Crosson)
3.2 Current Pharmaceutical Cost Studies
Standard costing is a system that was developed for use by the finance group to calculate product costs for external reporting. However, employees outside of the finance group make many cost-based decisions that rely on financial data as well. In many cases in the literature, the required data were not readily available and a new model or analysis was completed in order to aid with these decisions. In particular, there are three areas addressed in the literature that are of particular relevance. First, there are many
studies into the impact that specific process parameters have on results such as run rate, COGS, or capacity utilization. Second, there are several studies that look at the future of capacity utilization in biotech and discuss its importance for costs; these studies emphasize the importance of looking at overall results and of relating financial performance to operational metrics. Finally, there is research into the software tool that is most useful to address these questions. This chapter reviews each area and refers to some representative papers that describe them.
Impact of Process Parameters on Costs
Various studies try to predict the impact that changes to a specific parameter will have on a factory's overall results. For example, an article by Suzanne Farid evaluates many parameters impacting
downstream costs. For example, she examines how titer, downstream yield, and batch success rate could drive costs. (Farid) Another article discusses how optimization depends on both yield and run rate. (Han, Nelson and Tsai) Articles like these try to break down the impact of different cost drivers so employees can understand which factors to influence.
Relating Financial and Operational Metrics
When management looks at the cost of a product, they tend to look at the overall product cost, including any overhead that is allocated to that product. However, that view can be misleading. When a new batch
is run, the actual additional cost to a factory tends to be much lower than the overall product cost would imply. This problem leads into the theme of the next group of articles: the importance of seeing the overall picture instead of focusing in on just one cost. For example, the article mentioned above by Han, Nelson, and Tsai talks about the tradeoff between higher material costs and higher overall costs. It emphasizes that sometimes a higher material cost will lead to better overall results. "Trends in Capacity Utilization" reflects the difficulty of looking at only financial results because often the risk of running out of capacity is a much higher concern. This perspective highlights the point that financial and operational results should be viewed together. (Langer) In "Improving Pharmaceutical Product Development and Manufacturing," the authors discuss how up front investments in process development can lead to manufacturing savings down the road. (Suresh and Basu, Improving Pharmaceutical Product Development and Manufacturing: Impact on Cost of Drug Development and Cost of Goods Sold of Pharmaceuticals)
Software Selection
Finally, several articles discuss the development and selection of a software package. For example, one study evaluates the two most common biologic process simulation programs, Aspen Batch Plus and
SuperPro, in eight performance categories. (Shanklin, Roper and Yegneswaran) Another paper analyzes the choice of production method using a "decision support tool." (Lim, Washbrook and
Titchener-Hooker) A final study uses Excel and a process modeling software tool to analyze downstream operations to predict whether new operations will have to be developed to meet capacity requirements. (Kelley, Very Large Scale Monoclonal Antibody Purification: The Case for Conventional Unit Operations) These studies all show the tradeoffs between using different analytical tools.
3.3 Gap between Available and Required Cost Information
The companies who completed the research described in the previous section may not have stated it explicitly but they implicitly recognized the challenge addressed by this cost model: there is a dichotomy between data calculated for financial reports and their operational metrics. Although they each approach it from a different direction, each article reflects the need for additional modeling and testing that can be used to make informed decisions.
There is nothing inherently wrong with standard costing. It compiles data in a way that is useful and relevant for certain types of manufacturing. However, in many environments it will provide contradictory incentives. In these cases, standard costing causes several problems.
This section outlines the history of some cost accounting systems and then uses scenarios and examples to describe some of the relevant challenges.
3.3.1 Cost Accounting System Origins
Cost accounting systems as they are known today developed in the early 1900's and were used to value the worth of a company. At the time, this was a simple process. Most companies made just one product and that product would only contain a few components. Since then, part complexity has grown by several orders of magnitude and the valuation process has evolved along with it. Financial systems today are governed by an extensive set of rules to ensure that all public companies report their results accurately and fairly. There are a variety of methods that companies can use to value their inventory and assign costs to each product. However, whether a company uses activity-based costing, standard costing, or something else, the end goals are the same: to know where money is being spent and how much money is being earned. (Huntzinger)
These systems were originally created to report companies' results externally, but since products were so simple this same data could easily be used for internal management to make decisions as well. However, as product complexity increased, this became increasing difficult. To explain some of these difficulties, we look at several simple case studies.
3.3.2 Challenges with Cost Accounting Methods
These hypothetical examples may sound familiar to many employees since they arise in companies and industries around the world. These concepts provide the foundation for the creation of the cost model.
Scenario 1: A manager in a factory generally has good performance but continually has high variances and cannot figure out how to reduce them.
Root Cause 1: The manager may be performing well but there is a good chance that he finds the financial results difficult to comprehend and hard to take action on. The variance terms in the financial report do not make sense to him since they are not connected to the operational metrics
he manages. In addition, he does not even have control over about 60% of the budget items in his department; these items were allocated to him from a different group. He would prefer to spend time improving items he already understands and knows how to fix.
Scenario 2: A factory has met all customer demand for the year but they are told by upper management to produce extra batches in December so they can absorb their remaining overhead costs and meet their annual financial targets.
Root Cause 2: The customer demand (and therefore the amount of absorbed costs) may have changed, but the factory's cost targets and variance calculations have not. By producing more, factories are able to absorb more of their costs and reduce their variances, but they also have to produce unneeded materials and carry extra inventory.
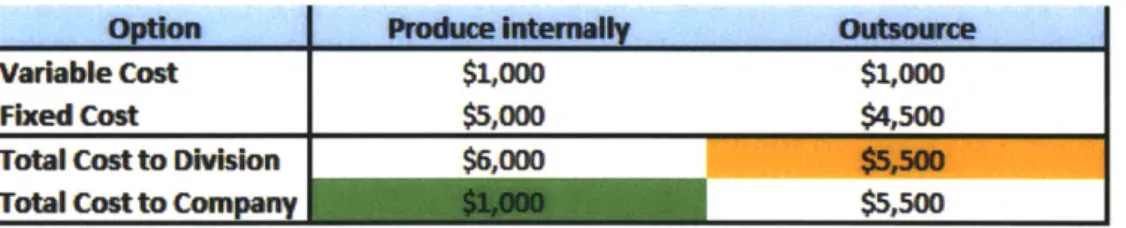
Scenario 3: A division chooses to outsource a product even though internal capacity is available and variable costs are low.
Root Cause 3: The table below (Table 1) shows one way this could happen. Both the internal and external groups would have expenses of $1,000 if they received the contract. They charge
$6,000 and $5,500 respectively since these are their "total costs" for producing. If internal capacity is available then the best decision for the company would be to produce internally. However, that decision is obscured by the cost calculation because the company is only looking at their product cost calculation instead of their overall value stream cost.
Table 1 : Production Cost Options
OptionPo_ _ _
Variable Cost $1,000 $1,000
Fixed Cost $5,000 $4,500
Total Cost to Division $6,000 7;7
Total Cost to Company $5,500
Scenario 4: A manufacturing site would like to lower new product costs by changing some process parameters but cannot figure out how to explain to the development organization that the
investment in process improvements is worthwhile.
Root Cause 4: Financial results can be confusing for someone to understand without the right background knowledge. In addition, the financial system is designed to be reactive rather than proactive. Most financial accounting systems are designed explicitly to report results, which
means by definition that the results have already happened. Management would like a tool that can predict financial performance if certain process or product parameters change, a goal which was never expected when the system was designed.
In all of these cases, the players involved (both in manufacturing and in finance) are trying to make the correct decisions for the business but there is a conflict between the decisions they would like to make and the indicators available to inform those decisions.
Keep in mind that companies are not automatically making poor decisions just because the financial systems are not designed to report data in a certain way. There are many reasons that financial analysis is done the way that it is that are not discussed at length in this thesis; this data is essential for many aspects of financial control and reporting. In addition, it is still possible to avoid many of the conflicts described above, even without an entirely new cost system. Employees in finance are often aware of these conflicts and can take steps to reconcile and reduce some of the differences between groups. Nonetheless, these issues still arise frequently and it is important to watch out for them. In addition, by analyzing and compiling the financial data in a different way it is possible to address these struggles more directly and to make it easier to get the right measurements when they are needed.
3.4 Bridging the Gap with the Overall Cost Model
As described above, there are several specific challenges that arise from using the same financial method for both external and internal financial results. In particular, several issues stand out:
Results that are hard to understand and take action on: Standard costing calculations lead to variances which can be hard for managers to relate directly to their business and results. Budgets also include many costs over which managers have no control.
Conflicting metrics: Financial data reveals only part of the picture. If the finances are not reviewed alongside the operational metrics such as capacity utilization and product demand, then each set of metrics will pull managers in different directions.
Focus on product-specific instead of overall costs: A factory that focuses on each product in isolation runs the risk of optimizing one at the expense of the others. Managers should look at the impact on their overall costs when they are considering any changes.
Metrics that are reactive instead of proactive: It should be possible to easily analyze several different scenarios in a factory and get a prediction for their impact on costs.
These challenges are especially daunting in the pharmaceutical industry where the cost of manufacturing is a low percentage of overall costs and regulatory hurdles are extremely high. However, manufacturing is an area with much potential for improvement and is a powerful lever that companies can pull to increase profitability. Therefore, especially in a time of increased focus on cost reductions and efficiency, these hurdles can be overcome.
This thesis presents one tool to address some of these concerns. It focuses on providing a different view of costs that makes cost analysis easy and predictive. A customized cost model will allow the site to
intuitively understand their costs and where they come from, and also to predict the potential cost impact of process and product changes. By understanding their finances and knowing how to take action on them, managers will be able to make more educated and holistic decisions.
4 Method
Now that the context and drivers for the cost model are understood, it is time to discuss the
implementation. As previously described, the goal of this model is to provide an easier and more intuitive way to understand costs that helps predict the cost impact of product and process changes. However, there will be many users whose interests and goals span a wide range of topics. Creating a model that can address such a variety of users' needs requires a balance of many components. This chapter describes several critical design features that were considered during model development, including selection of a software package, and reviews the main assumptions that impacted the model.
4.1 Model Considerations and Goals
Financial results depend on decisions made at all levels of a factory and stakeholders use this financial data for a multitude of purposes. For example, a financial planner at headquarters might analyze how much it would cost to produce a few more batches next year; a capacity analyst calculates the return on investment for choosing to produce in one factory versus another; a tool operator does not even realize that the extra piece of tubing he uses for every batch is costing the company thousands of dollars per year. Each employee makes decisions that influence the final cost of the product that is produced and being able to understand the impact of those decisions can help employees work more effectively.
On the other hand, financial data are incredibly complex. A factory may track their work by dividing into dozens of cost centers, each of which includes hundreds or thousands of lines of expenses. Behind each expense is a person or team who is responsible to choose how and when to spend that money.
Forecasting budgets, calculating variations from the plan, and keeping groups on track are not easy tasks.
How does this impact the cost model? The financial data are often managed and kept within the financial groups due to some of the challenges and complexity described above. However, one goal of this model is to make these data accessible and understandable to a broader community. Therefore, somehow the complex financial data have to be presented in a way that the financial planner, the capacity analyst, and the tool operator can all understand and relate to their jobs - and it has to do this without requiring much setup and without distorting data.
A few guidelines were established to keep the model focused and to ensure that these requirements would be met. These were drawn directly from the hypothesis explained in chapter 1: the model must be quick
financial and operational metrics. The following paragraphs summarize these considerations. Later, when the model is described in more detail, we discuss how these requirements were met.
4.1.1 Easy to Use
A model that confuses its users will not end up being used or, even worse, is likely to be interpreted incorrectly. A central principle for this model is its ease of use.
In practical terms, that translates into several criteria. For example, calculations in the model should flow logically from one place to the next. In other words, it should be clear where the user is supposed to input data and where they look to find the outputs. This reduces the time that users have to spend looking for input parameters and, since many input parameters are grouped together, it reduces the risk that a parameter will be missed.
It also means that different users should be able to see clearly which inputs they are responsible for. The finance group understands the budget data very well but they are not expected to be experts on the process flow information. The process development group has an opposite view; they understand process
parameters such as product concentration, filtering speed, and material selection but they are less involved with fine details of the budget. The groups have to work together to supply the model inputs but they
should only be held responsible for their area of expertise. This separation of knowledge led to
development of the model in two separate cost models that tie into one another: the "Process Flow Cost Model" and the "Overall Cost Model." This design makes it clearer which users should set up which part
of the model and reduces confusion as users learn the model for the first time.
4.1.2 Provides Intuitive Results
After all inputs are entered, users want to use the model to draw conclusions. Like the inputs, these results should be easy to understand.
When standard costing is used, COGS is reported as a base number with variances added to it. These variances could include a purchase price variance, a labor variance, a materials usage variance, and more. On the other hand, when standard costing is not used, COGS can be reported directly as a sum of the individual components. Although in theory the variances help focus on specific changes from a
company's plan, in practice the root cause of a variance is often extremely difficult to track down. (BMA Inc.)
The results in this model are reported in a different way that avoids the use of variance. The meaning of the results is the same as that obtained using standard costing but this method of reporting makes it easier to relate to operational metrics on the factory floor. Therefore, this model uses simple metrics like "material costs" and "labor costs" that are more easily adopted as a common vocabulary and can facilitate communication between groups.
Again, we should emphasize that neither set of results is incorrect; they are just used for different purposes. In this case, the second set is more applicable for the goals of this model.
Another way to make costs intuitive is through their presentation. The model should not have a lag time for calculations, so all calculations are done automatically whenever the user updates any parameters. Next, the most relevant results are presented graphically; these graphs also update automatically
whenever anything changes. Finally, several input options allow the user to compare several scenarios at the same time. This allows them to do side-by-side cost comparisons extremely easily.
4.1.3 Connects Finance and Operations with the Right Data
It is good to have easy-to-understand inputs and results but without the right data these features are meaningless. This is perhaps the hardest feature to get right. Again, how do you get the financial planner, the capacity analyst, and the tool operator all aligned, and how do you give them all the same incentives so poor decisions are not made? This section explains how the "right data" was chosen to include in the cost model.
Fixed versus Variable Costs
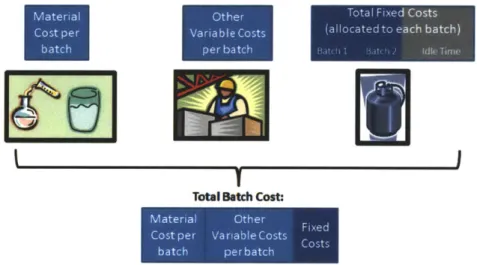
When calculating costs for a manufactured product, it is clear that these costs include materials and consumables. For example, biologic product costs should include the cost of food for the cells and the cost of filters used up for a given batch. These are variable costs and the expense to the factory increases in direct proportion to the number of batches. In general, some element of fixed costs is also assigned to a given product's cost. For example, if a product runs in the factory for two weeks, then two weeks' worth of equipment depreciation is assigned to the product. When new batches are added, the overall cost to the factory changes by the amount of the variable cost multiplied by the number of batches.
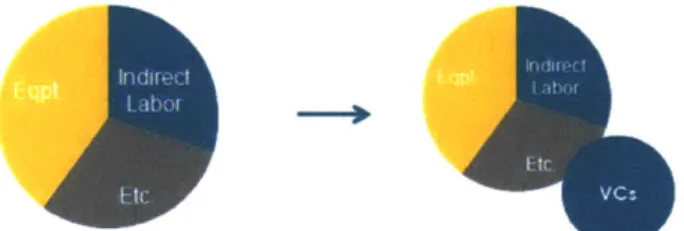
At Novartis and at many other companies, the division between fixed and variable costs is not as clear as it might sound. For example, producing a batch might be very energy intensive but you also need to
provide electricity to the factory even if it is shut down. In that case, how much of the utilities cost is actually variable and how much is fixed? A similar question applies to direct labor. As the number of batches increases, are additional personnel hired or does the scope of work for the current personnel simply increase? The diagram below represents the process of examining costs at the Novartis factory, some of which were assumed to be fixed, and breaking them into smaller pieces to pull out elements that were actually variable.
Figure 3 : Determining Variable Costs (VCs)
One other consideration is the timeframe being examined. Some costs might be fixed in the short term, such as the salary for the site manager at a plant. However, long term it is possible to close the factory down, in which case the factory's fixed costs would reduce to zero.
Since the goal of this cost model is to help managers understand their costs and have more control, it is important to hone in on variable costs so managers can understand conceptually which products are really incurring higher costs. Therefore, this model provides several different views of output, one of which explicitly lists all costs that are variable. The Assumptions section later in this chapter will explain how the variable costs were selected for this model.
Cost of Idle Capacity
The capacity utilization at a factory will change from year to year and sometimes even from month to month. In some types of cost reporting, costs for any idle capacity are included in the product cost. This means that factory overhead costs are distributed across the products being run. Supposed that three batches are run in the factory but the plant's capacity is four. In this case, capacity utilization is 75% and the factory could add one more batch without incurring any additional fixed overhead costs. The figure and table below illustrates this example.
Capacity= 4 batches
OR
Idle Allocated
IdleSeparate
Figure 4 : Different Allocations of Idle Capacity
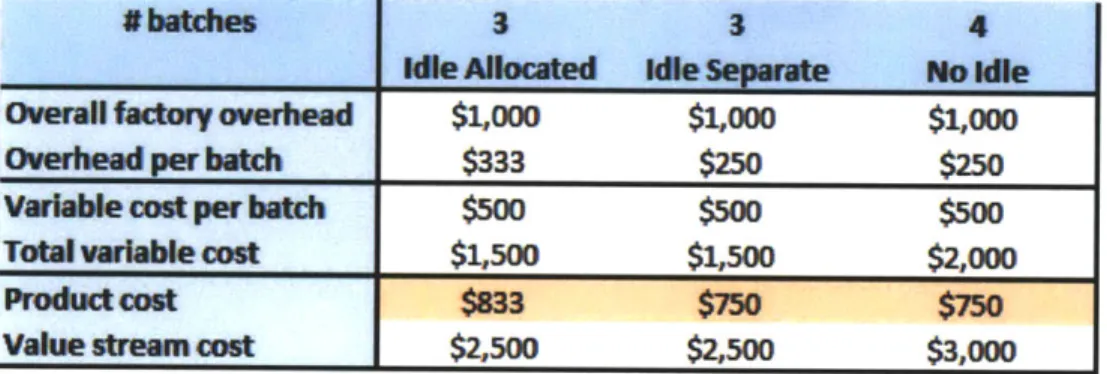
Table 2 Impact of Idle Capacity on Costs (plant capacity = 4 batches/yr)
#battles3
3
4
_________
kleIoca
e d le Sepwt No Weallie Alloasted
desparate
lsil
Overall factory overhead $1,000 $1,000 $1,000
Overhead per batch
$333
$250
$250
Varable cost per batch
$500
$500
$500
Total
varable
cost
$1,500
$1,500
$2,000
Product cost
$33
$M5
$750
Value strean cost
$2,500
$2,500
$3,000
In this example, one result stands out: when idle time is allocated across the products, it looks like the product gets cheaper when capacity utilization goes up. However, the actual work and expenditure per product has not changed. This discrepancy can lead to situations where managers believe their product costs have changed when in reality it is only the plant utilization that is different.
For this model, we decided to report the idle costs separately so that managers could understand the actual incremental cost for a product. If they determine to allocate those costs later on then they can do so as a quick secondary calculation.
Value Stream Costs versus Product Costs
The method of allocating idle time described above is not strictly incorrect. Running a batch really does require the use of the factory's equipment, and if those three batches were not being run then the entire factory would not be needed. In that case, closing the factory would save a large amount of money. However, this view can be misleading. The table above (Table 2) also includes a line called "value
stream cost," which refers to the overall cost of running a product. Looking at a product's value stream instead of batch by batch costs encourages a high-level view and allows managers to see the interaction between different cost drivers. Several of the articles reviewed in chapter 3 focused on this challenge. As they discussed, it is important to see how various drivers, such as run rate and yield, interact with the
costs. This method of looking at overall costs instead of product-specific costs can be very effective but is still not widely adopted; product costs are used too extensively for things like transfer pricing and cost per unit calculations. Nonetheless, having both views available requires only a few additional
calculations once the data are available and can reveal interesting insights. Therefore, this model reports both product by product costs as well as overall costs.1 By including both views of data, users can decide which one will be most relevant and can hopefully avoid some misguided decisions. In the example where the manager decided to outsource his product even though internal costs would have been lower, a view like this could have helped him make the most appropriate decision.
4.2 Assumptions
Cost calculations are complex because they are influenced by many factors. To make a cost model feasible, these calculations have to be simplified. Simplifying the model and focusing on the most important elements helps in two ways. First, it allows the model to be easier to use; by choosing the correct assumptions, this ease of use can be accomplished without sacrificing too much model precision. Simplification also ensures that model users can understand where results come from and which factors influence them.
Many assumptions were used in the model to achieve these goals. This section describes the most relevant assumptions that were made.
Allocation of Fixed Costs (Overhead)
Many costs in the factory are not related directly to a specific batch or product. Instead, these costs are related to general overhead that is needed to run the factory. The high cost of overhead is especially
1 The overall costs reported in this model are not strictly the same as value stream costs. A true value stream will
include all aspects of product creation, spanning all the way from raw material acquisition to customer receipt of the product. The overall costs described here only include factory costs and, most notably, do not include any revenues from product sales. Nonetheless, this approximation will still give insights as a starting point for analysis; this can be extended as the results prove useful.