HAL Id: hal-01432279
https://hal.archives-ouvertes.fr/hal-01432279
Submitted on 7 Nov 2018
HAL is a multi-disciplinary open access
archive for the deposit and dissemination of
sci-entific research documents, whether they are
pub-lished or not. The documents may come from
teaching and research institutions in France or
abroad, or from public or private research centers.
L’archive ouverte pluridisciplinaire HAL, est
destinée au dépôt et à la diffusion de documents
scientifiques de niveau recherche, publiés ou non,
émanant des établissements d’enseignement et de
recherche français ou étrangers, des laboratoires
publics ou privés.
Distributed under a Creative Commons Attribution| 4.0 International License
The time course of visual influences in letter recognition
Sylvain Madec, Kevin Le Goff, Stéphanie K. Riès, Thierry Legou, Guillaume
Rousselet, Pierre Courrieu, F. -Xavier Alario, Jonathan Grainger, Arnaud Rey
To cite this version:
Sylvain Madec, Kevin Le Goff, Stéphanie K. Riès, Thierry Legou, Guillaume Rousselet, et al.. The
time course of visual influences in letter recognition. Cognitive, Affective, and Behavioral Neuroscience,
Springer Verlag, 2016, 16 (3), pp.406-414. �10.3758/s13415-015-0400-5�. �hal-01432279�
The time course of visual influences in letter recognition
Sylvain Madec1 & Kévin Le Goff1 & Stéphanie K. Riès2 & Thierry Legou3,5 &Guillaume Rousselet4 & Pierre Courrieu1 & F.-Xavier Alario1,5 & Jonathan Grainger1,5 &
Arnaud Rey1,5
Abstract This study builds on a specific characteristic of let-ters of the Roman alphabet—namely, that each letter name is associated with two visual formats, corresponding to their uppercase and lowercase versions. Participants had to read aloud the names of single letters, and event-related potentials (ERPs) for six pairs of visually dissimilar upper- and lower-case letters were recorded. Assuming that the end product of processing is the same for upper- and lowercase letters sharing the same vocal response, ERPs were compared backward, starting from the onset of articulatory responses, and the first significant divergence was observed 120 ms before response onset. Given that naming responses were produced at around 414 ms, on average, these results suggest that letter processing is influenced by visual information until 294 ms after stimulus onset. This therefore provides new empirical evidence regard-ing the time course and interactive nature of visual letter per-ception processes.
Keywords Letter processing . Visual perception . Event-related potentials
Letters are the building blocks of alphabetic writing systems. They consist of two-dimensional visual patterns associated with a single name, and in most alphabetic writing systems each letter can be represented by uppercase and lowercase forms (i.e., BA^ and Ba^ are both associated with the letter name in French, /a/). Due to their visual simplicity, on one hand, and their variability on various dimensions (e.g., size, shape, case), on the other, letters present several interesting properties for the experimental study of reading processes and visual perception (Grainger, Rey, & Dufau,2008). With this kind of simple and easy-to-control experimental material, sev-eral recent studies have shed new light on the functional orga-nization of letter perception and on its temporal dynamics.
Concerning the functional organization of letter perception, neuropsychological dissociations and classical electrophysio-logical studies suggest that letter perception can be decomposed into four levels of processing: a visual-feature level (coding for elementary visual properties or visual features; e.g., Hubel & Wiesel, 1959), a perceptual level (coding for template representations of letters; e.g., Perri, Bartolomeo, & Silveri,1996), an abstract or shape-invariant level (i.e., a level that is independent of the specific visual properties associated with different cases and different fonts; e.g., Miozzo & Caramazza,1998), and a phonological level (coding for the letter’s name; e.g., Mycroft, Hanley, & Kay,
2002; Rey & Schiller, 2006). This neuropsychological evi-dence is generally consistent with the idea of a hierarchical architecture of the ventral visual cortex, in which visual rep-resentations become gradually invariant from their retinal im-age representations (DiCarlo & Cox,2007; Grainger et al.,
2008; Grill-Spector & Malach, 2004). Moreover, fMRI
* Arnaud Rey
arnaud.rey@univ-amu.fr
1 Laboratoire de Psychologie Cognitive–CNRS, Aix-Marseille Université, 3, place Victor Hugo–Case D, 13331 Marseille Cedex 03, France
2
Department of Psychology, Helen Wills Neuroscience Institute, University of California, Berkeley, CA, USA
3 Laboratoire Parole et Langage, CNRS & Aix-Marseille University, Aix-en-Provence, France
4
Institute of Neuroscience and Psychology, College of Medical, Veterinary and Life Sciences, University of Glasgow, Glasgow, UK 5
Brain and Language Research Institute, Aix-Marseille University, Marseille, France
studies have revealed that computations corresponding to these different stages of processing are distributed among dif-ferent brain areas. Visual, abstract, and phonological process-ing would then be spatially embedded in a network corre-sponding to a specific set of cerebral areas (Rothlein & Rapp,2013).
Concerning the temporal dynamics of letter perception, magneto-encephalographic (MEG) studies have revealed an occipital activation at 100 ms after stimulus onset that is not sensitive to the specific content of the stimulus and that has been interpreted as reflecting low-level visual-feature process-ing (Tarkiainen, Cornelissen, & Salmelin,2002; Tarkiainen, Helenius, Hansen, Cornelissen, & Salmelin, 1999). Subsequent inferior occipito-temporal activation has been found after 150 ms post-stimulus-onset and interpreted as reflecting the earliest stage of stimulus-specific processing. Similarly, several event-related potential (ERP) studies have reported results consistent with those obtained in MEG, with ERP differences reflecting low-level visual processing appearing around 100 ms after stimulus onset (e.g., Carreiras, Perea, Gil-López, Abu Mallouh, & Salillas,2013; Petit, Midgley, Holcomb, & Grainger,2006), followed by stimulus-specific processing around 150–170 ms (Wong, Gauthier, Woroch, DeBuse, & Curran,2005). It has been pro-posed that visual templates would be processed around 150– 170 ms (Rey, Dufau, Massol, & Grainger,2009), followed by abstract and phonological processing around 220 ms (Petit et al.,2006). Recent evidence has suggested that phonological processes (i.e., access to the letter’s name) may start earlier— that is, between 150 and 190 ms—and that letter identification processes would be supported by recurrent interactions be-tween visual and phonological codes until response selection (Madec, Rey, Dufau, Klein, & Grainger,2012).
These results are consistent with a model of letter identifi-cation in which visual information (i.e., visual features and letter templates) is processed and contributes to letter identifi-cation in a time window roughly starting at 100 ms after stim-ulus onset and with strong influence on visual codes between 150 and 190 ms. Abstract and phonological letter representa-tions would then be progressively activated through feedforward and feedback loops (Carreiras et al., 2014). However, recent empirical evidence has suggested that visual information still actively influences letter identification after 220 ms (Carreiras et al.,2013; Keage, Coussens, Kohler, Thiessen, & Churches,2014; Mitra & Coch,2009).
In a masked-priming study, Mitra and Coch (2009) com-pared the ERPs for letters and false fonts and found no differences in priming between these conditions for the P150, but also for the P260, suggesting that letter processing is still influenced by visual information in this later time window. Similarly, Carreiras et al. (2013) compared the mag-nitudes of the priming effects for visually similar and dissimilar letters on the P3 component and found a
modulation of the relatedness effect as a function of similarity for this component, suggesting again that, even at this relatively late stage of processing, letter identification would still be modulated by visual similarity. Finally, Keage et al. (2014) compared the ERPs for fluent and disfluent type-faces (i.e., typetype-faces occurring rarely in our reading environ-ment) in a one-back task, and they found significant differen-tial activity between the two conditions on the N1 and P2/N2 components, but also on the P3 component (even if the effect was only marginally significant), suggesting that the influence of visual information may last longer than previously thought. Following up on these recent findings, the goal of the pres-ent study was to provide additional evidence on the time course of visual influences during letter identification. To ad-dress this issue, the present experiment exploits a key feature of letters—that is, their dual visual coding in uppercase and lowercase forms. For example, both the uppercaseBA^ and the lowercaseBa^ activate the same abstract, shape-invariant letter representation, and the same phonological and articula-tory representations. During letter naming, the same motor response (i.e., /a/ in French) needs to be selected, and once these articulatory-output codes are activated, we can assume that the output-production processes are exactly the same for namingBA^ and Ba.^ As is shown in Fig.1, the processing of BA^ and Ba^ should therefore be the same once this processing is driven by abstract or phonological letter representations, and is no longer influenced by visual factors. Therefore, any observed differences in the processing of upper- and lower-case versions of the same letters can be taken as evidence that visual factors are still influencing processing.
Comparing the ERP signals of upper- and lowercase letters from the presentation onset of these visual stimuli would therefore allow us to detect the early visual processing differ-ences that occur between these two visual categories. Previous studies suggested that these early differences should appear around 100 ms post-stimulus-onset (e.g., Carreiras et al.,
Fig. 1 Differences and similarities in the processing of uppercase and lowercase letters that have dissimilar letter shapes (likeBA^ and Ba^). The gray box corresponds to processes that should differ (i.e., involving different visual information), and the white boxes reflect processes that should be the same (i.e., involving abstract [A], phonological [P], and output [Out.] letter representations)
2013; Petit et al.,2006; Tarkiainen et al.,2002; Tarkiainen et al.,1999). Now, the logic of the present experiment was also to look at ERPs from the onset of response production and to move backward in time. Several recent studies have started to use this kind of response-locked analysis in the domain of word production, in order to better specify response selection, response preparation, and response production processes (e.g., Riès, Janssen, Burle, & Alario,2013; Van der Linden et al.,
2014). In the present study, the idea was that by comparing ERPs locked on response onset for a group of matched upper-case versus lowerupper-case letters, and by moving backward in time, the first difference obtained between these ERPs should reflect the last influences of visual processing on letter identi-fication. Response-locked ERPs should therefore provide new evidence about the contribution of visual codes to letter iden-tification and response selection processes.
Method
Participants
Twenty participants, 17 females and three males, with ages ranging from 18 to 35 years (mean age = 21.85,σ = 4.45), participated in the experiment. All participants were right-handed native speakers of French with normal or corrected-to-normal vision.
Material
The stimuli consisted of upper- and lowercase roman alpha-betic letters that were displayed in Inconsolata font (size 128; see Fig.2). Six letter pairs were selected on the basis of their visual dissimilarities between uppercase and lowercase shapes: a/A, b/B, d/D, e/E, n/N, and r/R. We also selected the letter pair c/C as a visually similar control. The 19 remain-ing letters, both in uppercase and lowercase, were used as fillers to reduce anticipatory effects during the task. All stimuli were presented on a 17-in. CRT monitor with a refresh rate of 85 Hz, as white signs on an 800 × 600 pixel black background (32 × 24 cm). The experiment was controlled by a personal computer using E-Prime (Psychology Software Tools, Pittsburgh, PA).
Procedure
After completing informed consent, participants were seated comfortably in a sound-attenuated and dimly lit room. They were asked to read aloud the name of the target letter appearing in the middle of the screen, as quickly and accurate-ly as possible. They were also asked to remain as relaxed as possible in order to avoid movements that could generate ar-tifacts on the electroencephalographic (EEG) recordings (e.g.,
eye blinks, frowning). Finally, they were asked to keep their mouth in resting position (semi-closed for all of them) be-tween trials.
A trial started with a fixation cross (symbol B+^) for 200 ms, followed by an empty screen for a randomized dura-tion ranging from 500 to 700 ms. The target letter was then presented in the middle of the screen and remained until re-sponse, or for a maximal duration of 1,000 ms. An empty screen (black background) was finally presented for a random-ized duration ranging from 1,000 to 1,300 ms.
The experiment started by a training session, during which participants were randomly exposed to the 52 letters of the alphabet (26 in uppercase and 26 in lowercase) and were asked to perform the naming task. This was followed by the experimental session, which was composed of 14 blocks of 125 trials. Each block started with five filler trials, followed by pseudorandomized trials consisting of 100 target letters and 20 filler trials. The only constraint for the pseudorandomization was to avoid name repetition of a target letter (e.g., no A→ A, A→ a, a → A, or a → a). Filler trials were used during the blocks to minimize anticipation effects. Each of the 12 target letters (i.e., six uppercase and six lowercase) appeared ran-domly 100 times during the entire experiment, leading to a total of 1,750 trials. The total duration of the recording time was approximately 90 min.
Behavioral data recording and preprocessing
Reaction times (RTs) were not recorded from the voice-key triggering system provided with the serial response box of E-Prime. This was because several studies have shown that
Fig. 2 Uppercase and lowercase letters displayed in Inconsolata font. The boxed letters correspond to the six critical pairs of uppercase/ lowercase letters used in the experiment
differences in microphone sensitivity can lead to important differences in the detection of the acoustic energy produced by the first and second phonemes (Duyck et al.,2008; Rastle & Davis,2002; Rey, Courrieu, Madec, & Grainger, 2013). Therefore, letter naming was completely digitized at 22040 Hz on a single channel, in order to check for response accuracies and to determine RTs offline. On each digitized trial, we first employed a semi-automatic procedure by apply-ing an algorithm based on the Teager–Kaiser operator, which detects sudden variations of energy in the acoustic signal (Li, Zhou, & Aruin,2007; see also Riès, Legou, Burle, Alario, & Malfait,2012). Second, the results of this operator were con-voluted through a moving average window, acting as a low-pass filter discarding artifactual noises unrelated to the partic-ipant’s answer. Third, we visually checked the detected onsets and manually corrected them when needed. Every trial was listened to, and the ones associated with errors or hesitations were discarded. Finally, for every letter and every participant, we relied on robust estimators (Wilcox,2005,2012); we com-puted the median naming RTs1and the median absolute devi-ation of the medians (MAD), and discarded trials associated with outlier RTs, as defined by the MAD–median rule (see Davies & Gather,1993; Rousseeuw & Van Zomeren,1990; Wilcox,2012).
EEG data recording
The EEG was recorded from 64 Ag/AgCl Active-2 p r e a m p l i f i e d e l e c t r o d e s ( B I O S E M I , A m s t e r d a m , The Netherlands; 10–20 System positions). The vertical electro-oculogram (EOG) was recorded by means of one elec-trode (Ag/AgCl) just below the right eye. The horizontal EOG was recorded with two electrodes (Ag/AgCl) positioned over the two outer canthi. The analog signal was digitized at 1024 Hz. Electrode offsets were kept below ±25μV.
EEG preprocessing
Offline, the data were referenced on the average of the 64 scalp electrodes. Continuous signals were band-pass filtered by using a Butterworth filter of order 4 between 1 and 100 Hz. Because the purpose of this experiment was to find the onsets of differences between uppercase and lowercase letters, we relied on the property of causal filters (filters applied in only one direction, as opposed to noncausal filters applied in both forward and backward directions) of preserving the onsets of differences (Rousselet,2012; VanRullen,2011; Widmann & Schröger,2012). Filters were therefore applied in the forward direction only for stimulus-locked analyses, and in the back-ward direction only for response-locked analyses.
Stimulus-locked preprocessing The resulting signal was then epoched between–200 and 1,000 ms (before and after letter onset), and the epoch’s baseline was computed from – 200 to 0 ms. Epochs corresponding to incorrect or outlier trials (as identified by the behavioral analysis) were rejected from further processing. We relied on an independent components analysis (ICA; Makeig, Bell, Jung, & Sejnowski, 1996), as implemented in the runica EEGLAB function (Delorme & Makeig, 2004; Delorme, Sejnowski, & Makeig,2007), to identify artifactual ocular components related to blink activi-ties. They were identified and removed by visual inspection of their scalp topographies, time courses, and activity spectra.
In order to reduce electromyographic (EMG) artifacts re-lated to the articulation of the target letter on the EEG signal, we used a blind source separation algorithm based on canon-ical correlation analysis (BSS-CCA), which separates sources on the basis of their degree of autocorrelation (De Vos et al.,
2010; see also Riès, Janssen, Dufau, Alario, & Burle,2011). BSS-CCA method was applied on nonoverlapping consecu-tive windows of 1.2 s (corresponding to the maximum length of an epoch), enabling the targeting of local EMG bursts re-lated to articulation (we used the EEGLAB plug-in Automatic Artifact Removal, implemented by Gómez-Herrero; available
atwww.cs.tut.fi/~gomezher/projects/eeg/software.htm#aar).
EMG-related components were selected according to their power spectral density. Components were considered to be EMG activity if their average power in the EMG frequency band (approximated by 15–30 Hz) was at least 1/5 of the average power in the EEG frequency band (approximated by 0–15 Hz; see De Vos et al.,2010). Finally, all other artifacted epochs were rejected after a trial-by-trial visual inspection. Response-locked preprocessing RTs corresponding to vocal responses (from the behavioral processing) were added as triggers in the EEG signal, which was epoched between – 500 and +200 ms before and after, respectively, the onset of the vocal response. The epoch’s baseline was computed from 0 (= onset of vocal response) to 200 ms (after the onset). We then excluded epochs using the same principles and proce-dures as in the stimulus-locked analysis—that is, epochs cor-responding to outliers or incorrect trials were excluded from further analysis. We then applied the same ICA algorithm to identify and exclude blinks, and the same BSS-CCA algo-rithm to exclude EMG activity related to articulation. Finally, epochs previously marked as artifacted during the stimulus-locked analysis were also excluded. Consequently, the same epochs were kept for the stimulus-locked analyses and the response-locked analyses.
EEG data analysis (stimulus- and response-locked) The data from individual participants were analyzed using the LIMO EEG toolbox, an extension to the EEGLAB
1
Due to the large number of data points per condition and per participant, the median and the mean give substantially equivalent results.
environment (Pernet, Chauveau, Gaspar, & Rousselet,2011). LIMO combines robust statistics and controls for multiple comparisons, allowing the testing of every time frame (tf) and every electrode (e), while controlling for Type I errors without sacrificing power. We give details hereafter about the rationale of our analysis, and more details can be found in Pernet et al. (2011).
At the individual level, trials corresponding to uppercase and lowercase letters were averaged separately. At the group level, we relied on a robust estimator of central tendency, the trimmed mean, to assess the differences between upper- and lowercase letters. For each electrode/time frame pair (e, tf), taken independently, amplitudes collected on the group were sorted, and the lowest 20 % and the highest 20 % of the distribution were trimmed. For each (e, tf) pair, the remaining amplitudes were then averaged. Since it preserves the central part of the distribution, the trimmed mean has been proved to be a robust and useful measure of location (see Wilcox,2005; Wilcox & Keselman,2003). Moreover, the trimmed mean has proven its utility in recent electrophysiological studies, be-cause of the robustness of this measure to contamination by extreme values (Desjardins & Segalowitz,2013; Rousselet, Husk, Bennett, & Sekuler, 2008). Inferential results were computed by relying on the Yuen procedure, a robust coun-terpart to the paired t test, with a threshold fixed at p < .05 (see Wilcox,2005,2012). Because statistical tests were performed for every (e, tf) pair, we corrected for multiple comparisons by using a bootstrap T approach at the cluster level (with p < .01; see Maris & Oostenveld,2007; Pernet et al.,2011; Rousselet, Gaspar, Wieczorek, & Pernet,2011).
Results
Due to noisy EEG signals, three participants were excluded from further analysis. Moreover, RTs corresponding to the vocal responses of C/c trials were not analyzed further because of major difficulties in determining the response onsets. Indeed, it appeared that the onset of the phoneme /s/ (corre-sponding to the first phoneme of the letter’s name C/c; i.e., /se/ in French) was confounded with the baseline noise, character-ized by a frequency of 5000 Hz.
Behavioral results
First, trials associated with errors or hesitations were excluded (M = 2.6 %,σ = 2.3 %, range = 8 %). Second, on the basis of the remaining trials, we identified and excluded outlier trials by relying on the MAD–median rule per letter and participant (M = 5.2 %,σ = 0.9 %, range = 4 %). Third, we excluded trials identified as artifacted epochs during EEG preprocesssing (M = 11.2 %,σ = 8.6 %, range = 29 %).
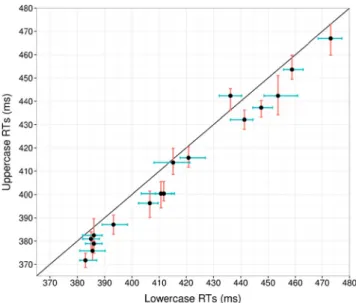
On the basis of the remaining trials, we computed median RTs and confidence intervals (CIs) by using a percentile boot-strap approach (with 2,000 bootboot-strap samples andα = .05) corresponding to uppercase and lowercase letters, by partici-pants. Figure3shows the median RTs for uppercase and low-ercase letters by participants, and we found that upplow-ercase letters were named slightly but significantly faster. We then compared the RTs for upper- and lowercase letters by relying on the Yuen procedure.2The trimmed mean for uppercase letters was Mt= 408 ms (SE = 10 ms, CI = [385, 431]), and
the trimmed mean for lowercase letters was Mt= 414 ms (SE =
10 ms, CI = [391, 437]). The 6-ms difference between the two conditions (with CI = [3, 10]) was significant (Ty= 3.86, p <
.005).3Despite this small mean difference, Cohen’s effect size value revealed that it corresponds to a large effect (d = 1.51). The mean overall RT for naming upper- and lowercase letters was estimated at 414 ms.
Stimulus-locked results
Epochs corresponding to the same trials used for the behav-ioral analysis were included in the stimulus-locked analysis. The mean ERPs corresponding to uppercase and lowercase letters were computed for every participant, electrode, and time frame. Figures 4a and b show significant Tyvalues,
masked for significance (p < .01 for the cluster statistic). We observe three significant temporal windows. The first one, from 110 to 140 ms, appears bilaterally at occipital sites (P6, P8, PO8, PO3, PO7, O1) and fronto-central sites (FC1, C1, FCz, Cz). The second one, from 150 to 190 ms, is mostly localized at left occipital sites (PO7, P7, P9) and right fronto-central sites (FC6, FC4, C4). The third one, from 200 to 240 ms, is mostly localized at right occipital sites (PO7, P7, P9) and central sites (FC6, FC4, C4). Figures 4c and d, re-spectively, represent the 20 % trimmed mean ERPs in the uppercase and lowercase conditions, across participants, at electrodes C1 and P7. The 95 % CIs are estimated by a boot-strap percentile approach.
Response-locked analysis
A statistical analysis similar to the one computed with the stimulus-locked data was performed. On the basis of the be-havioral analysis, the mean RT over all letters and participants was equal to 414 ms, which was taken as the average response
2The Yuen procedure compares the marginal trimmed means (noted Mt) for each condition. The statistical test produced by this procedure, which is a robust analogue to the t value, will be subsequently referred as to Ty. 3Note that similar results were obtained with a standard computation of the mean—that is, the mean for uppercase letters being Mupper= 410 ms, and the mean for lowercase letters being Mlower= 417 ms. Consistent with our robust analysis, a classical paired t test indicated a significant differ-ence between these two conditions: t(16) = 6.21, p < .005.
onset. In Fig.5, the results are displayed by going back in time from this value. Figures5a and bshow a significant window
of differences between +294 and +224 ms, relative to the stimulus onset at 0. This difference appears bilaterally at oc-cipital sites, mostly at right sites (P4, P6, and PO4), and fronto-central sites, mostly at left sites (FC1, C1, FCz, and Cz). Figures 5c and d, respectively, represent the trimmed mean ERPs related to the uppercase and lowercase conditions, across participants, at electrodes O1 and AF7. The 95 % CIs are estimated by a bootstrap percentile approach.
Discussion
Three main results were obtained in this experiment. First, at a behavioral level, we found that uppercase letters are named faster than lowercase letters (6 ms, 95 % CI [4, 9]). Despite its small magnitude, this effect is large according to Cohen’s d (1.51). Second, when the comparison between the ERPs to uppercase and lowercase letters was made with a stimulus-locked approach, a first difference was obtained around 120 ms after stimulus onset. Third, when the same comparison was made with a response-locked approach, an initial differ-ence was detected (backward) at 120 ms before response
Fig. 3 Median reaction times (RTs) for lowercase and uppercase letters for each participant. The different colored lines represent the 95 % bootstrap confidence intervals for uppercase and lowercase letters
Fig. 4 Stimulus-locked analysis for the lowercase-versus-uppercase comparison. (a) Tyvalues masked for significance on the basis of a cluster test (p < .01). The y-axis represents the 64 recording electrodes of the scalp, with electrodes 1 to 7 being FP1, AF7, AF3, F1, F3, F5, and F7; electrodes 8 to 19 being FT7, FC5, FC3, FC1, C1, C3, C5, T7, TP7, CP5, CP3, and CP1; electrodes 20 to 27 being P1, P3, P5, P7, P9, PO7, PO3, and O1; electrodes 28 to 32 being Iz, Oz, POz, Pz, and CPz; electrodes 33 to 42 being FPz, FP2, AF8, AF4, AFz, Fz, F2, F4, F6,
and F8; electrodes 43 to 56 being FT8, FC6, FC4, FC2, FCz, Cz, C2, C4, C6, T8, TP8, CP6, CP4, and CP2; and electrodes 57 to 64 being P2, P4, P6, P8, P10, PO8, PO4, and O2. (b) Topographic maps of Tyvalues, masked for significance, from 120 to 240 ms. (c) Trimmed means and 95 % confidence intervals of the event-related potentials (ERPs) corresponding to lowercase and uppercase letters, for the electrode C1, between–200 ms to 500 ms (with 0 corresponding to letter onset). (d) Same as panel c, but for electrode P7
onset, which corresponds to 294 ms on average after stimulus onset, given that letter-naming latencies were on average around 414 ms.
The faster responses to uppercase than to lowercase letters might seem counterintuitive, since lowercase letters appear more frequently in our environment than uppercase letters do (New & Grainger,2011). However, in the present situation the stimuli were presented in isolation, whereas in an ecolog-ical reading situation lowercase letters are rarely presented in isolation, but are embedded within words. Therefore, context effects could account for the faster recognition of uppercase letters, which may appear more frequently in isolation. This difference could also be due to more elementary visual prop-erties, such as the relative luminance or contrast of the stimuli. Indeed, the amount of white pixels on a black background may explain the small but consistent advantage of uppercase letters and the speeded recognition.
The stimulus-locked ERP difference at 120 ms between uppercase and lowercase letters is consistent with the report of low-level visual-processing differences within this time window (Carreiras et al.,2013; Petit et al.,2006; Tarkiainen et al.,2002; Tarkiainen et al.,1999). This difference can sim-ply be interpreted in terms of elementary visual differences between these two sets of letters, leading to a divergence in the evoked electrical responses. Moreover, this result
demonstrates that the selected upper- and lowercase letters were sufficiently visually different to induce differential low-level visual processing, as revealed by these ERP differences. Although we did not rely on an analysis emphasizing compo-nent latencies—since we tested every time point and every electrode in this study—the early difference at 120 ms at oc-cipital sites (see Fig.4d) is consistent with a positive shift in time for the lowercase as compared to the uppercase N1. Therefore, the subsequent significant differences, around 150–190 ms and around 200–240 ms, are more difficult to interpret, because they could simply result from the initial difference obtained at 120 ms, which could have produced a processing advantage for uppercase letters (and later on, faster overall RTs).
More crucially for the purpose of the present study, by comparing the ERPs to uppercase and lowercase letters locked on vocal responses, the difference found around 120 ms be-fore the onset of the vocal response (made, on average, around 414 ms) suggests that the offset of visual influences would take place, on average, around 294 ms. This result is consis-tent with recent findings on letters that had used the priming paradigm (i.e., Carreiras et al.,2013; Mitra & Coch,2009) and that suggested an influence of visual information as late as 300 ms after stimulus onset (for a similar result, see also Keage et al.,2014). Moreover, since we tested for statistical
Fig. 5 Response-locked analysis for the lowercase-versus-uppercase comparison. (a) Tyvalues masked for significance on the basis of a cluster test (p < .01). See Fig.4for the correspondence between the numbers on the y-axis and electrodes. (b) Topographic maps of Ty values, masked for significance, from +275 to +235 ms. (c) Trimmed
means and 95 % confidence intervals of the ERPs corresponding to lowercase and uppercase letters, for the electrode O1, from +600 to– 100 ms (+414 ms being the mean response onset, 0 corresponding to letter onset). (d) Same as panel c, but for electrode AF7
significance at every time point and every electrode from the vocal response, our methodology provides a means to assess more precisely the offset of visual influences, which is there-fore estimated on average at 290–300 ms.
This result provides additional constraints for models of letter perception processes (Grainger et al., 2008). Indeed, the facts that visual information still influences letter process-ing until 294 ms post-stimulus-onset and that participants start producing letter names on average around 414 ms would leave 120 ms (i.e., 414– 294 ms) for processing nonvisual informa-tion (i.e., abstract and phonological representainforma-tions) and gen-erating the output articulatory response. This small time win-dow (i.e., 120 ms) is certainly computationally too short to encompass all of these nonvisual processes, suggesting that visual and nonvisual processes cannot be encapsulated, and have to interact earlier in time (Carreiras et al., 2014). Similarly, the fact that abstract or phonological effects have been reported much earlier than 290–300 ms (e.g., Madec et al.,2012; Petit et al.,2006) also indicates that visual and nonvisual levels of processing are coactivated at some point in time during letter identification, and would therefore interact following a cascaded interactive-activation framework (McClelland & Rumelhart,1981).
Before concluding, one can note that the logic of the pres-ent study rests on the assumption that the end product of processing is the same for both uppercase and lowercase let-ters before producing the vocal response. However, one could argue that even if response selection is completed and the motor program corresponding to the letter’s name has been activated, some kind of visual processing could still be occur-ring in parallel, sustaining the visual representation of the just-processed letter in a short-term memory buffer. This possibil-ity cannot be excluded, even though it would not seem to have any major consequences on the present results. Indeed, this potentially sustained visual activity is certainly independent of the vocal response that we used as a trigger in the present response-locked analyses. By averaging the EEG signal on the onset of the vocal responses, we eliminated any activity that was not specifically related to the generation of that re-sponse (like any potentially sustained visual activity). The remaining difference that we observed is therefore likely due to differences in visual processing that contributed toward letter identification and response selection.
To summarize, the present study was mainly concerned with the time course of letter perception and with determining the offset of visual influences, which according to our data would end around 290–300 ms after stimulus presentation. Our results and previous empirical findings therefore suggest that visual information is processed in a time window starting around 100 ms after stimulus onset and lasting around 190– 200 ms. This long-lasting time window (i.e., 200 ms) is con-sistent with a cascaded interactive-activation model of letter perception in which visual information feeds forward
information to abstract and phonological letter representations well before the processing of such visual information has ter-minated. The end product of this cascaded interactive process would be the selection of the output motor response.
Author note This study was funded by the European Research Council (ERC Research Grant 230313) and carried out within the Labex BLRI (ANR-11-LABX-0036). It has benefited from support from the French government, managed by the French National Agency for Research (ANR), under the projectBInvestments for the Future, A*MIDEX^ (ANR-11-IDEX-0001-02). S.K.R. was supported by a postdoctoral grant from the Fyssen Foundation and by the National Institute on Deafness and Other Communication Disorders of the National Institutes of Health, under Award Number F32DC013245. The content is solely the responsi-bility of the authors and does not necessarily represent the official views of the National Institutes of Health.
References
Carreiras, M., Armstrong, B. C., Perea, M., & Frost, R. (2014). The what, when, where, and how of visual word recognition. Trends in Cognitive Sciences, 18, 90–98. doi:10.1016/j.tics.2013.11.005
Carreiras, M., Perea, M., Gil-López, C., Abu Mallouh, R., & Salillas, E. (2013). Neural correlates of visual versus abstract letter processing in Roman and Arabic scripts. Journal of Cognitive Neuroscience, 25, 1975–1985. doi:10.1162/jocn_a_00438
Davies, L., & Gather, U. (1993). The identification of multiple outliers. Journal of the American Statistical Association, 88, 782–792. doi:
10.1080/01621459.1993.10476339
De Vos, D. M., Riès, S., Vanderperren, K., Vanrumste, B., Alario, F.-X., Van Huffel, S., & Burle, B. (2010). Removal of muscle artifacts from EEG recordings of spoken language production. Neuroinformatics, 8, 135–150. doi:10.1007/s12021-010-9071-0
Delorme, A., & Makeig, S. (2004). EEGLAB: An open source toolbox for analysis of single-trial EEG dynamics including independent component analysis. Journal of Neuroscience Methods, 134, 9–21. doi:10.1016/j.jneumeth.2003.10.009
Delorme, A., Sejnowski, T., & Makeig, S. (2007). Enhanced detection of artifacts in EEG data using higher-order statistics and independent component analysis. NeuroImage, 34, 1443–1449. doi:10.1016/j. neuroimage.2006.11.004
Desjardins, J. A., & Segalowitz, S. J. (2013). Deconstructing the early visual electrocortical responses to face and house stimuli. Journal of Vision, 13(5), 22. doi:10.1167/13.5.22
DiCarlo, J. J., & Cox, D. D. (2007). Untangling invariant object recogni-tion. Trends in Cognitive Sciences, 11, 333–341. doi:10.1016/j.tics. 2007.06.010
Duyck, W., Anseel, F., Szmalec, A., Mestdagh, P., Tavernier, A., & Hartsuiker, R. J. (2008). Improving accuracy in detecting acoustic onsets. Journal of Experimental Psychology: Human Perception and Performance, 34, 1317–1326. doi:10.1037/0096-1523.34.5. 1317
Grainger, J., Rey, A., & Dufau, S. (2008). Letter perception: From pixels to pandemonium. Trends in Cognitive Sciences, 12, 381–387. doi:
10.1016/j.tics.2008.06.006
Grill-Spector, K., & Malach, R. (2004). The human visual cortex. Annual Review of Neuroscience, 27, 649–677. doi:10.1146/annurev.neuro. 27.070203.144220
Hubel, D., & Wiesel, T. (1959). Receptive fields of single neurons in the cat’s striate cortex. Journal of Physiology, 148, 574–591. Keage, H., Coussens, S., Kohler, M., Thiessen, M., & Churches, O.
typeface: An event-related potential study. Brain and Cognition, 88, 83–89. doi:10.1016/j.bandc.2014.05.001
Li, X., Zhou, P., & Aruin, A. S. (2007). Teager–Kaiser energy operation of surface EMG improves muscle activity onset detection. Annals of Biomedical Engineering, 35, 1532–1538.
Madec, S., Rey, A., Dufau, S., Klein, M., & Grainger, J. (2012). The time course of visual letter perception. Journal of Cognitive Neuroscience, 24, 1645–1655. doi:10.1162/jocn_a_00178
Makeig, S., Bell, A. J., Jung, T.-P., & Sejnowski, T. J. (1996). Independent component analysis of electroencephalographic data. In D. Touretzky, M. Moser, & M. Hasselmo (Eds.), Advances in neural information processing systems (Vol. 8, pp. 145–151). Cambridge: MIT Press.
Maris, E., & Oostenveld, R. (2007). Nonparametric statistical testing of EEG-and MEG-data. Journal of Neuroscience Methods, 164, 177– 190. doi:10.1016/j.jneumeth.2007.03.024
McClelland, J. L., & Rumelhart, D. E. (1981). An interactive activation model of context effects in letter perception: I. An account of basic findings. Psychological Review, 88, 375–407. doi: 10.1037/0033-295X.88.5.375
Miozzo, M., & Caramazza, A. (1998). Varieties of pure alexia: The case of failure to access graphemic representations. Cognitive Neuropsychology, 15, 203–238. doi:10.1080/026432998381267
Mitra, P., & Coch, D. (2009). A masked priming ERP study of letter processing using single letters and false fonts. Cognitive, Affective, & Behavioral Neuroscience, 9, 216–228. doi:10.3758/CABN.9.2. 216
Mycroft, R., Hanley, J. R., & Kay, J. (2002). Preserved access to abstract letter identities despite abolished letter naming in a case of pure alexia. Journal of Neurolinguistics, 15, 99–108. doi:10.1016/ S0911-6044(01)00003-3
New, B., & Grainger, J. (2011). On letter frequency effects. Acta Psychologica, 138, 322–328. doi:10.1016/j.actpsy.2011.07.001
Pernet, C. R., Chauveau, N., Gaspar, C., & Rousselet, G. A. (2011). LIMO EEG: A toolbox for hierarchical LInear MOdeling of ElectroEncephaloGraphic data. Computational Intelligence and Neuroscience, 2011, 3. doi:10.1155/2011/831409
Perri, R., Bartolomeo, P., & Silveri, M. C. (1996). Letter dyslexia in a letter-by-letter reader. Brain and Language, 53, 390–407. doi:10. 1006/brln.1996.0055
Petit, J. P., Midgley, K. J., Holcomb, P. J., & Grainger, J. (2006). On the time course of letter perception: A masked priming ERP investiga-tion. Psychonomic Bulletin & Review, 13, 674–681. doi:10.3758/ BF03193980
Rastle, K., & Davis, M. H. (2002). On the complexities of measuring naming. Journal of Experimental Psychology: Human Perception and Performance, 28, 307–314. doi:10.1037/0096-1523.28.2.307
Rey, A., Courrieu, P., Madec, S., & Grainger, J. (2013). The unbearable articulatory nature of naming: On the reliability of word naming responses at the item level. Psychonomic Bulletin & Review, 20, 87–94. doi:10.3758/s13423-012-0336-5
Rey, A., Dufau, S., Massol, S., & Grainger, J. (2009). Testing computa-tional models of letter perception with item-level event-related po-tentials. Cognitive Neuropsychology, 26, 7–22. doi:10.1080/ 09541440802176300
Rey, A., & Schiller, N. O. (2006). A case of normal word reading but impaired letter naming. Journal of Neurolinguistics, 19, 87–95. doi:
10.1016/j.jneuroling.2005.09.003
Riès, S., Janssen, N., Burle, B., & Alario, F.-X. (2013). Response-locked brain dynamics of word production. PLoS ONE, 8, e58197. doi:10. 1371/journal.pone.0058197
Riès, S., Janssen, N., Dufau, S., Alario, F.-X., & Burle, B. (2011). General-purpose monitoring during speech production. Journal of Cognitive Neuroscience, 23, 1419–1436. doi:10.1162/jocn.2010. 21467
Riès, S., Legou, T., Burle, B., Alario, F.-X., & Malfait, N. (2012). Why does picture naming take longer than word reading? The contribu-tion of articulatory processes. Psychonomic Bulletin & Review, 19, 955–961. doi:10.3758/s13423-012-0287-x
Rothlein, D., & Rapp, B. (2013). The similarity structure of distributed neural responses reveals the multiple representations of letters. NeuroImage, 89, 331–344. doi:10.1016/j.neuroimage.2013.11.054
Rousseeuw, P. J., & Van Zomeren, B. C. (1990). Unmasking multivariate outliers and leverage points. Journal of the American Statistical Association, 85, 633–639. doi:10.1080/01621459.1990.10474920
Rousselet, G. A. (2012). Does filtering preclude us from studying ERP time-courses? Frontiers in psychology, 3, 131. doi:10.3389/fpsyg. 2012.00131
Rousselet, G. A., Gaspar, C. M., Wieczorek, K. P., & Pernet, C. R. (2011). Modeling single-trial ERP reveals modulation of bottom-up face visual processing by top-down task constraints (in some subjects). Frontiers in Psychology, 2, 137. doi:10.3389/fpsyg.2010.00019
Rousselet, G. A., Husk, J. S., Bennett, P. J., & Sekuler, A. B. (2008). Time course and robustness of ERP object and face differences. Journal of Vision, 8(12), 3. doi:10.1167/8.12.3
Tarkiainen, A., Cornelissen, P. L., & Salmelin, R. (2002). Dynamics of visual feature analysis and object level processing in face versus letter string perception. Brain, 125, 1125–1136. doi:10.1093/brain/ awf112
Tarkiainen, A., Helenius, P., Hansen, P. C., Cornelissen, P. L., & Salmelin, R. (1999). Dynamics of letter string perception in the human occipitotemporal cortex. Brain, 122, 2119–2132. doi:10.1093/ brain/122.11.2119
Van der Linden, L., Riès, S., Legou, T., Burle, B., Malfait, N., & Alario, A. (2014). A comparison of two procedures for verbal response time fractionation. Frontiers in Psychology, 5, 1213. doi:10.3389/fpsyg. 2014.01213
VanRullen, R. (2011). Four common conceptual fallacies in mapping the time course of recognition. Frontiers in Psychology, 2, 365. doi:10. 3389/fpsyg.2011.00365
Widmann, A., & Schröger, E. (2012). Filter effects and filter artifacts in the analysis of electrophysiological data. Frontiers in Psychology, 3, 233. doi:10.3389/fpsyg.2012.00233
Wilcox, R. R. (2005). Introduction to robust estimation and hypothesis testing (2nd ed.). New York: Academic Press.
Wilcox, R. R. (2012). Modern statistics for the social and behav-ioral sciences: A practical introduction (2nd ed.). New York: CRC Press.
Wilcox, R. R., & Keselman, H. J. (2003). Modern robust data analysis methods: Measures of central tendency. Psychological Methods, 8, 254–274. doi:10.1037/1082-989X.8.3.254
Wong, A. C., Gauthier, I., Woroch, B., Debuse, C., & Curran, T. (2005). An early electrophysiological response associated with expertise in letter perception. Cognitive, Affective, & Behavioral Neuroscience, 5, 306–318. doi:10.3758/CABN.5.3.306