HAL Id: hal-03120541
https://hal.archives-ouvertes.fr/hal-03120541
Submitted on 16 Mar 2021HAL is a multi-disciplinary open access archive for the deposit and dissemination of sci-entific research documents, whether they are pub-lished or not. The documents may come from teaching and research institutions in France or abroad, or from public or private research centers.
L’archive ouverte pluridisciplinaire HAL, est destinée au dépôt et à la diffusion de documents scientifiques de niveau recherche, publiés ou non, émanant des établissements d’enseignement et de recherche français ou étrangers, des laboratoires publics ou privés.
Plasma Biomarkers and Identification of Resilient
Metabolic Disruptions in Patients With Venous
Thromboembolism Using a Metabolic Systems Approach
K. Fraser, N. C. Roy, L. Goumidi, A. Verdu, P. Suchon, Felipe Leal Valentim,
David-Alexandre Tregouet, P. E. Morange, J. C. Martin
To cite this version:
K. Fraser, N. C. Roy, L. Goumidi, A. Verdu, P. Suchon, et al.. Plasma Biomarkers and Identification of Resilient Metabolic Disruptions in Patients With Venous Thromboembolism Using a Metabolic Systems Approach. Arteriosclerosis, Thrombosis, and Vascular Biology, American Heart Association, 2020, 40 (10), pp.2527-2538. �10.1161/atvbaha.120.314480�. �hal-03120541�
1 Plasma biomarkers and identification of resilient metabolic disruptions in patients with venous thromboembolism using a metabolic systems approach
Karl Fraser1,2,3, Nicole C Roy1,2,3,4,5, Louisa Goumidi6, Alexandre Verdu8, Pierre Suchon6,8 Felipe Leal-Valentim10, David-Alexandre Trégouët10, Pierre-Emmanuel Morange6,9 and Jean-Charles Martin6,7
1 Food Nutrition and Health, AgResearch Grasslands, Private Bag 11008, Palmerston North,
New Zealand.
2 High-Value Nutrition National Science Challenge, Auckland, New Zealand. 3 Riddet Institute, Massey University, New Zealand.
4 Liggins Institute, University of Auckland, New Zealand Paris, France.
5 Department of Human Nutrition, University of Otago, Dunedin, New Zealand. 6 C2VN, INRAE, INSERM, Aix Marseille Univ, Marseille, France
7 BIOMET, Aix Marseille Univ, Marseille, France 8 Bruker Daltonics, Marne la Vallée, France. 9 APHM, 13005 Marseille, France.
10 INSERM U1219, Bordeaux Population Health Research Center, University of Bordeaux,
Bordeaux, France.
Running title: metabolomics to describe post-VTE patients
Corresponding Author: Karl Fraser
Tel: +64-6-351-8222
E-Mail: karl.fraser@agresearch.co.nz
Keywords: Metabolomics, thrombosis, oxidative stress, MARTHA cohort
Subject terms: biomarkers, clinical studies, computational biology, metabolism, thrombosis, embolism
Word count: 7478
Total number of 5 figures and 1 table
TOC category - clinical and population studies
TOC subcategory - Thrombosis
2 Abstract:
1
2
Objective:3
Deep vein thrombosis and pulmonary embolism referred as venous
4
thromboembolism (VTE) are a common cause of morbidity and mortality. Plasma
5
from healthy controls or individuals who have experienced a VTE were analyzed
6
using metabolomics to characterize biomarkers and metabolic systems of VTE
7
patients.
8
Approach and Results:
9
Polar metabolite and lipidomic profiles from plasma collected 3 months after an
10
incident VTE were obtained using liquid chromatography mass spectrometry
(LC-11
MS). Fasting-state plasma samples from 42 patients with venous thromboembolism
12
(VTE) and 42 healthy controls were measured. Plasma metabolomic profiling
13
identified 512 metabolites forming 62 biological clusters. Multivariate analysis
14
revealed a panel of 21 metabolites altogether capable of predicting VTE status with
15
an area under the curve of 0.92 (P=0.00174, selectivity=0.857, sensitivity=0.971).
16
Multiblock systems analysis revealed 25 of the 62 functional biological groups as
17
significantly affected in the VTE group (P<0.05 to control). Complementary
18
correlation network analysis of the dysregulated functions highlighting a subset of the
19
lipidome composed mainly of n-3 long-chain polyunsaturated fatty acids within the
20
predominant triglycerides as a potential regulator of the post-VTE event biological
21
response, possibly controlling oxidative and inflammatory defence systems, and
22
metabolic disorder associated dysregulations. Of interest was microbiota metabolites
23
including trimethylamine N-oxide that remained associated to post incident VTE
24
patients, highlighting a possible involvement of gut microbiota on VTE risk and
25
relapse.
26
Conclusions
27
These findings show promise for the elucidation of underlying mechanisms and the
28
design of a diagnostic test to assess the likely efficacy of clinical care in patients with
29
VTE.
30
3 Graphic abstract
32
33
34
35
Cases-control study Plasma samples LCMS lipidomics LCMS metabolomics thrombosis score=3.00E-08*(1-methyl-histidine) + 3.62E-08*(butyryl carnitine) + 1.59E-09*(Cys-Gly) -9.91E-08*(Cysteine)+6.47E-09*(D-erythrose) +3.42E-08*(Deoxycarnitine)-3.38E-06*(Deoxyuridine)+3.16E-06*(Glucoaminate)-1.26E-06*(Glucosamine 6-sulfate) +2.74E-09*(Isoleucine) -3.98E-10*(Malate) +2.65E-09*(Malonate)+2.10E-09*(Palmitoleate)+7.12E-09*(Purine)-3.03E-08*(LPMe(18:2)) +9.71E-10*(PS(39:4))+1.32E-7*(PE(16:0/20:5))+3.28E-09*(LPE(20:5))+1.05E-08*(TG(16:0/22:6/22:6))+1.70E-08*(TG(18:1/20:4/22:4))+1.42E-09*(PC(38:8))+2.64E-08*(ZyE(20:4)-0.26606 Thr ombos is sc or e v alues th romb os is con tr ols A
B C no IC true false sum control 35 7 42 thrombosis 38 4 42 95% IC true false ND sum control 28 7 7 42 thrombosis 35 4 3 42 99% IC true false ND sum control 25 7 10 42 thrombosis 34 4 4 42
D
4 Abbreviations
36
37
CV, coefficient of variation38
CV-ANOVA, cross validation analysis of variance
39
ESI, electrospray ionization
40
HILIC, hydrophilic interaction liquid chromatography
41
LC-MS, liquid chromatography mass spectrometry
42
MARTHA, MARseille THrombosis Association
43
PLS, partial least-square
44
PLS-DA, partial least-square discriminant analysis
45
QC, quality control
46
QTOF, quadrupole time of flight
47
RP, reverse phase
48
TMAO, trimethylamine N-oxide
49
VIP, variable importance
50
VTE, venous thromboembolism
51
5 1. Introduction
53
Venous thromboembolism (VTE) including deep vein thrombosis and pulmonary
54
embolism is a complex disease resulting from the interaction between environmental
55
and genetic factors 1. Genetic risk factors (antithrombin, protein C, protein S
56
deficiencies, factor V Leiden and the G20210A prothrombin mutation) are identified in
57
approximatively 30% of VTE patients. Some other frequent genetic markers such as
58
ABO blood group are associated with VTE but the identification of at-risk patients
59
remains uncertain. Besides, among patients with a VTE history, these markers poorly
60
associated with recurrence risk. Currently, the only plasma biomarker routinely used
61
for VTE in a clinical context is D-dimer, a split product from the cross-linked fibrin
62
clot, which has low specificity and is elevated in other conditions such as cancer,
63
inflammation and pregnancy 2, 3.
64
Metabolomics for biomarker discovery is the profiling of all metabolites in
65
biofluids, cells and tissues that can be detected. It is based on detection techniques
66
including nuclear magnetic resonance (NMR), gas chromatography mass
67
spectrometry (GC/MS) or liquid chromatography mass spectrometry (LC/MS), which
68
collect complex multidimensional data. The subsequent analysis of metabolomics
69
data requires the combination of feature extraction tools such as XCMS 4 and both
70
univariate and multivariate statistical analysis toolboxes, and these workflows are
71
now well established 5, 6. As metabolites represent the downstream expression of a
72
genome, transcriptome and proteome, they can reflect the phenotype of an organism
73
at a specific time 7. Thus, over the last decade metabolomics has been widely
74
applied in the identification of potential biomarkers for the early diagnosis and
75
detection of diseases.
76
However, there have been few studies to date investigating VTE using a
77
metabolomics approach. Deguchi et al (2015) found that two acylcarnitines (10:1 and
78
16:1) were low in plasma samples of the 40 VTE patients collected 3 months after
79
the event compared with 40 matched controls 8. Recently a large prospective case
80
(n= 240)-control (n=6963) study investigating the relationship between blood
81
metabolites collected before VTE and the risk of incident VTE found that C5 carnitine
82
was significantly associated with incident VTE and diacylglycerols were enriched in
83
both VTE and pulmonary embolism suffering individuals 9.
84
In the present study, we used a metabolomics approach covering central
85
metabolism and complex lipids to compare polar metabolite, semi-polar metabolite
86
and lipid profiles in plasma collected in post VTE patients to that of VTE free patients.
87
To ensure comprehensive coverage of the metabolome, three untargeted LC–
88
MS/MS analyses were performed in both positive and negative ionization modes.
89
The objectives were to: first, search unique biomarkers that were related to the VTE
90
group and have a set of potential biomarkers diagnostic of VTE resilience in clinically
91
recovered patients, and second, to reveal possible metabolic disruptions remaining in
92
the VTE patients. These results, in combination with clinical parameters, will be
93
valuable for assisting selection of appropriate therapeutic approaches and evaluating
94
the efficacy of clinical care.
95
96
97
98
2. Materials and Methods
99
2.1 Study population
100
A total of 84 subjects comprising of 42 who have experienced a single VTE and 42
101
healthy controls were selected for our study. Forty three other patients with recurrent
102
(over 1 event) VTE were used as a comparison cohort. The MARTHA cohort is
103
extensively described elsewhere 10 and consists of patients enrolled from June 1992
104
to November 2011 at the Reference Centre for Thrombophilia in La Timone hospital,
105
Marseille, France. The MARTHA cohort aims to identify new genetic risk factors for
106
6 VTE. All participants provided written informed consent, and the protocol was
107
approved by the ethics committee of the participating institution.
108
MARTHA bioresources were provided by the Biological Resources Center of the
109
Assistance Publique - Hopitaux de Marseille (CRB-APHM, certified NF S96-900 &
110
ISO 9001 v2015), from the CRB-HV component.
111
A VTE episode was confirmed if objectively diagnosed by medical imaging
112
techniques: compression ultrasound, venography, ventilation/perfusion lung scan,
113
spiral computed tomography or pulmonary angiography, or if the patient received
full-114
dose anticoagulation for at least three months. Healthy controls were VTE free
115
patients generally referred to our centre because they had a family history of VTE. A
116
1st degree family history of VTE was reported in 90% of healthy controls that were
117
unrelated to our cases.
118
119
2.2 Materials
120
Ultrapure water was obtained from a Milli-QTM system (Millipore, Bedford, MA).
121
Solvents, methanol, isopropanol and acetonitrile were of LC–MS grade, chloroform
122
was of HPLC grade and were all purchased from Carlo Erba Reagents (France).
123
Mobile phase modifiers formic acid and ammonium formate were purchased and
124
Sigma–Aldrich Chemicals Co. (St Louis, MO). The 10kDa PES (polyethlyene sulfone)
125
microcentrifuge filters were obtained from VWR (USA).
126
127
2.3 Sample collection and preparation
128
Following overnight fasting, blood samples were collected 3 months after diagnosis
129
of acute thrombosis into sodium citrate collection tubes from each participant and the
130
plasma separated and stored at -80 ºC until extraction. For VTE patients, blood
131
samples were collected after the acute phase (i.e. after at least 3 months of
132
anticoagulation). The samples were randomized into two equal sized analytical
133
batches for metabolomic analyses.
134
Plasma was extracted using two separate extraction protocols to measure
135
polar/semi-polar metabolites and lipids. The polar/semi-polar metabolites were
136
extracted using a methanol precipitation method validated elsewhere 11 12. Briefly,
137
polar/semi-polar compounds in plasma were extracted by adding 400 µL of ice cold
138
methanol to 100 µL of plasma, vortex mixing for 30 sec and placing at -20 ºC for 30
139
min to facilitate protein precipitation. Samples were then thoroughly shaken and
140
centrifuged for 15 min at 11,000 rpm and 4 °C and the supernatants centrifuged
141
through a 10kDa microcentrifuge filter for 45 min under the same conditions, dried
142
under a flow of nitrogen, and stored at -80 °C until analysis. Samples were
re-143
suspended in 300 µL water:acetonitrile (1:1 v/v) and a 100 μL aliquot of each sample
144
placed into two separate vials for polar analysis using HILIC LC-MS and semi-polar
145
analysis using reverse-phase (RP) LC-MS. The remaining 100 µL was spilt equally
146
and combined to obtain quality control (QC) samples for the HILIC and RP analyses.
147
Lipids were extracted by adding 800 µL of ice cold chloroform:methanol (1:1
148
v/v) to 100 µL of plasma in a glass tube, vortex mixing for 30 sec and placing at -20
149
ºC for 30 min to facilitate protein precipitation. Then 400 µL of water was added,
150
followed by vortex mixing for 30 sec and then centrifuged for 15 min at 11,000 rpm
151
and 4 °C. A volume of 100 µL of the lower phase was transferred to a clean glass
152
vial, dried under a flow of nitrogen, and stored at -80 °C until analysis. A further 50 µL
153
of the lower phase was combined to obtain QC samples for the lipid analyses,
154
aliquoted into 100 µL aliquots and subsequently dried. Samples and QCs were
re-155
suspended in 100 µL acetonitrile:isopropanol (1:1 v/v) and placed into a clean glass
156
insert.
157
For each analytical stream (HILIC, RP and lipid), a blank sample (deionized
158
water) was extracted and analyzed 3 times at the start of each analysis batch to
159
assist in removing analytical noise. Following the blanks, 10 consecutive injections of
160
the QC sample were performed to condition the system, and then a QC sample was
161
7 injected every 5 samples during the batches to assist in adjusting for run-order and
162
batch effects.163
164
2.4 Instrumentation165
The HILIC separation was performed on a Thermo Ultimate 3000 HPLC
166
(Milford, MA, USA) while detection used both positive and negative electrospray
167
ionization (ESI+ve/ESI-ve) on a MaXis Impact II qTOF-MS (Bruker Daltonics,
168
Bremen, Germany). The capillary voltage for ESI+ve mode and ESI-ve mode were
169
+4.5 kV and -2.5 kV respectively. Nebulizing gas pressure was 1.8 bar, and the
170
drying gas flow and temperature were 8 L/min and 220 °C.
171
The RP and lipid analyses were both performed on a Thermo Ultimate 3000
172
HPLC connected to a Thermo Q-Exactive Plus MS instrument (Thermo, Bremen,
173
Germany). For RP analysis, the capillary voltage was 3.5 kV for both ESI+ve and
174
ESI−ve modes, nebulizing gas flows for the sheath, auxiliary and sweep gas were
175
30, 8, and 0 arbitrary units respectively and the heated electrospray was operated at
176
310 °C. For lipid analysis, the ESI+ve capillary voltage was +3.0 kV and -3.5 kV in
177
ESI−ve. Nebulizing flows for the sheath, auxiliary and sweep gases were 60, 20, and
178
1 units respectively and the heated electrospray was operated at 370 °C.
179
180
2.5 LCMS analysis
181
For HILIC analyses, separation was performed using a ZIC-HILIC column (4.6
182
× 100 mm, 5 μm, Merck) at 25 °C at a flow rate of 250 µL/min. The mobile phase was
183
acetonitrile-formic acid (99.9:0.1, v/v) (solvent A) and water-ammonium formate (16
184
mM, pH 6.3) (solvent B). The gradient elution programme was: held at 97% A (0-1
185
min), 97-70% A (1-12 min), 70-10% A (12-14.5 min), held at 10% A (14.5-17 min),
186
returned to 97% A (17-18.5 min) and equilibrated for 5.5 min. Samples were kept at 4
187
°C and the injection volume was 2 μL. Scans were acquired on the qTOF-MS at a
188
rate of 2 Hz using a mass range of m/z 45–1000.
189
For RP analyses, separation was performed using a Hypersil GOLD C18
190
column (2.1 × 100 mm, 1.9 μm, Thermo) at 40 °C at a flow rate of 400 µL/min. The
191
mobile phase was water-formic acid (99.9:0.1, v/v) (solvent A) and acetonitrile-formic
192
acid (99.9:0.1, v/v) (solvent B). The gradient elution programme was: held at 100% A
193
(0-1 min), 100-0% A (1-11 min), held at 0% A (11-13 min), returned to 100% A (13-14
194
min) and equilibrated for 2 min. Samples were kept at 4 °C and the injection volume
195
was 5 μL. Data were collected on the Q-Exactive over a mass range of m/z 80-1000
196
at a mass resolution setting of 35,000.
197
For lipid analyses, separation was performed using a Hypersil GOLD C8
198
column (2.1 × 100 mm, 1.9 μm, Thermo) at 55 °C at a flow rate of 400 µL/min. The
199
mobile phase was acetonitrile-water-formic acid (65:34.9:0.1, v/v) containing 10 mM
200
ammonium formate (solvent A) and isopropanol-water-formic acid (90: 9.9:0.1, v/v)
201
containing 10 mM ammonium formate (solvent B). The gradient elution programme
202
was: held at 35% B (0-1 min), 35-60% B (1-4 min), 60-85% B (4-12 min), 85-89% B
203
(12-13 min), 89-100% B (13-13.2 min) held at 100% B (13.2-15.2 min), returned to
204
35% B (15.2-16 min) and equilibrated for 2.2 min. Samples were kept at 10 °C and
205
the injection volume was 5 μL. Data were collected on the Q-Exactive over a mass
206
range of m/z 250-1200 at a mass resolution setting of 70,000. The QC sample or a
207
randomly selected sample were reinjected every 10 samples and data dependant
208
MS2 data was collected for annotation.
209
210
2.5 Data pre-processing and cleaning
211
Data files were converted to the file format mzXML and peak detection and
212
alignment performed using the XCMS 4 ‘cent wave’ algorithm with the following
213
parameters; peakwidth; HILIC = 10–25 s, RP = 4–15 s, Lipid = 5–25 s; snthresh =
214
10; retention time correction using obiwarp method; peak grouping ‘bw’ and ‘mzwidth’
215
parameters of 5 and 0.015 respectively, and gap filling with the default parameters.
216
8 The CAMERA function was subsequently applied to annotate isotopes and group
217
correlated features (pcgroup). Features detected in common between the blank and
218
QC samples (<3:1 mean peak areas of sample:blank) were removed and run order
219
and batch effects were corrected for using the Van der Kloet algorithm (loess model)
220
13 with the online Workflow4Metabolomics 3.0 tool 5. Further filtering was performed
221
after normalization by calculating the coefficient of variation (CV) of variable intensity
222
in the QC samples (cutoff set at <30 %).
223
224
2.6 Compound annotation
225
Feature annotations for the HILIC and RP streams were performed by
226
matching peaks against in-house libraries of authentic standards run under identical
227
conditions 14, while lipid annotations were performed by MS2 spectral matching using
228
LipidSearchTM software (Thermo). Each annotated metabolite was assigned a
229
biological role based upon the Human Metabolome Database (www.hmdb.ca)
230
Metabocard, PubChem description, and KEGG pathways. Complementary
231
information was found in PubMed publications whenever available. The annotated
232
metabolites reported in Supplemental Table 1 were then grouped according to their
233
functional role and analyzed utilizing a hierarchical PLS procedure previously
234
described 11, 15, in which each functional set combining the metabolites may be
235
translated into a workable composite score value for each individual (described
236
below).237
238
2.7 Statistical analyses239
Continuous variables were described by mean and standard derivation and
240
categorical variables by percentages. A Pearson χ2 test or Fisher's Exact Test were
241
used to compare categorical variables between groups. Intergroup comparisons of
242
means were performed using t-test. Statistical analyses were performed with SAS
243
9.4 (SAS Institute Inc., Cary, NC, USA).
244
245
For metabolomic data, features from both ionization modes for HILIC and RP
246
data were combined into a single dataset, while both ionization modes were
247
combined for the lipid data and analyzed separately. All data was ‘auto-scaled’
248
before statistical analysis. Univariate statistical analysis, random forest, hierarchical
249
clustering, heatmapping, confounding factor adjustment testing, power calculation,
250
ROC analysis and correlation plotting were performed using the online tool
251
MetaboAnalyst 4.0 6 , while partial correlations were calculated with the R package
252
GeneNet, and network visualization performed using Cytoscape. The multivariate
253
statistical analyses, partial least squares discriminant analysis (PLS-DA) and
254
hierarchical partial least squares–discriminant analysis (H-PLS-DA) were performed
255
with SIMCA 14 (Umetrics, Umea, Sweden). Models were validated by cross
256
validation analysis of variance (CV-ANOVA) (significance threshold ≤0.05) and by
257
permutation tests (200 permutations).
258
The significant threshold in the random forest or PLS-DA analysis was
259
calculated utilizing a normal probability plot, indicating which metabolites in the
260
random forest test deviated the most from normal distribution due to treatment. A
261
similar method was employed to select the PLS-DA variable importance in projection
262
(VIP) cutoff threshold for significant lipid species. H-PLS-DA modelling was
263
performed based on the contribution of separate orthogonal PLS-DAs calculated
264
from all functional sets of metabolites, allowing to generate for each functional set a
265
composite score value 16. Multiblock PLS or hierarchical PLS enables aggregation of
266
the data into biological function blocks to ease data interpretation and biological
267
understanding of the implications of the VTE on the system. The functional metabolic
268
blocks were “weighted” to take into account the number of metabolites per block 17.
269
For lipid blocking, lipid species were grouped according to clusters calculated by
270
hierarchical clustering analysis (Ward method). Lipid blocks score values were
271
9 generated by H-PLS-DA as above. Scores from the H-PLS-DA multiblock analysis
272
were analysed (t-test) to determine the most significant biological functions related to
273
the clinical outcome. The criterion for significance was set at P ≤ .01 after false
274
discovery rate.275
276
3. Results277
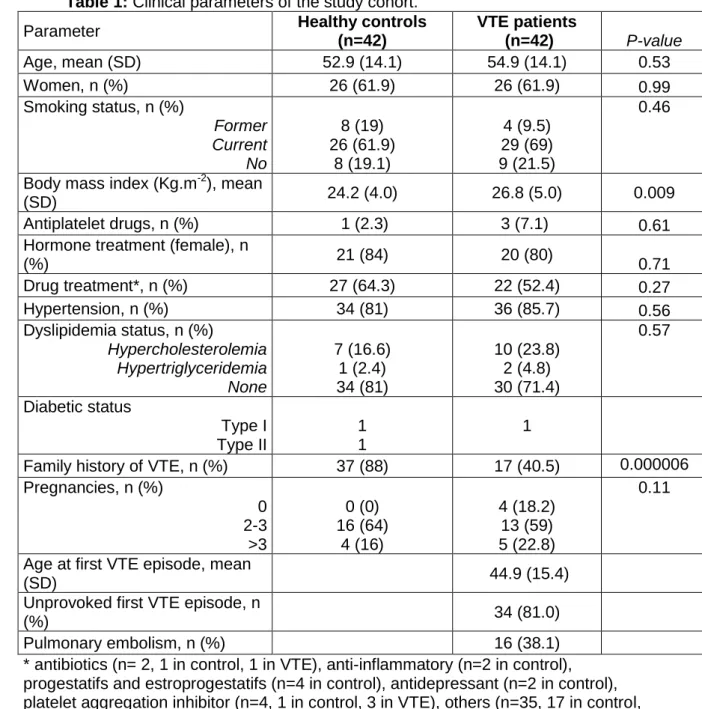
Clinical features of the studied population:
278
In total, 42 healthy controls and 42 patients with a personal history of incident
279
VTE were included in this study cohort. Table 1 shows the main characteristics of the
280
population study. Only mean BMI differed among healthy controls (24.2) and VTE
281
patients (26.8) (P = 0.009). At sampling, none of VTE cases or healthy controls were
282
on anticoagulants. Respectively 2.3% and 7.1% of healthy controls and VTE patients
283
were on antiplatelet drugs. In VTE patients, 81.0% of patients had experienced an
284
unprovoked VTE episode. The first VTE episode was a pulmonary embolism in
285
38.1% of cases.286
287
3.1 Feature detection288
After removing blank peaks, performing run-order and batch normalization and
289
CV filtering, a total of 137 metabolites were annotated from the in-house libraries.
290
These annotated metabolites consisted of amino acids, purines, carnitines, amines,
291
organic acids, sugars, lysophospholipids, and fatty acids. The lipid +ve and –ve
292
curated datasets contained 254 and 121 annotated lipids respectively after
293
overlapping identifications from both ionization modes were removed. A total of 512
294
annotated variables were thus obtained and retained for each patient and used for
295
further statistical analyses. A summary of the identified metabolites measured along
296
with assigned metabolic functional groupings for multiblock analysis, and the number
297
of annotated lipid species by lipid class is provided in the supplementary data (Tables
298
S1 and S2).299
300
3.2 Biomarker selection301
Firstly we compared the incident to the recurrent VTE patients, and showed
302
that no differences occurred among the 2 groups (Supplementary Figure I). The
303
recurrent patients were kept separate as a validation cohort (see below) whereas the
304
biomarkers search and subsequent multiblock analysis (section 3.3) were
305
investigated between only incident VTE and control individuals (n = 42 each). A list of
306
metabolites was selected based on the most commonly shared variables found in 10
307
consecutively constructed PLS-DA models in which 5 incident VTE and 5 controls
308
were randomly excluded. In each model the variables (metabolites) were selected
309
based on the shift of the partial PLS correlation coefficient from the normal
310
distribution.
311
Hierarchical clustering highlighted the effectiveness of the 21 metabolite model
312
at separating the two groups (healthy or VTE) (Figure 1A), with 10 of the metabolites
313
relatively higher in abundance in the VTE group. In contrast, 11 of the metabolites
314
were higher in the healthy controls (Figure 1B). The selected metabolites were
315
subsequently combined to generate a meaningful clinical composite score for each
316
individual. This predictive score was calculated from the PLS algorithm using the PLS
317
partial correlation coefficients applied to each metabolite, with the clinical status used
318
as the predicted variable (Figure 2A). From this equation a “thrombotic score” was
319
calculated for each individual and tested using a receiver operating characteristic
320
(ROC) curve. This method produced the following statistics: error probability P =
321
0.000348 after 1000 permutations, area under the curve 0.906, selectivity 0.832,
322
sensitivity 0.96, cut off score value at 0.446 for discriminating VTE vs healthy
323
individuals (Figure 2). 86% of the control and 83% of the VTE patients were correctly
324
assigned when using the strict cut off value, and 15% of the total patients were
325
indistinguishable. Using a 99% confidence interval, 19% were not defined on top of
326
10 the 9.5% indistinguishable (Figure 2D). We validated our algorithm by also predicting
327
the excluded samples of the 10 training sets described above, as well as by
328
predicting new samples not used in the training sets (comprising the recurrent VTE
329
individuals (see supplementary material biomarker validation steps)). Also,
330
confounding factors effects listed in Table 1 such as BMI, family history of VTE were
331
estimated (Supplemental Figures III-VI). They did not show any significant influence
332
on this predictive score. Finally, power analysis indicated that as low as 24
333
individuals per group was sufficient to discriminate the 2 populations using the
334
composite score (Supplemental Figure VII). The full validation procedure is detailed
335
in the supplementary material. Aside lipids, the selected metabolites are related to
336
the redox and inflammatory status, oxidative stress and metabolic activity
337
(Supplemental Table S1).338
339
3.3 Multiblock analysis340
The 137 detected and annotated metabolites were clustered into 50 functional
341
biological blocks as described in the method section (Supplemental Table S1). Lipids
342
were blocked according to their statistical proximity using hierarchical clustering
343
analysis (375 lipid species clustered into 12 different blocks, Supplemental Figure II
344
and Supplemental Table S3). Each functional block was then analyzed using a
PLS-345
based multiblock approach (hierarchical PLS). The effectiveness of the blocking
346
procedure was tested to ensure it did not distort the observations mapping in the PLS
347
space, by comparing the PLS-DA score plots of the weighed blocked to that of the
348
original unblocked data (Supplemental Figure VIII).
349
350
Twenty-five metabolic and lipid blocks were found significantly differentially
351
regulated between healthy and VTE patients at the qval ≤ 0.01 threshold (Figure 3A).
352
The difference between VTE and control individuals was better reflected in the
353
metabolome than in the plasma lipidome (48% vs 16.6% of the total metabolic
354
functions dysregulated respectively) . These disease-impacted functions were related
355
to cellular regulations, metabolic control and dysregulation, oxidative
356
stress/inflammation, primary metabolism and vascular function (Figure 3A). The
357
probability value was plotted to stratify the relative impact of the disease recurrence
358
on each function (Figure 3B). This highlighted carbohydrate metabolism was mainly
359
affected, followed by metabolic dysregulation and stress defence related functions,
360
but also the gut microbiota derived metabolism. Among the gut microbiota
361
metabolites of interest was trimethylamine N-oxide (TMAO) that remained twice as
362
high in VTE patients, whether incident (Figure 3C), or recurrent (not shown). It alone
363
was however found not to be highly predictive of VTE status (Figure 3D). Tryptophan
364
metabolism and vascular related metabolites were the least significantly affected.
365
366
The interplay between the biological functions were examined by calculating
367
pairwise partial correlations and displaying in an interaction network (Figure 4).
368
369
In order to focus on the specific interplays of the VTE population, we subtracted
370
the network node edges calculated for the control population to that of the diseased
371
one. The resulting graphical network thus displayed the specific disease biological
372
function relationships. In that context the lipid cluster 1 node appeared as an
373
important hub. It was related at the first and second neighbor’s degree to functions
374
related to the cell defense oxidative system, metabolic control or dysregulations,
375
stress functions, some primary metabolisms (branched chain amino acid and
376
saturated lipids), and to vascular health related metabolites (see metabolites
377
composition in Supplemental Table S1). Interestingly, gut microbiota metabolism also
378
related to tryptophan metabolism was also associated with this vascular outcome.
379
This lipid cluster 1 was characterized by 43 lipid species distributed into 11 lipid
380
classes (Figure 5A and B). The cluster was dominated by phosphatidylcholines and
381
11 triglycerides containing fatty acyl moieties composed of long-chain polyunsaturated
382
fatty acids of both the n-6 and n-3 series (Figure 5A and B). Among them was
383
C22:6n-3 (docosahexaenoic acid), esterifying over 42% of the lipid species. All the
384
lipids of that cluster were present in higher amounts in most of the historical VTE
385
patients (Figure 5B and C), with a statistical emphasis for triglycerides.
386
Across the biomarker and functional results, of the 21 metabolites selected to
387
predict the thrombosis status, 16 were included in the 248 metabolites composing the
388
biological functions found related to the disease phenotype. These 16 predictive
389
metabolites could be assigned into 14 biological functions, all matching with the 25
390
differentially regulated between control and VTE patients (not shown).
391
12
392
4. Discussion
393
This study had two main goals: to identify a set of biomarkers related to
394
historical VTE, and to identify possible background molecular mechanisms
395
associated with this adverse phenotype.
396
We identified a set of 21 plasma metabolites including 12 lipid species as
397
biomarkers of historical VTE. Individually, none were able to robustly discriminate the
398
cases from the healthy control individuals. However, combining them into an
399
equation generated a score for each individual sufficiently sensitive and selective
400
(0.96 and 0.832 respectively) to be used as a multiplex biomarker (Figure 2). Such a
401
strategy has been found valuable in other studies 16, 18, 19 to define a biomarker that is
402
less affected by interindividual variation or environmental influences 19. The multiplex
403
biomarker score value at the 99% confidence interval indicated that less than 30%
404
(9.5% false status and ~17% with an undefined status) of the VTE patients had a
405
similar score to controls, suggesting a return to a healthy status. Our results also
406
highlighted that post 3 months from a VTE, over 70% of the VTE populations
407
remained different from the healthy controls. Whether or not such population
408
continued to remain at risk is unknown and would require a follow up study.
409
The new combination of biomarkers that we selected to predict the incident
410
VTE also correctly predicted the majority of the relapsed patients used as an external
411
validation cohort (74% correct assignment). Thus a permanent metabolic background
412
seemed to represent the VTE phenotype irrespective of the number of events,
413
however we cannot explain whether it relates to a post VTE induced metabolome or
414
is a pre-existing VTE outcome. Only pre and post VTE sampling on the same
415
patients to perform the metabolome analysis would be able to confirm this and
416
remains to be done. Nevertheless, our strategy provides a proof of principle
417
approach to stratify the population for subsequent clinical monitoring after a VTE.
418
The metabolite candidates were related to many biological processes, such as
419
oxidative/inflammation status, metabolic dysregulation, some of which have been
420
already established in the VTE phenotype (20, 21, 22), including carnitine derivatives8, 9.
421
However, the reduced set of metabolites remains insufficient to provide a
422
mechanistic explanation concerning complex disease phenotypes.
423
Thus, to describe with improved accuracy the status of patients, we examined
424
the differences in the biological status at the metabolic function level. For this,
425
metabolites were clustered according to functional ontologies or statistical clusters
426
(lipids) as previously described (23, 24, 14, 16, 15). This analysis provides a more
427
meaningful higher-level explanation of the complex biological regulations.
428
Most of the biomarkers used in the multiplex biomarker panel (16 out 21
429
metabolites) were also included in the list of 248 metabolites forming the statistically
430
relevant biological function matrix, suggesting that the majority of these 21
431
metabolites could also be considered as functional biomarkers. The 25 metabolic and
432
lipid clusters statistically modified in VTE patients covered an array of functions,
433
highlighting the complex nature of the VTE phenotype. Such metabotype can be
434
summarized to functions relating to cell defence system, cell signalling, metabolic
435
control and deregulation, to primary metabolism including microbiota metabolism,
436
and some vascular function related metabolites (Figure 3). Some of these perturbed
437
metabolic areas have been individually observed previously in VTE patients, however
438
the previous studies focused on a smaller number of metabolites (20, 21, 22, 25).
439
Comparisons remain difficult with studies examining mechanistic aspects during or
440
around the VTE, as they can be associated together with other diseases. At the time
441
of sampling, our VTE patients were supposed to be clinically recovered, but we still
442
found numerous resilient metabolic changes at the function level (Figure 3), but not
443
necessarily at the single metabolite level. The multivariate statistics used to form the
444
functional blocks includes the extent of the relationships among the variables, in
445
contrast to univariate methods that focus solely on the mean and the variance of a
446
13 single variable (26). As a result, our multiblock approach is more sensitive by
447
aggregating individual minor variations that can make them collectively significant.
448
The metabolic function blocking allows sorting of the initial VTE effect
449
according to the statistical P-value (Figure 3) but does not provide a representation of
450
the orchestrating specific regulations (network of interactions) occurring in the VTE
451
patients. The partial correlation networking performed here, better reports true
452
metabolic outcomes 27 and emphasises the critical functions with potential regulatory
453
roles. Lipids cluster 1 thus appeared central in coordinating the specific VTE
454
metabolic response (Figure 4), whereas its relative statistical relevance only looked
455
medium to low (Figure 3B). This lipid cluster was especially rich in triglycerides and
456
phosphatidylcholines, with lipid species mainly comprising esterified long-chain
457
polyunsaturated fatty acid of n-6 and n-3 series. These fatty acids can reflect both
458
dietary intake and metabolic influences 28, 29, 30, 31, 32. The cluster comprised
459
docosahexaenoic and eicosapentaenoic acid containing lipids in higher proportions
460
to the other clusters. High intake of these two n-3 long-chain polyunsaturated fatty
461
acids are recognized to be generally anti-thrombotic 33, and can lower VTE in both
462
animal models 34, or humans 35. A high blood eicosapentaenoic/arachidonic acid ratio
463
in humans has also been found to be associated with a lower occurrence of acute
464
VTE 36. However, a meta-analysis from 79 RCTs (including 112059 participants) to
465
assess the role of n-3 fatty acids for the primary and secondary prevention of CVD
466
found a harmful (RR 1.25), though non-significant effect, of both docosahexaenoic
467
and eicosapentaenoic acid on VTE (analyzed on a subset of 4 RCT and 3011
468
participants) 25. This trend seemed to be similar to our finding where such n-3 long
469
chain fatty acid lipids were associated with our VTE patients. It is nevertheless
470
difficult to conclude with confidence with regards to the role of n-3 lipids in the
471
occurrence of VTE. Instead, our results suggest that these lipids seemed to interact
472
or control various functions with still un-reset activities in patients with a previous
473
VTE. At 2 neighbours degree distance, lipid cluster 1 was related mainly to oxidative
474
and inflammatory defence systems, and to metabolic disorder associated
475
dysregulations, representing clinical indicators to monitor.
476
Interestingly, our network analysis also revealed in VTE patients a relationship
477
between tryptophan metabolism and gut microbiota metabolism. This can be
478
explained by the common metabolites found in both functions, but the finding also
479
highlights the possible implication of gut microbiota in this vascular disease through
480
the modulation of tryptophan metabolism. This latter metabolism is vital in the
481
modulation of VTE (37, 38) through the activation of the nuclear receptor AhR pathway
482
(39). Moreover, the gut microbiota function also includes TMAO. TMAO originates
483
from gut microbiota and was found to be prothrombotic (40). However, it was not
484
linearly associated with recurrent VTE (41). In our study, TMAO levels were twice as
485
high in the plasma of incident (and recurrent) VTE patients compared to healthy
486
controls (Figure 3C), but its variability prevented its inclusion in the predictive
487
biomarkers panel (Figure 3D and Figure 2). Our finding thus suggests that our VTE
488
patients would have a gut microbiota composition more related to elevated TMAO
489
production. Alternatively, since TMAO can also be influenced by the host liver
Flavin-490
containing monoxygenase 3 activity (42), it may be indicative of a polymorphism in
491
this gene in the VTE patients. However, the latter appears unlikely since no such
492
Flavin monooxygenase 3 gene polymorphism has to date been found associated with
493
VTE.
494
495
It should be noted that healthy controls were not from the general population.
496
They were referred to our centre for a thrombophilia screening because they had a
497
family history of VTE. About half of them had a positive thrombophilia screening
498
(among antithrombin, protein C, protein S deficiencies, factor V Leiden, G20210A
499
prothrombin mutation). As a consequence they might harbour a higher VTE risk than
500
the general population.
501
14 Despite this limitation, we found a short list of 21 biomarkers that, when
502
combined into a predictive equation, may allow stratification of VTE populations
503
according to disease risk including possible relapse. We then identified a subset of
504
the lipidome composed mainly of long-chain polyunsaturated n-3 triglycerides as a
505
possible player of the post-acute VTE biological response, possibly controlling
506
oxidative and inflammatory defence systems, and metabolic disorder associated
507
dysregulations. Further studies are required to clarify the exact role of these lipids in
508
post VTE response. Our metabolomic analysis also highlighted the possible
509
involvement of the gut microbiome in the VTE outcome, including TMAO producing
510
bacteria and potential biomarkers and mechanisms of diseases such as VTE. Since
511
the metabolome did not differ between the incident and recurrent VTE, this could be
512
an indication of a permanent metabolome shift, either pre-existing or consecutive to
513
the VTE, that could provide a new therapeutic avenue to focus on.
514
515
516
Acknowledgements:
517
a) Acknowledgements: The authors’ contributions are as follows: KF carried out the
518
experimental analyses including all sample preparation, the majority of the LCMS
519
analyses, data extraction, metabolite annotation, and drafted the manuscript. AV
520
performed a section of the LCMS analyses. KF, PM and JC carried out data
521
interpretation and manuscript preparation. NR provided critical review of the
522
manuscript. PM, JC, KF and NR were responsible for securing the funding for the
523
project, the conception of the project and the oversight of the experiment.
524
b) Sources of funding: This study was partly funded by AgResearch Strategic
525
Science Investment Fund (Contract number A21246), the New Zealand High-Value
526
Nutrition National Science Challenge priority programmes Healthy Digestion and
527
Metabolic Health, and an INRAe and Aix-Marseille Université fellowship. FLV was
528
partially supported by an ANR grant (ANR-17-ECVD-0005). DAT was supported by
529
the EPIDEMIOM-VT Senior Chair from the University of Bordeaux initiative of
530
excellence IdEX.
531
c) Disclosures: The authors declare that they have no conflict of interest.
532
533
534
5. References
535
1. Rosendaal FR. Venous thrombosis: A multicausal disease. Lancet.
536
1999;353:1167-1173
537
2. Tritschler T, Kraaijpoel N, Le Gal G, Wells PS. Venous thromboembolism:
538
Advances in diagnosis and treatment. JAMA. 2018;320:1583-1594
539
3. Palareti G, Cosmi B, Legnani C, Tosetto A, Brusi C, Iorio A, Pengo V,
540
Ghirarduzzi A, Pattacini C, Testa S, Lensing AWA, Tripodi A. D-dimer testing
541
to determine the duration of anticoagulation therapy. New England Journal of
542
Medicine. 2006;355:1780-1789
543
4. Kumar KG, Poole AC, York B, Volaufova J, Zuberi A, Richards BKS.
544
Quantitative trait loci for carbohydrate and total energy intake on mouse
545
chromosome 17: Congenic strain confirmation and candidate gene analyses
546
(glo1, glp1r)10.1152/ajpregu.00491.2006. Am J Physiol Regul Integr Comp
547
Physiol. 2007;292:R207-216
548
5. Cesbron N, Royer AL, Guitton Y, Sydor A, Le Bizec B, Dervilly-Pinel G.
549
Optimization of fecal sample preparation for untargeted lc-hrms based
550
metabolomics. Metabolomics. 2017;13:99
551
6. Chong J, Soufan O, Li C, Caraus I, Li S, Bourque G, Wishart DS, Xia J.
552
Metaboanalyst 4.0: Towards more transparent and integrative metabolomics
553
analysis. Nucleic Acids Res. 2018;46:W486-w494
554
15 7. Bahado-Singh RO, Graham SF, Han B, Turkoglu O, Ziadeh J, Mandal R, Er
555
A, Wishart DS, Stahel PL. Serum metabolomic markers for traumatic brain
556
injury: A mouse model. Metabolomics. 2016;12:1-12
557
8. Deguchi H, Banerjee Y, Trauger S, Siuzdak G, Kalisiak E, Fernandez JA,
558
Hoang L, Tran M, Yegneswaran S, Elias DJ, Griffin JH. Acylcarnitines are
559
anticoagulants that inhibit factor xa and are reduced in venous thrombosis,
560
based on metabolomics data. Blood. 2015;126:1595-1600
561
9. Jiang X, Zeleznik OA, Lindstrom S, Lasky-Su J, Hagan K, Clish CB, Eliassen
562
AH, Kraft P, Kabrhel C. Metabolites associated with the risk of incident
563
venous thromboembolism: A metabolomic analysis. J Am Heart Assoc.
564
2018;7:e010317
565
10. Germain M, Chasman DI, de Haan H, Tang W, Lindstrom S, Weng LC, de
566
Andrade M, de Visser MC, Wiggins KL, Suchon P, Saut N, Smadja DM, Le
567
Gal G, van Hylckama Vlieg A, Di Narzo A, Hao K, Nelson CP, Rocanin-Arjo
568
A, Folkersen L, Monajemi R, Rose LM, Brody JA, Slagboom E, Aissi D,
569
Gagnon F, Deleuze JF, Deloukas P, Tzourio C, Dartigues JF, Berr C, Taylor
570
KD, Civelek M, Eriksson P, Psaty BM, Houwing-Duitermaat J, Goodall AH,
571
Cambien F, Kraft P, Amouyel P, Samani NJ, Basu S, Ridker PM, Rosendaal
572
FR, Kabrhel C, Folsom AR, Heit J, Reitsma PH, Tregouet DA, Smith NL,
573
Morange PE. Meta-analysis of 65,734 individuals identifies tspan15 and
574
slc44a2 as two susceptibility loci for venous thromboembolism. Am J Hum
575
Genet. 2015;96:532-542
576
11. Afshordel S, Hagl S, Werner D, Rohner N, Kogel D, Bazan NG, Eckert GP.
577
Omega-3 polyunsaturated fatty acids improve mitochondrial dysfunction in
578
brain aging--impact of bcl-2 and npd-1 like metabolites. Prostaglandins
579
Leukot Essent Fatty Acids. 2015;92:23-31
580
12. Pereira H, Martin J-F, Joly C, Sébédio J-L, Pujos-Guillot E. Development and
581
validation of a uplc/ms method for a nutritional metabolomic study of human
582
plasma. Metabolomics. 2010;6:207-218
583
13. van der Kloet FM, Bobeldijk I, Verheij ER, Jellema RH. Analytical error
584
reduction using single point calibration for accurate and precise metabolomic
585
phenotyping. J Proteome Res. 2009;8:5132-5141
586
14. Bennouna D, Avice J-C, Rosique C, Svilar L, Pontet C, Trouverie J, Fine F,
587
Pinochet X, Fraser K, Martin JC. The impact of genetics and environment on
588
the polar fraction metabolome of commercial brassica napus seeds: A
multi-589
site study. Seed Sciences Research. 2019
590
15. Thabuis C, Destaillats F, Lambert D, Muccioli GG, Maillot M, Harach T,
591
Tissot-Favre D, Martin JC. Lipid transport function is the main target of oral
592
oleylethanolamide to reduce adiposity in high-fat fed mice. J Lipid Res.
593
2011:1373-1382
594
16. Martin JC, Berton A, Ginies C, Bott R, Scheercousse P, Saddi A, Gripois D,
595
Landrier JF, Dalemans D, Alessi MC, Delplanque B. Multi-level systems
596
biology modeling characterized the atheroprotective efficiencies of modified
597
dairy fats in a hamster model. Am J Physiol Heart Circ Physiol.
598
2015;309:H935-H945
599
17. Wold S, Kettaneh N, Tjessem K. Hierarchical multiblock pls and pc models for
600
easier model interpretation and as an alternative to variable selection Journal
601
of Chemometrics. 1996;10:463-482
602
18. Aidoud N. Modulation de l'apport qualitatif post-natal en lipides sur le
603
fonctionnement cérébral du nouveau-né. Ecole doctorale des sciences de la
604
vie et la santé. 2018;PhD
605
19. Dickson L, Tenon M, Svilar L, Fança-Berthon P, Lugan R, Martin JC, Vaillant
606
F, Rogez H. Main human urinary metabolite after genipap 2 (genipa
607
americana l.) juice intake. Nutrients. 2018;10:1155
608
16 20. Maekawa K, Sugita C, Yamashita A, Moriguchi-Goto S, Furukoji E, Sakae T,
609
Gi T, Hirai T, Asada Y. Higher lactate and purine metabolite levels in
610
erythrocyte-rich fresh venous thrombus: Potential markers for early deep vein
611
thrombosis. Thromb Res. 2019;177:136-144
612
21. Song SB, Park JS, Chung GJ, Lee IH, Hwang ES. Diverse therapeutic
613
efficacies and more diverse mechanisms of nicotinamide. Metabolomics.
614
2019;15:137
615
22. Phang M, Lazarus S, Wood LG, Garg M. Diet and thrombosis risk: Nutrients
616
for prevention of thrombotic disease. Semin Thromb Hemost.
2011;37:199-617
208
618
23. Wahl S, Krug S, Then C, Kirchhofer A, Kastenmüller G, Brand T, Skurk T,
619
Claussnitzer M, Huth C, Heier M, Meisinger C, Peters A, Thorand B, Gieger
620
C, Prehn C, Römisch-Margl W, Adamski J, Suhre K, Illig T, Grallert H,
621
Laumen H, Seissler J, Hauner H. Comparative analysis of plasma
622
metabolomics response to metabolic challenge tests in healthy subjects and
623
influence of the fto obesity risk allele. Metabolomics. 2014;10:386-401
624
24. Wahl S, Vogt S, Stuckler F, Krumsiek J, Bartel J, Kacprowski T, Schramm K,
625
Carstensen M, Rathmann W, Roden M, Jourdan C, Kangas AJ, Soininen P,
626
Ala-Korpela M, Nothlings U, Boeing H, Theis FJ, Meisinger C, Waldenberger
627
M, Suhre K, Homuth G, Gieger C, Kastenmuller G, Illig T, Linseisen J, Peters
628
A, Prokisch H, Herder C, Thorand B, Grallert H. Multi-omic signature of body
629
weight change: Results from a population-based cohort study. BMC Med.
630
2015;13:48
631
25. Abdelhamid AS, Brown TJ, Brainard JS, Biswas P, Thorpe GC, Moore HJ,
632
Deane KH, AlAbdulghafoor FK, Summerbell CD, Worthington HV, Song F,
633
Hooper L. Omega-3 fatty acids for the primary and secondary prevention of
634
cardiovascular disease. Cochrane Database Syst Rev. 2018;7:CD003177
635
26. Saccenti E, Hoefsloot HCJ, Smilde AK, Westerhuis JA, Hendriks MMWB.
636
Reflections on univariate and multivariate analysis of metabolomics data.
637
metabolomics. 2014;10:361-374
638
27. Krumsiek J, Suhre K, Illig T, Adamski J, Theis FJ. Gaussian graphical
639
modeling reconstructs pathway reactions from high-throughput metabolomics
640
data. BMC Syst Biol. 2011;5:21
641
28. Patterson AC, Chalil A, Aristizabal Henao JJ, Streit IT, Stark KD. Omega-3
642
polyunsaturated fatty acid blood biomarkers increase linearly in men and
643
women after tightly controlled intakes of 0.25, 0.5, and 1 g/d of epa + dha.
644
Nutr Res. 2015;35:1040-1051
645
29. Garcia-Aloy M, Hulshof PJM, Estruel-Amades S, Oste MCJ, Lankinen M,
646
Geleijnse JM, de Goede J, Ulaszewska M, Mattivi F, Bakker SJL, Schwab U,
647
Andres-Lacueva C. Biomarkers of food intake for nuts and vegetable oils: An
648
extensive literature search. Genes Nutr. 2019;14:7
649
30. Kawashima H. Intake of arachidonic acid-containing lipids in adult humans:
650
Dietary surveys and clinical trials. Lipids Health Dis. 2019;18:101
651
31. Matthan NR, Ooi EM, Horn LV, Neuhouser ML, Woodman R, Lichtenstein
652
AH. Plasma phospholipid fatty acid biomarkers of dietary fat quality and
653
endogenous metabolism predict coronary heart disease risk: A nested
654
case‐control study within the women's health initiative observational
655
study. Journal of the American Heart Association. 2014;3:e000764
656
32. Murff HJ, Edwards TL. Endogenous production of long-chain polyunsaturated
657
fatty acids and metabolic disease risk. Curr Cardiovasc Risk Rep. 2014;8
658
33. Sanchez C, Poggi M, Morange P-E, Defoort C, Martin J-C, Tanguy S, Dutour
659
A, Grino M, Alessi M-C. Diet modulates endogenous thrombin generation, a
660
biological estimate of thrombosis risk, independently of the metabolic status.
661
Arteriosclerosis, Thrombosis, and Vascular Biology. 2012;32:2394-2404
17 34. Andriamampandry MD, Leray C, Freund M, Cazenave J-P, Gachet C.
663
Antithrombotic effects of (n-3) polyunsaturated fatty acids in rat models of
664
arterial and venous thrombosis. Thromb. Res. 1999;93:9-16
665
35. Hansen-Krone IJ, Enga KF, Sudduth-Klinger JM, Mathiesen EB, Njolstad I,
666
Wilsgaard T, Watkins S, Braekkan SK, Hansen JB. High fish plus fish oil
667
intake is associated with slightly reduced risk of venous thromboembolism:
668
The tromso study. J Nutr. 2014;144:861-867
669
36. Hiki M, Miyazaki T, Shimada K, Sugita Y, Shimizu M, Aikawa T, Ouchi S,
670
Shiozawa T, Takasu K, Takahashi S, Takagi A, Miyauchi K, Daida H.
671
Significance of serum polyunsaturated fatty acid level imbalance in patients
672
with acute venous thromboembolism. J Atheroscler Thromb.
2017;24:1016-673
1022
674
37. Addi T, Dou L, Burtey S. Tryptophan-derived uremic toxins and thrombosis in
675
chronic kidney disease. Toxins (Basel). 2018;10
676
38. Voils SA, Shahin MH, Garrett TJ, Frye RF. Metabolomic association between
677
venous thromboembolism in critically ill trauma patients and kynurenine
678
pathway of tryptophan metabolism. Thromb Res. 2018;165:6-13
679
39. Kolachalama VB, Shashar M, Alousi F, Shivanna S, Rijal K, Belghasem ME,
680
Walker J, Matsuura S, Chang GH, Gibson CM, Dember LM, Francis JM,
681
Ravid K, Chitalia VC. Uremic solute-aryl hydrocarbon receptor-tissue factor
682
axis associates with thrombosis after vascular injury in humans. J Am Soc
683
Nephrol. 2018;29:1063-1072
684
40. Zhu W, Wang Z, Tang WHW, Hazen SL. Gut microbe-generated
685
trimethylamine n-oxide from dietary choline is prothrombotic in subjects.
686
Circulation. 2017;135:1671-1673
687
41. Reiner MF, Muller D, Gobbato S, Stalder O, Limacher A, Bonetti NR, Pasterk
688
L, Mean M, Rodondi N, Aujesky D, Angelillo-Scherrer A, Matter CM, Luscher
689
TF, Camici GG, von Eckardstein A, Beer JH. Gut microbiota-dependent
690
trimethylamine-n-oxide (tmao) shows a u-shaped association with mortality
691
but not with recurrent venous thromboembolism. Thromb Res.
2019;174:40-692
47
693
42. Chhibber-Goel J, Gaur A, Singhal V, Parakh N, Bhargava B, Sharma A. The
694
complex metabolism of trimethylamine in humans: Endogenous and
695
exogenous sources. Expert Rev Mol Med. 2016;18:e8
696
697
Highlights
698
699
VTE risk detection and relapse need to be improved
700
Metabolic systems analyses by LC-MS were applied to VTE patients
701
A thrombotic score formed from polar and apolar metabolites discriminated
702
VTE patients
703
A background VTE metabotype was found, including a specific lipid cluster
704
and microbiota metabolites.
705
706
707
18
708
Table 1: Clinical parameters of the study cohort.
709
Parameter Healthy controls
(n=42) VTE patients (n=42) P-value Age, mean (SD) 52.9 (14.1) 54.9 (14.1) 0.53 Women, n (%) 26 (61.9) 26 (61.9) 0.99 Smoking status, n (%) Former Current No 8 (19) 26 (61.9) 8 (19.1) 4 (9.5) 29 (69) 9 (21.5) 0.46
Body mass index (Kg.m-2), mean
(SD) 24.2 (4.0) 26.8 (5.0) 0.009
Antiplatelet drugs, n (%) 1 (2.3) 3 (7.1) 0.61
Hormone treatment (female), n
(%) 21 (84) 20 (80) 0.71 Drug treatment*, n (%) 27 (64.3) 22 (52.4) 0.27 Hypertension, n (%) 34 (81) 36 (85.7) 0.56 Dyslipidemia status, n (%) Hypercholesterolemia Hypertriglyceridemia None 7 (16.6) 1 (2.4) 34 (81) 10 (23.8) 2 (4.8) 30 (71.4) 0.57 Diabetic status Type I Type II 1 1 1
Family history of VTE, n (%) 37 (88) 17 (40.5) 0.000006 Pregnancies, n (%) 0 2-3 >3 0 (0) 16 (64) 4 (16) 4 (18.2) 13 (59) 5 (22.8) 0.11
Age at first VTE episode, mean
(SD) 44.9 (15.4)
Unprovoked first VTE episode, n
(%) 34 (81.0)
Pulmonary embolism, n (%) 16 (38.1)
* antibiotics (n= 2, 1 in control, 1 in VTE), anti-inflammatory (n=2 in control),
710
progestatifs and estroprogestatifs (n=4 in control), antidepressant (n=2 in control),
711
platelet aggregation inhibitor (n=4, 1 in control, 3 in VTE), others (n=35, 17 in control,
712
18 in VTE)
713
19
Figure 1: A, one dimensional PLS-DA score plot obtained with PLS
715
coefficient ‘CS’ values of 0.016 and ‘VIP’ values of 1.63 (n = 42 individuals per
716
class). Model details: group variance explained R2Y = 0.447, and predicted
717
Q2Y = 0.399. Model robustness validation: R2Y after 200 random individual
718
permutations = 0.0899, Q2Y =-0.116, significance of class discrimination after
719
cross-validation ANOVA was P =1.1147 x 10
-9. B, list of the selected best 21
720
metabolite biomarkers obtained from the PLS-DA model with their relative
721
increase (dark grey) or decrease (light grey) in the plasma of thrombotic vs
722
healthy patients. Lipids are specified by class (PA, phosphatidic acid, LPMe,
723
lysophosphatidylmethanol,
PS,
Phosphatidylserine,
PE,
724
Phosphatidylethalnolamine, TG, Triglycerides, PC, Phosphatidylcholine, and
725
ZyE, Zymosterol ester). The attached fatty acyl chains along with unsaturation
726
number are indicated, or when not fully determined the total number of
727
carbons and unsaturations in the combined fatty acyl moieties.
728
729
730
731
732
20