HAL Id: hal-01718043
https://hal.sorbonne-universite.fr/hal-01718043
Submitted on 27 Feb 2018
HAL is a multi-disciplinary open access
archive for the deposit and dissemination of
sci-entific research documents, whether they are
pub-lished or not. The documents may come from
teaching and research institutions in France or
abroad, or from public or private research centers.
L’archive ouverte pluridisciplinaire HAL, est
destinée au dépôt et à la diffusion de documents
scientifiques de niveau recherche, publiés ou non,
émanant des établissements d’enseignement et de
recherche français ou étrangers, des laboratoires
publics ou privés.
Distributed under a Creative Commons Attribution| 4.0 International License
Metabolic Genes
Peter Mccolgan, Sarah Gregory, Kiran Seunarine, Adeel Razi, Marina
Papoutsi, Eileanoir Johnson, Alexandra Durr, Raymund Roos, Blair Leavitt,
Peter Holmans, et al.
To cite this version:
Peter Mccolgan, Sarah Gregory, Kiran Seunarine, Adeel Razi, Marina Papoutsi, et al.. Brain
Re-gions Showing White Matter Loss in Huntington’s Disease Are Enriched for Synaptic and Metabolic
Genes. Biological Psychiatry, Elsevier, 2018, 83 (5), pp.456-465. �10.1016/j.biopsych.2017.10.019�.
�hal-01718043�
Archival Report
Brain Regions Showing White Matter Loss
in Huntington
’s Disease Are Enriched for
Synaptic and Metabolic Genes
Peter McColgan, Sarah Gregory, Kiran K. Seunarine, Adeel Razi, Marina Papoutsi,
Eileanoir Johnson, Alexandra Durr, Raymund A.C. Roos, Blair R. Leavitt, Peter Holmans,
Rachael I. Scahill, Chris A. Clark, Geraint Rees, Sarah J. Tabrizi, and the Track-On
HD Investigators
ABSTRACT
BACKGROUND: The earliest white matter changes in Huntington’s disease are seen before disease onset in the premanifest stage around the striatum, within the corpus callosum, and in posterior white matter tracts. While experimental evidence suggests that these changes may be related to abnormal gene transcription, we lack an understanding of the biological processes driving this regional vulnerability.
METHODS: Here, we investigate the relationship between regional transcription in the healthy brain, using the Allen Institute for Brain Science transcriptome atlas, and regional white matter connectivity loss at three time points over 24 months in subjects with premanifest Huntington’s disease relative to control participants. The baseline cohort included 72 premanifest Huntington’s disease participants and 85 healthy control participants.
RESULTS: We show that loss of corticostriatal, interhemispheric, and intrahemispheric white matter connections at baseline and over 24 months in premanifest Huntington’s disease is associated with gene expression profiles enriched for synaptic genes and metabolic genes. Corticostriatal gene expression profiles are predominately asso-ciated with motor, parietal, and occipital regions, while interhemispheric expression profiles are assoasso-ciated with frontotemporal regions. We also show that genes with known abnormal transcription in human Huntington’s disease and animal models are overrepresented in synaptic gene expression profiles, but not in metabolic gene expression profiles.
CONCLUSIONS: Thesefindings suggest a dual mechanism of white matter vulnerability in Huntington’s disease, in which abnormal transcription of synaptic genes and metabolic disturbance not related to transcription may drive white matter loss.
Keywords: Connectome, Genetics, Huntington’s disease, Imaging, Transcription, White matter
https://doi.org/10.1016/j.biopsych.2017.10.019
Huntington’s disease (HD) is a progressive fatal neurodegen-erative disease caused by a CAG repeat expansion in the HTT gene on chromosome 4. Individuals with more than 39 CAG repeats are certain to develop HD, allowing investigation of the premanifest stage (preHD) many years before symptom onset
(1). While the caudate and putamen show the earliest gray matter changes (2), white matter (WM) changes are seen around the striatum, within the corpus callosum, and in the posterior WM tracts(2–5). We have demonstrated a hierarchy of WM vulnerability where corticostriatal connections show greatest changes in preHD and control participants, followed by interhemispheric and intrahemispheric connections(6).
Voxel-based morphometry suggests(2,7)that gray matter and WM abnormalities in the striatum occur in parallel in those furthest from disease onset, but more recent work(5)suggests that gray matter atrophy precedes WM atrophy in the striatum.
However, as this was a cross-sectional study it is not yet possible to define a typical time lag. Thus, patterns of WM loss in preHD are well established, but the underlying pathological processes are unclear.
Mutant huntingtin protein causes cellular dysfunction and ultimately neuronal cell death through several processes(8,9), including downstream effects on synaptic signaling (10), cellular metabolism (11), mitochondrial dysfunction (12), im-mune activation (13), and alterations in transcription (14). Furthermore, transcription levels of genes involved in these processes are atypical in human HD and animal models
(14,15). Decreased expression of synaptic proteins in cortical pyramidal neurons of HD mouse models are linked to abnormal corticostriatal connectivity(16), while changes in transcription levels of brain-derived neurotrophic factor, another protein involved in synaptic transmission, are associated with changes
456 ª 2017 Society of Biological Psychiatry. This is an open access article under the CC BY license (http://creativecommons.org/licenses/by/4.0/).
Biological Psychiatry March 1, 2018; 83:456–465www.sobp.org/journal ISSN: 0006-3223
Biological Psychiatry
in corticocortical connectivity (17). Excitotoxic striatal lesion models of HD are consistent with these findings. Reduced brain-derived neurotrophic factor is seen in the rat striatum after quinolinic acid injection(18), and reduced brain-derived neurotrophic factor and nerve growth factor are seen after 3-nitropropionic acid treatment(19).
Some genes show a direct association with WM integrity. Loss of peroxisome proliferator–activated receptor gamma coactivator 1-alpha, involved in the transcriptional regulation of energy metabolism, results in striatal degeneration and corpus callosum WM abnormalities in HD mouse models (20). Reduced transcription levels of myelin-related genes are associated with WM abnormalities in HD mouse models(21).
Given the relationship between WM connectivity and gene transcription in HD, here we investigated how regional gene transcription profiles of the healthy human brain, obtained from the Allen Institute for Brain Science (AIBS) human tran-scriptome atlas (22), were associated with WM connectivity loss in preHD. Based on association between synaptic and metabolic genes and WM loss in HD(20,21)we hypothesized that WM connectivity loss in preHD would be associated with regional transcription profiles enriched for synaptic and metabolic genes.
METHODS AND MATERIALS Overview
To test our hypothesis, WM connectivity loss was determined using diffusion-weighted imaging from a longitudinal cohort of preHD and control participants. Brains were parcellated into 70 cortical and 2 subcortical (caudate and putamen) regions of interest (ROIs) based on the Desikan FreeSurfer atlas(23). The caudate and putamen were chosen as these regions show the greatest changes in preHD(2). Whole-brain tractography was performed using these parcellations to construct WM brain networks. We have recently published a longitudinal analysis using this cohort(6).
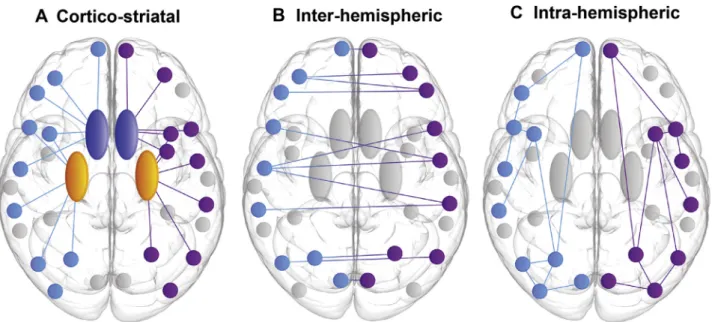
For each set of connections associated with a cortical ROI, WM connectivity loss was defined as corticostriatal (connec-tions between cortex and caudate/putamen), interhemispheric (corticocortical connections between hemispheres), or intra-hemispheric (corticocortical connections within the same hemisphere) (see Figure 1). WM connectivity and rate of change in WM connectivity over 24 months were normalized for preHD relative to control participants for each participant. Connectivity measures were then transformed to give atrophy and rate of atrophy measures. The resulting atrophy score was used in the cross-sectional analysis, while the rate of atrophy score was used in the longitudinal analysis.
To compare regional WM loss in preHD with regional gene expression in the healthy brain, the 70 cortical ROIs(23)were matched to the closest AIBS ROI, and gene expression data were averaged across RNA probes corresponding to the same gene. ROIs with gene expression values .2 SD above the mean or range were excluded this resulted in the inclusion of 20,737 genes across 68 cortical ROIs.
Partial least squares (PLS) regression was used to investigate the relationship between regional gene expres-sion and regional WM loss. PLS is a multivariate technique used when the number of predictor variables (i.e., regional
gene expression) is much larger than the number of obser-vations (i.e., regional WM loss). It has been used previously to investigate the relationship between gene expression and magnetic resonance imaging (MRI)–derived regional brain measures in healthy volunteers(24,25). For our analysis the predictor variable comprised a gene3 ROI matrix of 20,737 3 68, and the response variable comprised a WM loss3 ROI matrix: 68 3 4 for the corticostriatal analysis (68 cortical ROIs3 left and right caudate and putamen WM loss to each ROI region) and 68 3 1 for the inter- and intrahemispheric analyses (68 cortical ROIs3 inter- and intrahemispheric WM loss for each ROI). PLS identified components or patterns of regional gene expression having maximum covariance with regional WM loss, such that thefirst few PLS components provide the greatest representation of the covariance. For each component, individual genes are assigned weights based on their contribution to the variance explained(24).
This analysis provided a weight for each gene indicating its contribution to WM connectivity loss for each component or pattern. Using this information, genes were ranked according to their PLS weight. Gene enrichment analysis was then per-formed to identify the biological functions of genes with the highest weights using gene ontology (GO) terms(26). Here, the significance of a GO term was determined based on the rank of genes associated with that term.
Imaging Cohort
The cohort included preHD and control participants from the Track-On HD study(27), followed up at 3 time points over 24 months at four sites (London, United Kingdom; Leiden, the Netherlands; Paris, France; and Vancouver, British Columbia, Canada). Baseline participants included 72 preHD and 85 control participants. For the longitudinal analysis only preHD participants with diffusion data from all 3 time points were included (56 preHD and 65 control participants; see
Supplemental Methods). MRI Acquisition
T1 and diffusion-weighted images were acquired on two different 3T MRI scanners (Philips Achieva [Philips Healthcare, Eindhoven, The Netherlands] at Leiden and Vancouver, and Siemens TIM Trio [Siemens Corp., Erlangen, Germany] at London and Paris). Diffusion-weighted images were acquired with 42 unique gradient directions (b = 1000 s/mm2; see
Supplemental Methods). Diffusion Tractography
Whole-brain probabilistic tractography was performed using MRtrix Version 3.0(28). The spherical-deconvolution informed filtering of tractograms 2 algorithm(29) was used to reduce biases. To demonstrate that our results were robust to varying methodologies, additional cross-sectional analyses used alternative connectome construction methodologies (see
Supplemental Methods).
Mapping Gene Expression Data to MRI Space Gene expression microarray data were used from the AIBS atlas (22). Maybrain software (https://github.com/rittman/ maybrain) matched centroids of MRI regions to the closest
AIBS region. For the cross-sectional analyses a leave-one-out approach and three of six permutations of AIBS brain samples were also used to ensure that results were robust to different combinations of AIBS subjects (seeSupplemental Methods). Statistical Analysis
PLS regression was used to investigate the association be-tween gene transcriptome of the healthy brain and WM con-nectivity loss in preHD. Code used to perform this analysis was adapted from Whitaker et al.(25). Random permutations of the gene predictor variable were also investigated to ensure that results were not due to chance (seeSupplemental Methods). GO Enrichment Analysis
We used the GO enrichment analysis and visualization tool (GOrilla) (http://cbl-gorilla.cs.technion.ac.il)(26)to identify GO terms that were significantly enriched in the target gene list. Overlap Between Gene Profiles and HD-Related Genes
To investigate similarities between gene profiles, we identified the significance of gene overlap between analyses using a hypergeometric distribution. GO enrichment analysis was also repeated with overlap genes removed to assess whether this affected the resulting GO terms. Overlap between genes in top GO terms and HD genes was also investigated.
Enrichment for HD-Related Genes
We investigated whether genes showing abnormal transcrip-tion in human and animal models of HD were enriched greater than chance in thefirst PLS components of the corticostriatal, interhemispheric, and intrahemispheric analyses. HD gene lists were obtained from Langfelder et al. (30). Additionally we
investigated whether HD-related genes were more strongly enriched in these gene lists than other biologically plausible gene sets, chosen at random. Gene sets for human supra-granular genes, oligodendrocytes, and cell cycle metabolism were also investigated (seeSupplemental Methods).
RESULTS
Gene Expression Profiles of the Healthy Human Brain Explain the Variance of Regional WM Connectivity Loss in preHD
For the majority of analyses the first PLS component accounted for a large percentage of the variance in regional WM loss. We therefore focused on this component. Gene expression data explained 66% of the variance of regional WM connectivity loss in the corticostriatal cross-sectional analysis and 70% in the longitudinal analysis for thefirst component of the PLS and 11% and 6%, respectively, for the second component. For the interhemispheric analysis, gene expres-sion explained 67% WM loss cross-sectionally and 17% longitudinally for the first component and 9% and 60%, respectively, for the second component. For the intrahemi-spheric analysis, gene expression explained 24% cross-sectionally and 65% longitudinally for the first component and 47% and 11%, respectively, for the second component. SeeSupplemental File 1 for the first component PLS gene weights for these analyses.
For each analysis the first components of the PLS were explored. The second components were also explored if they accounted for a large proportion of the variance. Variances explained by thefirst component ranged between 45% and 69% for random permutations of the gene predictor matrix; however, gene and ROI weights were very different from the original analysis.
Figure 1. Schematic illustrating subgroups of regional white matter connectivity. (A) Corticostriatal: connections between cortex and striatum (caudate and putamen) for each cortical region of interest. (B) Interhemispheric: connections to the opposite hemisphere for each cortical region of interest. (C) Intra-hemispheric: connections within the same hemisphere for each cortical region of interest. Light blue indicates the left hemisphere, purple indicates the right hemisphere, dark blue indicates the caudate, and yellow indicates the putamen.
Transcription and Connectivity Loss in Huntington
’s
458 Biological Psychiatry March 1, 2018; 83:456–465www.sobp.org/journal
Biological Psychiatry
Expression Profiles Associated With Cross-Sectional Variation in WM Connections in preHD Relative to Control Participants
Similar significant GO terms were seen for the corticostriatal and interhemispheric analyses including modulation of chem-ical synaptic transmission, regulation of cell projection orga-nization, and cell projection organization. We refer to these as a synaptic profile. For the intrahemispheric analysis the most significant GO terms included messenger RNA (mRNA) meta-bolic process, RNA processing, and chromatin organization (seeTable 1andFigure 2), which we refer to as a metabolic/ chromatin profile. For the intrahemispheric analysis the second component of the PLS was significantly associated with GO terms involved in myelination and lipid metabolism. See
Supplemental File 2 for all significant GO terms for each analysis.
The leave-one-out analyses showed that modulation of chemical synaptic signaling and cell projection organization were the most significant GO terms for corticostriatal and interhemispheric connections for nearly all permutations. For intrahemispheric connections, the GO terms mRNA metabolic process, RNA processing, and chromatin organization were among the most significant for all permutations. Similarly the addition of Gaussian noise also revealed consistent results (seeSupplemental File 3). The 3 out of 6 permutation analyses revealed similar findings across many of the 8 permutations (seeSupplemental File 4).
The use of fractional anisotropy (FA) weighting and the thresholded scale 60 easy Lausanne atlas resulted in a change
from synaptic to metabolic/chromatin profiles for the cortico-striatal and interhemispheric connections. For intrahemispheric connections FA weighting revealed a consistent metabolic/ chromatin profile. For the thresholded scale 60 Lausanne atlas, intrahemispheric connections showed a synaptic profile. There was no change in profiles across consensus thresholds of 75% and 50%. Cross-sectional analyses using random per-mutations of genes revealed very different GO terms at minimal levels of significance, suggesting that our results are not due to chance (seeSupplemental File 5).
Expression Profiles Associated With Longitudinal Change in WM Connections in preHD Relative to Control Participants
For both corticostriatal and interhemispheric analyses, longi-tudinal change in WM was associated with GO terms involving metabolism or chromatin organization (see Supplemental Table S1 and Supplemental Figures S1 and S2). For intra-hemispheric analysis, longitudinal change was associated with GO terns involved in mitochondrial function, metabolism, and synaptic transmission (see Supplemental Table S1 and
Supplemental Figure S3). The second component of the PLS for the interhemispheric analysis was significantly associated with a range of GO terms including immune function, devel-opment, and protein folding (see Supplemental File 2). In summary, these results suggest that regional gene expression profiles associated with loss of WM connectivity in preHD are involved in synaptic, metabolic, and chromatin-related bio-logical processes.
Table 1. Corticostriatal, Interhemispheric, and Intrahemispheric Cross-Sectional Analyses
GO Term Description p Value FDR q Value Enrichmenta Bb nc bd
PLS1 Corticostriatal Cross-Sectional
GO:0050773 Regulation of dendrite development 8.05E-07 3.03E-03 2.18 124 3150 48 GO:0050804 Modulation of chemical synaptic transmission 1.06E-06 3.19E-03 1.4 297 6419 151 GO:0031344 Regulation of cell projection organization 1.88E-06 4.06E-03 1.29 549 6375 255 GO:0044057 Regulation of system process 3.31E-06 4.98E-03 1.33 481 5795 209 GO:0030030 Cell projection organization 4.31E-06 5.41E-03 1.24 699 6498 319 PLS1 Interhemispheric Cross-Sectional
GO:0050804 Modulation of chemical synaptic transmission 1.40E-14 3.51E-11 1.74 297 5246 153 GO:0031344 Regulation of cell projection organization 1.99E-13 2.73E-10 1.64 549 3924 199 GO:0043623 Cellular protein complex assembly 7.20E-13 8.34E-10 1.65 371 4892 169 GO:0061024 Membrane organization 1.51E-11 1.19E-08 1.45 820 4221 283 GO:0030030 Cell projection organization 6.38E-11 3.85E-08 1.47 699 4281 248 PLS1 Intrahemispheric Cross-Sectional
GO:0016071 mRNA metabolic process 2.91E-33 1.12E-30 1.84 593 5085 313 GO:0006396 RNA processing 4.39E-30 1.58E-27 1.65 806 5357 402 GO:0006325 Chromatin organization 1.11E-25 3.73E-23 1.79 657 4364 289 GO:0006397 mRNA processing 4.33E-21 1.42E-18 1.78 402 5435 219 GO:0019083 Viral transcription 2.79E-20 8.77E-18 3.01 99 4044 68
Gene ontology (GO) terms for biological processes associated with top-ranking genes from thefirst component of the partial least squares (PLS) analysis. The topfive most significant GO terms are displayed for each analysis. Full tables can be found inSupplementary File 2. Redundant GO terms and those associated with.1000 genes have been excluded.
FDR, false discovery rate; mRNA, messenger RNA.
aEnrichment = (b/n) / (B/total number of genes). See Eden et al.(26)for further details. bTotal number of genes associated with a specific GO term.
cNumber of genes in the target set. dNumber of genes in the intersection.
Overlap Between Synaptic and Metabolic Gene Profiles and HD-Related Genes
A significant overlap of 346 genes (p , .001) was found be-tween the top genes in the corticostriatal analysis and intra-hemispheric analyses. These were then compared with the striatum genes showing transcriptional abnormalities in HD humans and animal models. This revealed eight genes in common, encoding proteins involved in cell cycle (CEP135), axon development (NEK1), and G protein coupling (ADORA2A; seeSupplemental File 6). GO enrichment analysis with overlap genes removed did not change the most significant GO terms. The GO terms modulation of chemical synaptic transmission and mRNA metabolic process showed overlap of seven genes. HD-related genes showed overlap of 44 genes with the GO terms modulation of chemical synaptic transmission and 7 genes with mRNA metabolic process. The overlaps were not greater than those expected by chance.
Dissociation of Corticostriatal, Interhemispheric, and Intrahemispheric Gene Enrichment in the Cortex
The next step in our analysis was to explore the spatial pattern of each gene expression profile in the brain. To determine what brain regions were enriched with each gene expression profile, we analyzed PLS ROI weights from each analysis where higher weights related to greater gene profile enrichment (see
Supplemental File 7for ROI weights for each analysis). Cortical regions with the highest weights in the corticostriatal analysis (cross-sectional) were predominantly in motor, parietal, and occipital cortices. Conversely, cortical regions with the highest weights in the interhemispheric analysis (cross-sectional) were predominantly in frontal, temporal, and insular cortices. Cortical regions with the highest weights in the intrahemi-spheric analysis (cross-sectional) included frontal, temporal, and occipital regions (see Supplemental Table S2 and
Figure 3). Plotting corticostriatal ROI weights against both
interhemispheric and intrahemispheric ROI weights revealed dissociation in terms of regions involved, where regions enriched in the corticostriatal analysis were distinctly different from those enriched in the interhemispheric and intrahemispheric analyses (see Figure 4). Cross-sectional analyses using random permutations of ROIs revealed very different distribution of ROI weights, suggesting that our re-sults are not due to chance (seeSupplemental Figure S5and
Supplemental File 7).
Enrichment of Genes Showing Abnormal
Transcription in HD Is Seen in the Corticostriatal and Interhemispheric Gene Expression Profiles Our next step was to assess whether genes that show abnormal transcription in HD, both in the cortex and in the striatum, may be associated with WM loss. The corticostriatal gene list was significantly enriched for abnormal HD genes in the striatum (p , .001) and in the cortex (p , .001). The interhemispheric gene list was significantly enriched for genes in the striatum (p , .001), but not in the cortex. No significant enrichment was seen for the intrahemispheric gene list (seeFigure 5). To ensure that the significance dif-ference for the striatum gene list was not related to the size of the gene data set we repeated the analysis using the top 25 most significant genes based on the q value from Hodges et al. (31). Results were consistent with the 515 gene list showing significant enrichment for HD genes in the striatum for the corticostriatal (p = .019) and interhemispheric (p = .004) analyses (seeSupplementary Figure S4). Enrichment compared against biologically plausible gene sets revealed similar results, for both 515 and 25 striatum gene lists, with significant enrichment for corticostriatal (p , .001) and interhemispheric analyses (p , .001) but not for the intra-hemispheric analysis. This suggests that abnormal tran-scription in HD may be associated with corticostriatal and interhemispheric WM connectivity loss.
Figure 2. Significant gene ontology (GO) terms for biological processes associated with the first component of the partial least squares analysis are plotted in semantic space, where similar terms are clustered together. (A) Corticostriatal cross-sectional analysis semantic similarity scatter plot. (B) Interhemispheric cross-sectional analysis semantic similarity scatter plot. (C) Intrahemispheric cross-sectional analysis semantic similarity scatter plot. In all plots, the topfive most significant GO terms are labeled for each analysis. Redundant GO terms and those associated with greater than 1000 genes have been excluded. Markers are scaled based on the log10 q value for the significance of each GO term. Large blue circles are highly significant, while red circles are less sig-nificant (see color bar). mRNA, messenger RNA.
Transcription and Connectivity Loss in Huntington
’s
460 Biological Psychiatry March 1, 2018; 83:456–465www.sobp.org/journal
Biological Psychiatry
To further investigate the relationship between changes in gene expression in HD relative to control participants and corticostriatal WM loss, we performed correlations between the log2 fold change in the Hodges et al.(31), Durrenberger et al. (32), and Langfelder et al. (30) studies for the 515 striatum gene set and the PLS weights from the cross-sectional corticostriatal analysis. This revealed negative
correlations between PLS weights and log2 fold change (Hodges et al. [r = 2.23, p = 1.1 3 1027], Durrenberger et al. [r = 2.23, p = 8.4 3 1028], Langfelder et al. [r = 20.19, p = 1.6 3 1025]; see Supplemental Figure S6). This suggests that genes associated with corticostriatal WM loss in preHD are also those that show reduced levels of transcription in human HD and animal models.
Figure 3. Region of interest weights for cross-sectional partial least squares regression analyses: (A) corticostriatal, (B) interhemispheric, and (C) intrahemispheric. Brain regions displayed on brain mesh. Size and color of region indicates size of re-gion of interest weight (ranked from smallest [1] to largest [6]). See color map.
Figure 4. Dissociation of corticostriatal and inter-and intrahemispheric gene enrichment in the cortex. (A) Region of interest (ROI) weights for thefirst partial least squares (PLS) component of the cross-sectional analysis for interhemispheric vs. cortico-striatal. (B) ROI weights for thefirst PLS component of the longitudinal analysis for interhemispheric vs. corticostriatal. (C) ROI weights for the first PLS component of the cross-sectional analysis for intra-hemispheric vs. corticostriatal. (D) ROI weights for thefirst PLS component of the longitudinal analysis for intrahemispheric vs. corticostriatal. Each red cir-cle represents a cortical ROI. PLS1,first partial least squares component.
Enrichment for Other Gene Lists
We also investigated enrichment for genes associated with the human supragranular cortex, oligodendrocytes, and cell cycle metabolism. The corticostriatal and interhemispheric gene lists were significantly enriched for human supragranular cortex genes (corticostriatal: p = .002, interhemispheric: p = .006) and oligodendrocyte genes (corticostriatal: p , .001, interhemi-spheric: p , .001), but not for cell cycle metabolism genes. Conversely, the intrahemispheric gene list was significantly enriched for cell cycle metabolism genes (p , .001), but not for human supragranular or oligodendrocyte genes. This suggests a relationship between corticostriatal WM loss and abnormal transcription in oligodendrocytes. Additionally, abnormal transcription in cortical supragranular genes, which are impli-cated in long-range connectivity (33), may be linked to con-nectivity corticostriatal and interhemispheric WM loss. DISCUSSION
In this study, we found that regional variance in WM loss in preHD is differentially associated with the pattern of expression
of genes involved in synaptic, metabolic, and chromatin-related processes in the healthy human brain. Corticostriatal and interhemispheric WM loss is associated with synaptic genes, whereas intrahemispheric WM loss is associated with metabolic and chromatin-related genes. There is also a distinction be-tween gene enrichment in cortical regions, where enrichment associated with corticostriatal connections is seen in more posterior regions such as motor, occipital, and parietal cortices, and gene enrichment associated with interhemispheric con-nections, which is seen in frontal, temporal, and insular cortices. We reveal that genes showing abnormal transcription in HD humans and animal models are overexpressed in the ranked gene list associated with corticostriatal and interhemispheric WM loss but not with intrahemispheric WM connection loss.
We focus on synaptic, metabolic, and chromatin-related genes to simplify interpretation of our results. However, spe-cific GO terms such as DNA metabolism may relate to DNA repair(34). DNA repair genes, such as MSH3, have been linked to CAG instability (35), age of onset (36), and disease pro-gression(34). The GO term mRNA metabolism may relate to splicing of mRNA, which has also been implicated in HD
Figure 5. Enrichment of genes showing abnormal transcription in Huntington’s disease (HD) in the first partial least squares (PLS) component for the cross-sectional analyses. (A) Corticostriatal analysis, HD striatum genes. (B) Interhemispheric analysis, HD striatum genes. (C) Intrahemispheric analysis, HD striatum genes. (D) Corticostriatal analysis, HD cortex genes. (E) Interhemispheric analysis, HD cortex genes. (F) Intrahemispheric analysis, HD cortex genes. The red circle illustrates the mean weight (on the x axis) for the gene list of interest in thefirst PLS component. The y axis represents the number of permutations of random genes from thefirst PLS component. Gene lists overexpressed in the first PLS component have a mean greater than that of the random permutations (red circle to the right of the permutation distribution). Rperm, random permutation mean.
Transcription and Connectivity Loss in Huntington
’s
462 Biological Psychiatry March 1, 2018; 83:456–465www.sobp.org/journal
Biological Psychiatry
pathogenesis. Aberrant splicing of the mutant HTT gene leads to the generation of the pathogenic exon 1 huntingtin protein
(37). We note that further work would be needed to link these specific gene sets directly to WM loss in HD.
Several studies have analyzed gene expression profiles in both human HD and animal models. Gene expression measured in postmortem brain samples from HD patients was most affected in the caudate, followed by the motor cortex, while no abnormalities were detected in the prefrontal asso-ciation cortex(31). The GO term showing greatest significance for both the caudate and motor cortex was synaptic trans-mission. Furthermore, significance for the GO terms meta-bolism and glucose metameta-bolism were seen in the cortex, but not in the caudate. Thesefindings agree with the associations between synaptic genes and corticostriatal WM connection loss and metabolic genes and intrahemispheric WM connec-tion loss that we demonstrate here.
In our previous longitudinal study, WM loss was greatest in corticostriatal and interhemispheric connections in preHD relative to control subjects. No group differences were seen in intrahemispheric connections(6). The analysis presented here is based on regional atrophy of connection subtype. Therefore, corticostriatal and interhemispheric regional atrophy is likely to be greater than intrahemispheric regional atrophy. Further-more, corticostriatal and interhemispheric connections have greater topographical lengths than intrahemispheric connec-tions (6). Therefore, these similarities between corticostriatal and interhemispheric connections may account for the simi-larity between gene profiles.
Changes from synaptic to metabolic profiles in cross-sectional versus longitudinal, streamline volume versus FA weighting, and Desikan versus scale 60 easy Lausanne atlas were seen for corticostriatal and interhemispheric connections. We investigated this further, showing that common genes highly ranked in both profiles. One explanation for this may be that atrophy scores cross-sectionally will be higher than lon-gitudinal rate of atrophy scores. Similarly, atrophy scores in the Desikan 68-region atlas are likely to be larger than in the more finely parcellated easy Lausanne scale 60 (110-region) atlas. With respect to FA weighting, this metric is difficult to interpret in crossingfiber regions, which make up an estimated 60% to 90% of the human brain(38).
The GO categories identified contain large numbers of genes. We therefore balance this data-driven approach by investigating whether gene profiles associated with regional WM loss in preHD are enriched for genes known to show abnormal transcription in both human HD and animal models. Similar GO terms such as synaptic transmission and chromatin modification have been associated with functional brain net-works in healthy participants(24,39). This likely represents the close relationship between the healthy brain network and the perturbation of that network in neurodegeneration(40).
We acknowledge the limitations of diffusion tractography. To address these we used both constrained spherical deconvolution tractography, which deals more effectively with crossing fibers than the diffusion tensor or multitensor methods (28), and the spherical-deconvolution informed filtering of tractograms 2, which has higher reproducibility and is more representative of the underlying biology of WM con-nections than conventional methods (41). Constrained
spherical deconvolution tractography performs well at the acquisition protocol specifications used in this study (b =1000)
(42,43). At b = 1000, a minimum number of 28 gradient di-rections is required (44). Therefore, the angular coverage achieved using constrained spherical deconvolution tractog-raphy at b = 1000 is more than sufficient, with 42 directions.
The use of gene expression data from the healthy human brain to explain WM loss in preHD is limited to the extent that transcription in preHD may be different than that seen in healthy brains. However, studies from postmortem manifest HD brains show that the transcription in the striatum is most affected, with limited abnormalities in the cortex(31). Indeed, the transcription of only 25 genes in the cortex is abnormal in both human and animal studies, compared with 515 in the striatum(30). Therefore, we mitigated for the likely transcription abnormalities in preHD by using only cortical gene expression data from the AIBS transcriptome atlas(45).
We mapped the anatomical location of ROIs to corre-sponding regions in the AIBS atlas. However, the resolution of these atlases are different, and thus we acknowledge that the correspondence may not be exact and may be a limitation of our methodology. There are other human brain transcriptome atlas such as Braineac (46) and the Human Brain Tran-scriptome project(47); however, these atlases offer low reso-lution compared with the AIBS atlas, in which only a small number of cortical regions have been sampled, so the analysis carried out in this study could not be reproduced using Brai-neac or the Human Brain Transcriptome project atlas.
The utility of using information from the healthy human brain to inform us about the patterns and mechanisms of degeneration has been demonstrated many times in neuro-imaging. Functional connectivity and WM networks from healthy participants can predict atrophy in Alzheimer’s dis-ease, corticobasal syndrome, frontotemporal dementia, and Parkinson’s disease(41,48–50). More recently, transcriptome data from the healthy brains of the AIBS atlas has been used to investigate the association between the expression of schizophrenia risk genes and WM disconnectivity (51). The regional expression of the tau gene MAPT from the AIBS atlas has also been linked to the selective vulnerability of highly connected brain regions in Parkinson’s disease and progres-sive supranuclear palsy(52).
Conclusions
We show that corticostriatal and interhemispheric WM connection loss is associated with the expression of synaptic genes in preHD, while intrahemispheric WM loss is associated with metabolic genes. Genes showing abnormal transcription in HD are associated with the synaptic profiles, but not with metabolic gene profiles. These findings have important impli-cations for linking the earliest WM changes in preHD to the underlying pathological processes that may drive them. ACKNOWLEDGMENTS AND DISCLOSURES
This work was supported by Wellcome Trust Grant Nos. 091593/Z/10/Z and 103437/Z/13/Z (to GR and PMC) and the National Institute for Health Research, University College London Hospitals, Biomedical Research Centre. The Track-On HD study is funded by the CHDI Foundation, a not-for-profit organization dedicated to finding treatments for Huntington’s disease.
We would like to thank Timothy Rittman for guidance on using Maybrain software and Drs Kirstie Whitaker and Petra Vértes for making their code freely available and guidance on its implementation.
All authors report no biomedicalfinancial interests or potential conflicts of interest.
ARTICLE INFORMATION
From the Huntington’s Disease Centre (PM, SG, MP, EJ, RIS, SJT), Department of Neurodegenerative Disease; and Wellcome Trust Centre for Neuroimaging (AR, GR), UCL Institute of Neurology; Developmental Imaging and Biophysics Section (KKS, CAC), UCL Institute of Child Health; and National Hospital for Neurology and Neurosurgery (SJT), Queen Square, London; and the MRC Centre for Neuropsychiatric Genetics and Genomics (PH), School of Medicine, Cardiff University, Cardiff, United Kingdom; Department of Electronic Engineering (AR), NED University of Engineering and Technology, Karachi, Pakistan; APHP Department of Genetics (AD), University Hospital Pitié-Salpêtrière; and ICM (Brain and Spine Institute) INSERM U1127 (AD), CNRS UMR7225, Sorbonne Universités– UPMC Paris VI UMR_S1127, Paris, France; Department of Neurology (RACR), Leiden University Medical Centre, Leiden, the Netherlands; and the Centre for Molecular Medicine and Therapeutics (BRL), Department of Medical Genetics, University of British Columbia, Vancouver, British Columbia, Canada.
The Track-On HD Investigators are A. Coleman, J. Decolongon, M. Fan, T. Petkau (University of British Columbia, Vancouver, Canada); C. Jauffret, D. Justo, S. Lehericy, K. Nigaud, R. Valabrègue (ICM and APHP, Pitié-Salpêtrière University Hospital, Paris, France). A. Schoonderbeek, E. P.‘t Hart (Leiden University Medical Centre, Leiden, the Netherlands); D. J. Hensman Moss, R. Ghosh, H. Crawford, M. Papoutsi, C. Berna, D. Mahaleskshmi (University College London, London, United Kingdom). R. Reilmann, N. Weber (George Huntington Institute, Münster, Germany); I. Labuschagne, J. Stout (Monash University, Melbourne, Australia); B. Landwehrmeyer, M. Orth, I. Mayer (University of Ulm, Ulm, Germany); H. Johnson (University of Iowa, Iowa City, IA); D. Crawfurd (University of Manchester, Manchester, United Kingdom).
GR and SJT contributed equally to this work
Address correspondence to Sarah J. Tabrizi, B.Sc. (Hons), MB.ChB. (Hons), FRCP, Ph.D., F.Med.Sci., UCL Huntington’s Disease Centre, Department of Neurodegenerative Disease, UCL Institute of Neurology and National Hospital for Neurology and Neurosurgery, Box 104, Queen Square, London WC1N 3BG, United Kingdom; E-mail:s.tabrizi@ucl.ac.uk.
Received Apr 19, 2017; revised Oct 5, 2017; accepted Oct 7, 2017. Supplementary material cited in this article is available online athttps:// doi.org/10.1016/j.biopsych.2017.10.019.
REFERENCES
1. Bates GP, Dorsey R, Gusella JF, Hayden MR, Kay C, Leavitt BR, et al. (2015): Huntington disease. Nat Rev Dis Primers 1:15005.
2. Tabrizi SJ, Scahill RI, Durr A, Roos RA, Leavitt BR, Jones R, et al. (2011): Biological and clinical changes in premanifest and early stage Huntington’s disease in the TRACK-HD study: The 12-month longi-tudinal analysis. Lancet Neurol 10:31–42.
3. Dumas EM, van den Bogaard SJ, Ruber ME, Reilman RR, Stout JC, Craufurd D, et al. (2012): Early changes in white matter pathways of the sensorimotor cortex in premanifest Huntington’s disease. Hum Brain Mapp 33:203–212.
4. Di Paola M, Luders E, Cherubini A, Sanchez-Castaneda C, Thompson PM, Toga AW, et al. (2012): Multimodal MRI analysis of the corpus callosum reveals white matter differences in presymptomatic and early Huntington’s disease. Cereb Cortex 22:2858–2866. 5. Faria AV, Ratnanather JT, Tward DJ, Lee DS, van den Noort F, Wu D,
et al. (2016): Linking white matter and deep gray matter alterations in premanifest Huntington disease. Neuroimage Clin 11:450–460. 6. McColgan P, Seunarine KK, Gregory S, Razi A, Papoutsi M, Long JD, et al.
(2017): Topological length of white matter connections predicts their rate of atrophy in premanifest Huntington’s disease. JCI Insight 2:92641. 7. Tabrizi SJ, Langbehn DR, Leavitt BR, Roos RA, Durr A, Craufurd D,
et al. (2009): Biological and clinical manifestations of Huntington’s
disease in the longitudinal TRACK-HD study: Cross-sectional analysis of baseline data. Lancet Neurol 8:791–801.
8. Ross CA, Tabrizi SJ (2011): Huntington’s disease: From molecular
pathogenesis to clinical treatment. Lancet Neurol 10:83–98. 9. Saudou F, Humbert S (2016): The biology of huntingtin. Neuron
89:910–926.
10. Plotkin JL, Surmeier DJ (2015): Corticostriatal synaptic adaptations in Huntington’s disease. Curr Opin Neurobiol 33:53–62.
11. Lee JM, Ivanova EV, Seong IS, Cashorali T, Kohane I, Gusella JF, et al. (2007): Unbiased gene expression analysis implicates the huntingtin polyglutamine tract in extra-mitochondrial energy metabolism. PLoS Genet 3:e135.
12. Tabrizi SJ, Workman J, Hart PE, Mangiarini L, Mahal A, Bates G, et al. (2000): Mitochondrial dysfunction and free radical damage in the Huntington R6/2 transgenic mouse. Ann Neurol 47:80–86.
13. Andre R, Carty L, Tabrizi SJ (2016): Disruption of immune cell function by mutant huntingtin in Huntington’s disease pathogenesis. Curr Opin Pharmacol 26:33–38.
14. Seredenina T, Luthi-Carter R (2012): What have we learned from gene expression profiles in Huntington’s disease? Neurobiol Dis 45:83–98.
15. Miller JR, Lo KK, Andre R, Hensman Moss DJ, Trager U, Stone TC, et al. (2016): RNA-Seq of Huntington’s disease patient myeloid cells reveals innate transcriptional dysregulation associated with proinflammatory pathway activation. Hum Mol Genet 25: 2893–2904.
16. Zucker B, Kama JA, Kuhn A, Thu D, Orlando LR, Dunah AW, et al. (2010): Decreased Lin7b expression in layer 5 pyramidal neurons may contribute to impaired corticostriatal connectivity in huntington dis-ease. J Neuropathol Exp Neurol 69:880–895.
17. Gambazzi L, Gokce O, Seredenina T, Katsyuba E, Runne H, Markram H, et al. (2010): Diminished activity-dependent brain-derived neurotrophic factor expression underlies cortical neuron microcircuit hypoconnectivity resulting from exposure to mutant huntingtin frag-ments. J Pharmacol Exp Ther 335:13–22.
18. Fusco FR, Zuccato C, Tartari M, Martorana A, De March Z, Giampa C, et al. (2003): Co-localization of brain-derived neurotrophic factor (BDNF) and wild-type huntingtin in normal and quinolinic acid-lesioned rat brain. Eur J Neurosci 18:1093–1102.
19. Espindola S, Vilches-Flores A, Hernandez-Echeagaray E (2012): 3-Nitropropionic acid modifies neurotrophin mRNA expression in the mouse striatum: 18S-rRNA is a reliable control gene for studies of the striatum. Neurosci Bull 28:517–531.
20. Xiang Z, Valenza M, Cui L, Leoni V, Jeong HK, Brilli E, et al. (2011): Peroxisome-proliferator-activated receptor gamma coactivator 1 alpha contributes to dysmyelination in experimental models of Huntington’s disease. J Neurosci 31:9544–9553.
21. Teo RT, Hong X, Yu-Taeger L, Huang Y, Tan LJ, Xie Y, et al. (2016): Structural and molecular myelination deficits occur prior to neuronal loss in the YAC128 and BACHD models of Huntington disease. Hum Mol Genet 25:2621–2632.
22. Hawrylycz M, Miller JA, Menon V, Feng D, Dolbeare T, Guillozet-Bongaarts AL, et al. (2015): Canonical genetic signatures of the adult human brain. Nat Neurosci 18:1832–1844.
23. Desikan RS, Segonne F, Fischl B, Quinn BT, Dickerson BC, Blacker D, et al. (2006): An automated labeling system for subdividing the human cerebral cortex on MRI scans into gyral based regions of interest. Neuroimage 31:968–980.
24. Vértes PE, Rittman T, Whitaker KJ, Romero-Garcia R, Vasa F, Kitzbichler MG, et al. (2016): Gene transcription profiles associated with inter-modular hubs and connection distance in human functional magnetic resonance imaging networks. Philos Trans R Soc Lond B Biol Sci 371:20150362.
25. Whitaker KJ, Vértes PE, Romero-Garcia R, Vasa F, Moutoussis M, Prabhu G, et al. (2016): Adolescence is associated with genomically patterned consolidation of the hubs of the human brain connectome. Proc Natl Acad Sci U S A 113:9105–9110.
26. Eden E, Navon R, Steinfeld I, Lipson D, Yakhini Z (2009): GOrilla: a tool for discovery and visualization of enriched GO terms in ranked gene lists. BMC Bioinformatics 10:48.
Transcription and Connectivity Loss in Huntington
’s
464 Biological Psychiatry March 1, 2018; 83:456–465www.sobp.org/journal
Biological Psychiatry
27. Kloppel S, Gregory S, Scheller E, Minkova L, Razi A, Durr A, et al. (2015): Compensation in preclinical Huntington’s disease: Evidence from the Track-On HD study. EBioMedicine 2:1420–1429.
28. Tournier JD, Calamante F, Connelly A (2012): MRtrix: Diffusion trac-tography in crossingfiber regions. Imaging Syst Technol 22:53–56. 29. Smith RE, Tournier JD, Calamante F, Connelly A (2015): SIFT2:
Enabling dense quantitative assessment of brain white matter con-nectivity using streamlines tractography. Neuroimage 119:338–351. 30. Langfelder P, Cantle JP, Chatzopoulou D, Wang N, Gao F, Al-Ramahi I,
et al. (2016): Integrated genomics and proteomics define huntingtin CAG length-dependent networks in mice. Nat Neurosci 19:623–633. 31. Hodges A, Strand AD, Aragaki AK, Kuhn A, Sengstag T, Hughes G,
et al. (2006): Regional and cellular gene expression changes in human Huntington’s disease brain. Hum Mol Genet 15:965–977.
32. Durrenberger PF, Fernando FS, Kashefi SN, Bonnert TP, Seilhean D, Nait-Oumesmar B, et al. (2015): Common mechanisms in neuro-degeneration and neuroinflammation: A BrainNet Europe gene expression microarray study. J Neural Transm (Vienna) 122:1055–1068. 33. Krienen FM, Yeo BT, Ge T, Buckner RL, Sherwood CC (2016): Tran-scriptional profiles of supragranular-enriched genes associate with corticocortical network architecture in the human brain. Proc Natl Acad Sci U S A 113:E469–E478.
34. Moss DJH, Pardinas AF, Langbehn D, Lo K, Leavitt BR, Roos R, et al. (2017): Identification of genetic variants associated with Huntington’s disease progression: A genome-wide association study. Lancet Neurol 16:701–711.
35. Gonitel R, Moffitt H, Sathasivam K, Woodman B, Detloff PJ, Faull RL, et al. (2008): DNA instability in postmitotic neurons. Proc Natl Acad Sci U S A 105:3467–3472.
36. Genetic Modifiers of Huntington’s Disease (GeM-HD) Consortium
(2015): Identification of genetic factors that modify clinical onset of Huntington’s disease. Cell 162:516–526.
37. Sathasivam K, Neueder A, Gipson TA, Landles C, Benjamin AC, Bondulich MK, et al. (2013): Aberrant splicing of HTT generates the pathogenic exon 1 protein in Huntington disease. Proc Natl Acad Sci U S A 110:2366–2370.
38. Jeurissen B, Leemans A, Tournier JD, Jones DK, Sijbers J (2013): Investigating the prevalence of complexfiber configurations in white matter tissue with diffusion magnetic resonance imaging. Hum Brain Mapp 34:2747–2766.
39. Richiardi J, Altmann A, Milazzo AC, Chang C, Chakravarty MM, Banaschewski T, et al. (2015): BRAIN NETWORKS. Correlated gene expression supports synchronous activity in brain networks. Science 348:1241–1244.
40. Zhou J, Gennatas ED, Kramer JH, Miller BL, Seeley WW (2012): Pre-dicting regional neurodegeneration from the healthy brain functional connectome. Neuron 73:1216–1227.
41. Smith RE, Tournier JD, Calamante F, Connelly A (2015): The effects of SIFT on the reproducibility and biological accuracy of the structural connectome. Neuroimage 104:253–265.
42. Ramirez-Manzanares A, Cook PA, Hall M, Ashtari M, Gee JC (2011): Resolving axon fiber crossings at clinical b-values: An evaluation study. Med Phys 38:5239–5253.
43. Wilkins B, Lee N, Gajawelli N, Law M, Lepore N (2015): Fiber estima-tion and tractography in diffusion MRI: Development of simulated brain images and comparison of multi-fiber analysis methods at clinical b-values. Neuroimage 109:341–356.
44. Tournier JD, Calamante F, Connelly A (2013): Determination of the appropriate b value and number of gradient directions for high-angular-resolution diffusion-weighted imaging. NMR Biomed 26:1775–1786.
45. Hawrylycz MJ, Lein ES, Guillozet-Bongaarts AL, Shen EH, Ng L, Miller JA, et al. (2012): An anatomically comprehensive atlas of the adult human brain transcriptome. Nature 489:391–399.
46. Ramasamy A, Trabzuni D, Guelfi S, Varghese V, Smith C, Walker R,
et al. (2014): Genetic variability in the regulation of gene expression in ten regions of the human brain. Nat Neurosci 17:1418–1428. 47. Kang HJ, Kawasawa YI, Cheng F, Zhu Y, Xu X, Li M, et al. (2011):
Spatio-temporal transcriptome of the human brain. Nature 478: 483–489.
48. Mandelli ML, Vilaplana E, Brown JA, Hubbard HI, Binney RJ, Attygalle S, et al. (2016): Healthy brain connectivity predicts atrophy progression in non-fluent variant of primary progressive aphasia. Brain 139:2778–2791.
49. Seeley WW, Crawford RK, Zhou J, Miller BL, Greicius MD (2009): Neurodegenerative diseases target large-scale human brain networks. Neuron 62:42–52.
50. Zeighami Y, Ulla M, Iturria-Medina Y, Dadar M, Zhang Y, Larcher KM, et al. (2015): Network structure of brain atrophy in de novo Parkinson’s disease. Elife 4:08440.
51. Romme IA, de Reus MA, Ophoff RA, Kahn RS, van den Heuvel MP (2016): Connectome disconnectivity and cortical gene expression in patients with schizophrenia. Biol Psychiatry 81:495–502.
52. Rittman T, Rubinov M, Vértes PE, Patel AX, Ginestet CE, Ghosh BC, et al. (2016): Regional expression of the MAPT gene is associated with loss of hubs in brain networks and cognitive impairment in Parkinson disease and progressive supranuclear palsy. Neurobiol Aging 48:153–160.