HAL Id: inserm-01023921
https://www.hal.inserm.fr/inserm-01023921
Submitted on 15 Jul 2014
HAL is a multi-disciplinary open access
archive for the deposit and dissemination of
sci-entific research documents, whether they are
pub-lished or not. The documents may come from
teaching and research institutions in France or
abroad, or from public or private research centers.
L’archive ouverte pluridisciplinaire HAL, est
destinée au dépôt et à la diffusion de documents
scientifiques de niveau recherche, publiés ou non,
émanant des établissements d’enseignement et de
recherche français ou étrangers, des laboratoires
publics ou privés.
a predictor of clinical outcome in chronic lymphocytic
leukemia patients.
Elias Bou Samra, Bernard Klein, Thérèse Commes, Jérôme Moreaux
To cite this version:
Elias Bou Samra, Bernard Klein, Thérèse Commes, Jérôme Moreaux. Identification of a 20-gene
expression-based risk score as a predictor of clinical outcome in chronic lymphocytic leukemia
pa-tients.. BioMed Research International , Hindawi Publishing Corporation, 2014, 2014, pp.423174.
�10.1155/2014/423174�. �inserm-01023921�
Research Article
Identification of a 20-Gene Expression-Based Risk
Score as a Predictor of Clinical Outcome in Chronic
Lymphocytic Leukemia Patients
Elias Bou Samra,
1Bernard Klein,
1,2,3Thérèse Commes,
1,4and Jérôme Moreaux
1,2,31INSERM, U1040, F-34197, Institute of Research in Biotherapy, CHU Montpellier, 80 Avenue Augustin Fliche,
34285 Montpellier Cedex, France
2CHU Montpellier, Institute of Research in Biotherapy, Montpellier, 80 Avenue Augustin Fliche, 34285 Montpellier, France
3Universit´e Montpellier 1, UFR M´edecine, Montpellier, 80 Avenue Augustin Fliche, 34285 Montpellier, France
4Institut de Biologie Computationnelle, Universit´e Montpellier 2, 2 Place Eug`ene Bataillon, 34095 Montpellier Cedex 5, France
Correspondence should be addressed to J´erˆome Moreaux; jerome.moreaux@inserm.fr
Received 26 September 2013; Revised 18 March 2014; Accepted 20 March 2014; Published 5 May 2014 Academic Editor: Carlo Visco
Copyright © 2014 Elias Bou Samra et al. his is an open access article distributed under the Creative Commons Attribution License, which permits unrestricted use, distribution, and reproduction in any medium, provided the original work is properly cited. Despite the improvement in treatment options, chronic lymphocytic leukemia (CLL) remains an incurable disease and patients show a heterogeneous clinical course requiring therapy for many of them. In the current work, we have built a 20-gene expression (GE)-based risk score predictive for patients overall survival and improving risk classiication using microarray gene expression data. GE-based risk score allowed identifying a high-risk group associated with a signiicant shorter overall survival (OS) and time
to treatment (TTT)(� ≤ .01), comprising 19.6% and 13.6% of the patients in two independent cohorts. GE-based risk score, and
NRIP1 and TCF7 gene expression remained independent prognostic factors using multivariate Cox analyses and combination of GE-based risk score together with NRIP1 and TCF7 gene expression enabled the identiication of three clinically distinct groups of CLL patients. herefore, this GE-based risk score represents a powerful tool for risk stratiication and outcome prediction of CLL patients and could thus be used to guide clinical and therapeutic decisions prospectively.
1. Introduction
Chronic lymphocytic leukemia (CLL), the most common leukemia in the western countries, is characterized by the clonal proliferation and accumulation of neoplastic B lym-phocytes in the blood, bone marrow, lymph nodes, and spleen. CLL shows a heterogeneous clinical course, with many patients having an indolent disease while others suf-fering from rapid disease progression and are in need of early treatment [1]. Clinical staging systems based on physical examination and routine laboratory tests are the irst basis for assessing diferent prognostic subgroups in patients with CLL [1]. However, these staging systems have a limited capacity to predict clinical outcome at an early stage of the disease and do not predict the likelihood of response to treatment in an individual with advanced disease [2].
Several biomarkers have been identiied out as prognos-tic factors in CLL. hese include somaprognos-tic hypermutations in the rearranged variable regions of the immunoglobulin heavy chain (IgVH) genes, which involve around 30–40% of patients. Patients with unmutated IgVH genes had a signiicantly shorter median overall survival (OS) than those with mutated ones [3]. IgVH mutation status, along with deletions at 11q22-q23 (11q-) and/or 17p13 (17p-), has been identiied as independent prognostic factors in CLL patients [4,5].
Meanwhile, with the advent of microarray technology and gene expression proiling (GEP) analyses, additional markers have been investigated for their potential prognostic impact in CLL. Of these, LPL (Lipoprotein lipase) [6], ZAP70 (zeta-associated protein 70) [7], CLLU1 (Chronic
Volume 2014, Article ID 423174, 10 pages http://dx.doi.org/10.1155/2014/423174
lymphocytic leukemia up-regulated 1) [8], and TCL1A (T-cell leukemia/lymphoma 1A) [9] have been demonstrated to be predictive for clinical outcome. Expression of microRNAs (e.g., miR-29c and miR-223) could be also of prognostic signiicance in CLL [10]. hese markers combined with others were used to develop multigene expression-based prognostic scores. In 2006, Zucchetto et al. constructed a scoring system based on six surface expression molecules [11]. In a study by Rodr´ıguez et al. [12], a predictor model based on the expression of seven genes allowed the characterization of three groups of patients with distinct OS and treatment-free survival (TFS), both in two independent cohorts of patients. In 2010, Kienle et al. identiied a four-gene combination, based on ZAP70, TCF7 (Transcription factor 7), DMD (Dys-trophin), and ATM (Ataxia telangiectasia mutated) expres-sion, as a predictor of IgVH mutation status in 88% of cases [13]. Stamatopoulos et al. developed a qPCR score, based on the expression of three markers (ZAP70, LPL and miR-29c), that was able to signiicantly predict OS and TFS by dividing patients into three groups [14]. More recently, Herold et al. developed an eight-gene expression-based risk score which showed additional prognostic value for OS and TFS compared with the established genetic markers and Binet staging [15].
We report here the design of a GE-based risk score, involving 20 genes, whose value is strongly prognostic in 2 independent cohorts of CLL patients.
2. Methods
2.1. Patients. Gene expression microarray data from three independent cohorts of patients diagnosed with CLL were used. Publicly available gene expression data from 2 cohorts with newly diagnosed CLL patients were used to construct GE-based risk score [15]. he irst cohort, used as the training cohort, comprised 107 patients, and the second one as the validation cohort comprised 44 patients [15]. Peripheral blood or bone marrow samples were analyzed by Afymetrix oligonucleotide microarrays [15]. A third cohort of 130 newly diagnosed patients, with available Afymetrix gene expression data, was used as validation cohort for time to treatment analyses [16]. Clinical characteristics of patients and number and schedules of treatments were previously published [15,16]. Interphase FISH data of the training cohort were previously published [17]. Afymetrix gene expression data are publicly available via the online Gene Expression Omnibus (http://www.ncbi.nlm.nih.gov/geo/) under acces-sion number GSE22762, GSE39671, and GSE25571. he data were normalized using the robust multichip average (RMA) method [15,16].
2.2. Gene Expression Profiling and Statistical Analyses. he statistical signiicance of diferences in overall survival between groups of patients was calculated by the log-rank test. Multivariate analysis was performed using the Cox proportional hazards model. Survival curves were plotted using the Kaplan-Meier method. All these analyses have been done with R.2.10.1 and bioconductor version 2.5.
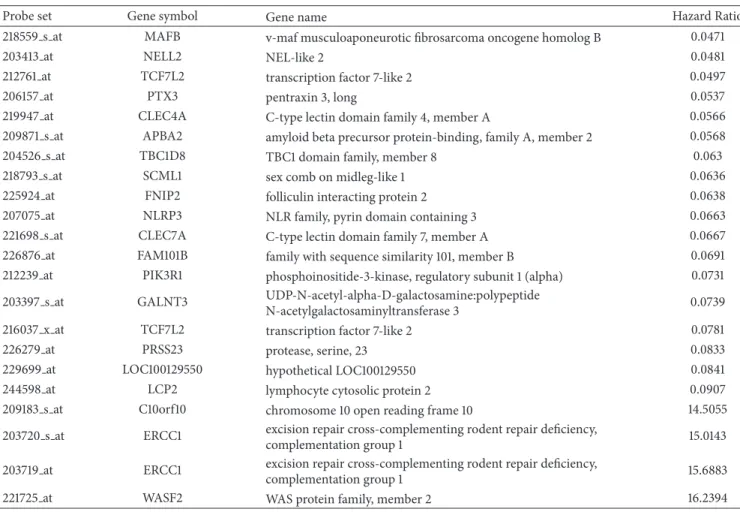
2.3. Selection of Prognostic Genes on the Training Set. Probe sets were selected for prognostic signiicance using Maxstat R function (R.2.10.1 and bioconductor version 2.5) and Ben-jamini Hochberg multiple testing correction [18], yielding 22 signiicant probe sets in the two independent cohorts of patients with CLL (Table 1).
2.4. Validation in the Independent Cohort of Patients. he GE-based risk score of CLL patients was individually calculated and patients were grouped according to the prognostic models and cutofs from the training cohort. he prognostic value of this scoring was evaluated using log-rank statistics and Cox models.
2.5. Gene Set Enrichment Analysis (GSEA). We compared the gene expression levels from high GE-risk score versus low risk score CLL patients and picked up the genes which had signiicant diferent expressions for gene set enrichment analysis (GSEA). Gene set enrichment analysis was carried out by computing overlaps with canonical pathways and gene ontology gene sets obtained from the broad institute [19].
3. Results
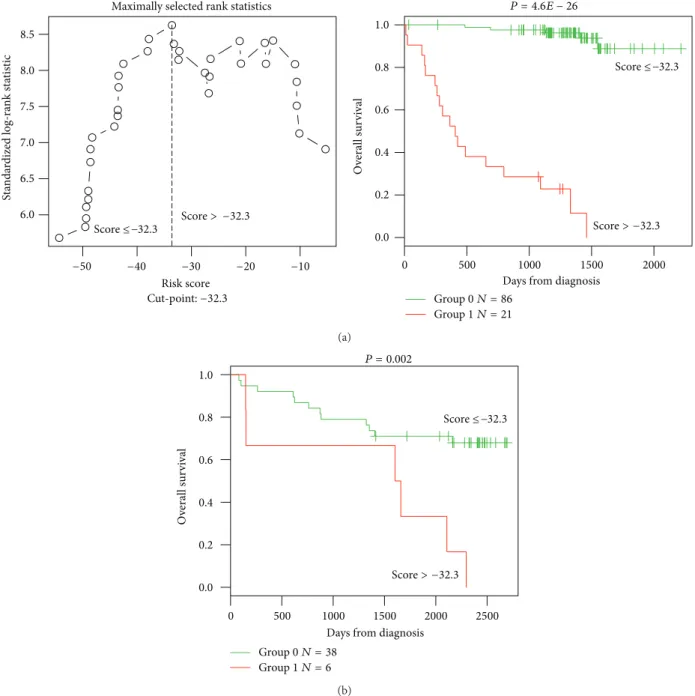
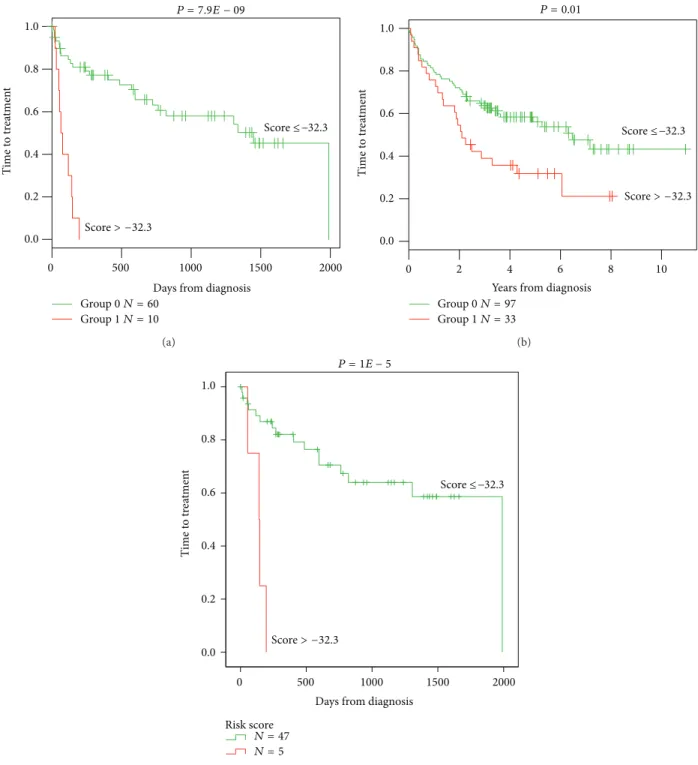
3.1. GE-Based Risk Score in CLL. Using Maxstat R function and Benjamini-Hochberg multiple testing correction [18], 22 probe sets were found to have prognostic value for OS (adjusted � value < 0.05) in two independent cohorts of patients with previously-untreated CLL (GSE22762,� = 107 and� = 44 [15]) (Table 1). hese 22 probe sets were probed for 20 unique genes and were used to build a GE-based risk score as reported [20]. Figures1(a)and1(b)show expression of the 22 prognostic probe sets and GE-based risk score from patients’ tumor samples of the training cohort (ranked according to increasing GE-based risk score). When used as a continuous variable, GE-based risk score had a prognostic value in the two cohorts of patients with CLL (P ≤ 10–4, data not shown). Patients of the training cohort (� = 107) were ranked according to increased prognostic score and, for a given score value X, the diference in survival of patients with a GE-based risk score ≤X or >X was computed. A maximum diference in overall survival (OS) was obtained with X = −32.3, splitting patients into a high-risk group (19.6% of patients, GE-based risk score> −32.3) with a 13.4 months median OS and a low-risk group (80.4% of patients, GE-based risk score ≤ −32.3) with not reached median survival (Figure 2(a)). he prognostic value of GE-based risk score was validated in an independent CLL patient’s cohort (� = 44) (Figure 2(b)). Interestingly, a high GE-based risk score is associated with a shorter median time to treatment requirement in two independent cohorts of CLL patients, that is, 2.1 months and 25.2 months for patients with GE score > −32.5 versus 47,7 and 78 months for patients with GE score ≤ −32.5 (� = 7.9� − 9 and � = 0.01, resp.) (Figures3(a)and
3(b)). In order to investigate the prognostic value of the GE-based risk score in regards to time of irst treatment in CLL patients with good prognostic, the analysis was completed in patients without Del17p, without Del11q, and without
Table 1: List of the 22 probe sets associated with a prognostic value in CLL patients.
Probe set Gene symbol Gene name Hazard Ratio
218559 s at MAFB v-maf musculoaponeurotic ibrosarcoma oncogene homolog B 0.0471
203413 at NELL2 NEL-like 2 0.0481
212761 at TCF7L2 transcription factor 7-like 2 0.0497
206157 at PTX3 pentraxin 3, long 0.0537
219947 at CLEC4A C-type lectin domain family 4, member A 0.0566
209871 s at APBA2 amyloid beta precursor protein-binding, family A, member 2 0.0568
204526 s at TBC1D8 TBC1 domain family, member 8 0.063
218793 s at SCML1 sex comb on midleg-like 1 0.0636
225924 at FNIP2 folliculin interacting protein 2 0.0638
207075 at NLRP3 NLR family, pyrin domain containing 3 0.0663
221698 s at CLEC7A C-type lectin domain family 7, member A 0.0667
226876 at FAM101B family with sequence similarity 101, member B 0.0691
212239 at PIK3R1 phosphoinositide-3-kinase, regulatory subunit 1 (alpha) 0.0731
203397 s at GALNT3 UDP-N-acetyl-alpha-D-galactosamine:polypeptide
N-acetylgalactosaminyltransferase 3 0.0739
216037 x at TCF7L2 transcription factor 7-like 2 0.0781
226279 at PRSS23 protease, serine, 23 0.0833
229699 at LOC100129550 hypothetical LOC100129550 0.0841
244598 at LCP2 lymphocyte cytosolic protein 2 0.0907
209183 s at C10orf10 chromosome 10 open reading frame 10 14.5055
203720 s at ERCC1 excision repair cross-complementing rodent repair deiciency,
complementation group 1 15.0143
203719 at ERCC1 excision repair cross-complementing rodent repair deiciency,
complementation group 1 15.6883
221725 at WASF2 WAS protein family, member 2 16.2394
Hazard ratios (HR) are indicated for each gene used to design GE-based risk score in CLL patients. Probe sets are sorted by increasing HR.
trisomy 12 known to be associated with a poor prognosis [21]. High GE-based risk score is associated with a shorter time to treatment requirement in patients with cytogenetically deined good prognostic (4.7 months for patients with GE score> −32.5 versus 65.4 for patients with GE score ≤ −32.5, � = 1� − 5) (Figure 3(c)).
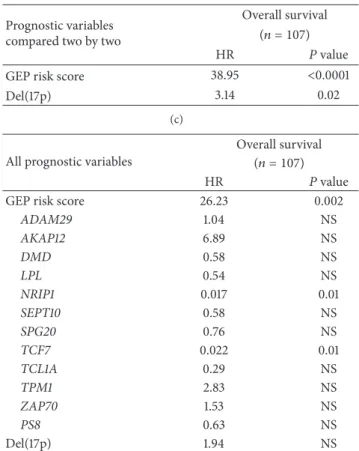
Cox analysis was used to determine whether GE-based risk score provides additional prognostic information com-pared to previously-identiied gene expression-based prog-nostic markers such as ADAM29 (a disintegrin and metal-loprotease domain 29), AKAP12 (a kinase (PRKA) anchor protein 12), DMD, LPL, NRIP1 (Nuclear receptor-interacting protein 1), SET10 (Septin 10), SPG20 (Spastic paraplegia 20), TCF7, TCL1A, TPM1 (Tropomyosin 1), ZAP70 gene expression, the Herold’s GEP-based prognostic score (PS8), and Del17p (Table 2) [22–27]. None of these genes were included in the current 20 prognostic genes. Using univariate analyses, GE-based risk score, ADAM29, AKAP12, DMD, LPL, NRIP1, SET10, SPG20, TCF7, TCL1A, TPM1, ZAP70 gene expression, PS8, and Del17p were prognostic (� < 0.05,
Table 2(a)). When compared two by two, GE-based risk score tested with NRIP1, SPG20, TCF7, and TPM1 expression, PS8 or Del17p remained signiicant (� < 0.01,Table 2(b)). When all parameters were tested together, only GE-based risk score,
NRIP1, and TCF7 gene expression kept prognostic value (Table 2(c)).
Karyotype investigations revealed the association of CLL with del13q14, trisomy 12, del11q22-q23, and del17p13 [1]. Del13q14 is the most frequent alteration that occurs in 50%– 60% of cases [1]; trisomy 12 and de11q22-q23 occur in approximately 15% of CLL cases [1] and del17p13 occurs in 5%–10% of untreated CLL patients [28]. Using a cohort of 109 patients with previously untreated CLL (GSE25571) [17], we investigated the association between the GE-based risk score and chromosomal abnormalities. GE-based risk score is signiicantly higher in patients with del17p13 (Supplementary Figure S1; Supplementary Material is available online at http://dx.doi.org/10.1155/2014/423174).
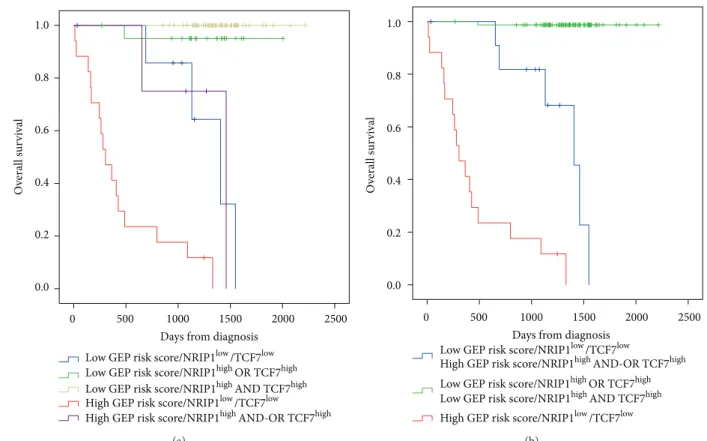
3.2. Combining Prognostic Information of GE-Based Risk Score and NRIP1 and TCF7 Expression, into a Single Staging. Since GE-based risk score and NRIP1 and TCF7 expression dis-played independent prognostic information, the prognostic information of the GE-based risk score was combined with those of TCF7 and NRIP1 gene expression into a single staging. Kaplan-Meier analysis with the 5 patient groups of the training cohort was performed (Figure 4(a)). When 2
Ge
n
es
CLL patients (increasing GE-based risk score)
Low High Expression scale (a) −80 −60 −40 −20 0 20 40 60 80 GE-bas ed r isk s co re o f CLL
CLL patients (increasing GE-based risk score)
(b)
Figure 1: GE-based risk score in CLL patients. (a) Clustergram of genes ordered from best to worst prognosis. he level of the probe set signal is displayed from low (deep blue) to high (deep red)
expression. (b) CLL patients (� = 107) were ordered by increasing
GE-based risk score.
consecutive groups showed no prognostic diference, they were merged resulting in a single staging splitting patients into a Group I comprising 72.9% of patients with low GE-based risk score/high TCF7 or NRIP1 expression and low GE-based risk score/high TCF7 and NRIP1 expression, a Group II comprising 11.2% of patients with low GE-based risk score/low TCF7/low NRIP1 expression and high GE-based risk score/high TCF7 and-or high NRIP1 expression, and a Group III comprising 15.9% of patients with high GE-based risk score/low TCF7/low NRIP1 expression (Figure 4(b)). Group I patients had a not reached median OS, patients of groups II and III had, respectively, a median OS of 46.2 months and 10 months (Figure 4(b)).
3.3. Tumor Cells Gene Signature in GE-Based High-Risk Group. Gene set enrichment analysis was performed com-paring gene expression proiles of CLL patients with high and low GE-based risk score (� = 21 and � = 86, respectively, in the training cohort). Genes downregulated in CLL patients with mutated IgVH chain compared to unmutated (gene set: FAELT B CLL WITH VH REARRANGEMENTS DN, � = 0.001, Supplementary Figure S2 and Table S1) and genes upregulated in CLL patients expressing high levels of lipoprotein lipase (LPL) compared to patients express-ing low level of LPL (gene set: BILBAN B CLL LPL UP, � = 0.001, Supplementary Figure S2 and Table S2) were enriched in GE-based high risk group. Conversely, genes involved in chemokine signaling pathway (gene set: PID CXCR4 PATHWAY, � = 0.004, and gene set: KEGG CHEMOKINE SIGNALING PATHWAY,� = 0.04,
Supplementary Figure S3 and Supplementary Tables S3 and S4) were enriched in GE-based low-risk group.
4. Discussion
Following the introduction of microarray methodology in haematological malignancies research, many studies investi-gated the prediction of reliable prognostic patient subtypes on the basis of their speciic gene expression signatures [20,
29,30]. CLL, although initially reported as an indolent malig-nancy, is characterized by a highly heterogeneous clinical course, with many patients eventually progressing and requir-ing therapy [31]. Several large-scale gene expression-based proiling analyses in this malignancy have led to the identi-ication of prognostic factors [11,13,22] and development of prognostic signatures for patients’ risk stratiication [12,15]. We report here a new GE-based risk score in CLL specimens based on the expression levels of 20 genes documented by 22 probe sets, splitting patients of two independent cohorts into 2 risk categories. None of the 20 genes constituting the GE-based risk score overlap with the previously published prognostic gene signatures for patients’ risk stratiication [12,
15]. Interestingly, when compared using multivariate analysis, only the current GE-based risk score and NRIP1 and TCF7 expression, kept prognostic value. NRIP1 gene, known as RIP140, is a nuclear receptor coregulator with important role in energy homeostasis and a potential involvement in breast cancer [23, 32]. Several reports indicate that NRIP1 could either inhibit target gene transcription or act as a transcriptional activator. NRIP1 has been recently described as a novel cell-cycle regulated gene whose expression is directly controlled by E2F transcription factors and increases through their binding to the promoter region [33]. Few studies have analyzed the deregulation of this gene expression in haematological diseases: NRIP1 has been found to be signiicantly upregulated in acute myeloid leukemia with complex karyotypes and abnormal chromosome 21 [34]. In CLL, NRIP1 was shown to be diferentially expressed with regard to IgVH mutational status [22,35].
TCF7 is a member of a family of HMG box containing factors that are known to associate with �-catenin in the nucleus to mediate Wnt signaling [36]. he canonical Wnt/ �-catenin signaling pathway has been shown to play a role in the control of the proliferation, survival, and diferen-tiation of hematopoietic cells [37]. Recent gene expression analyses showed that several members of the Wnt family are overexpressed in CLL cells when compared to their normal counterparts from healthy donors, and this uncontrolled Wnt signaling may contribute to the defect in apoptosis that characterizes this malignancy [38]. he involvement of this pathway in the pathogenesis of several carcinomas, such as colorectal cancer and melanoma, has been also reported [39, 40]. However, there is a signiicant body of evidence showing that Wnt proteins can function as growth factors for progenitor cells of the B-cell lineage. Indeed, by analyzing the B-cell compartment using LEF1-deicient mice, Reya and colleagues showed a marked reduction of B220+ cells in the fetal liver and perinatal bone marrow caused by
● ● ● ●● ● ● ● ● ● ● ● ● ● ● ● ● ● ● ● ● ● ● ● ● ● ● ● ● ● ● ● ● ● ● −50 −40 −30 −20 −10 6.0 6.5 7.0 7.5 8.0 8.5
Maximally selected rank statistics
Cut-point: −32.3 Risk score St an da rdized log-ra nk st at istic 0 500 1000 1500 2000 0.0 0.2 0.4 0.6 0.8 1.0 P = 4.6E − 26 Group 0 N = 86 Group 1 N = 21 O verall sur vi val
Days from diagnosis
Score ≤ −32.3 Score > −32.3 Score ≤ −32.3 Score > −32.3 (a) 0 500 1000 1500 2000 2500 P = 0.002 0.0 0.2 0.4 0.6 0.8 1.0 Group 0 N = 38 Group 1 N = 6 O verall sur vi val
Days from diagnosis
Score ≤ −32.3
Score > −32.3
(b)
Figure 2: Prognostic value of GE-based risk score in CLL patients. (a) Patients of the training cohort (� = 107) were ranked according
to increasing GE-based risk score and a maximum diference in OS was obtained with a score= −32.3, splitting patients into a high risk
(19,6%) and a low risk (80,4%) groups. (b) he prognostic value of GE-based risk score was assayed on an independent cohort of 44 patients (validation cohort). he parameters to compute GE-based risk score of patients in the validation cohort and the proportions delineating the 2 prognostic groups were those deined with the training cohort.
both increased apoptosis and decreased proliferation [24]. In the same way, an abnormal B-cell development has been observed in mice knocked out for the Wnt receptor Frizzled 9 [25]. In the present study, low expression of TCF7 with high GEP risk score have been correlated with a poor survival. Mice deicient in the TCF7 gene develop intestinal and mammary adenomas, suggesting a role for TCF7 as a tumor suppressor [26]. Furthermore, TCF7 has been also reported to be expressed in hematopoietic stem cells and that its loss
diminishes hematopoietic stem/progenitor cell function [27]. hese data suggest that the role of Wnt in B-cell malignancies is controversial, as it may have potential oncogenic, as well as tumor suppressor functions. Moreover, Kienle et al. tested the ability of TCF7 gene to predict the genetic risk in CLL patients, deined by IgHV status, V3-21 usage, 11q-, and 17p-. TCF7 expression provided a high rate of correct assignment of patients at genetic risk [13]. he prognostic impact of our GE-based score associated with NRIP1 and TCF7 genes
0 500 1000 1500 2000 0.0 0.2 0.4 0.6 0.8 1.0
Days from diagnosis P = 7.9E − 09 T ime t o tr ea tmen t Group 0 N = 60 Group 1 N = 10 Score ≤ −32.3 Score > −32.3 (a) 0 2 4 6 8 10 P = 0.01
Years from diagnosis 0.0 0.2 0.4 0.6 0.8 1.0 T ime t o tr ea tmen t Group 0 N = 97 Group 1 N = 33 Score ≤ −32.3 Score > −32.3 (b) 2000 1500 1000 500 0 P = 1E − 5 Risk score 0.0 0.2 0.4 0.6 0.8 1.0 T ime t o tr ea tmen t
Days from diagnosis
Score ≤ −32.3
Score > −32.3
N = 47
N = 5
(c)
Figure 3: High GE-based risk score is associated with a shorter time to the irst treatment in CLL patients. he prognostic value of GE-based risk score was tested in two independent cohorts of CLL patients. A high GE-based risk score is associated with a shorter time to the irst
treatment in the two independent cohorts ((a)� = 70, � = 7.9� − 9 and (b) � = 130, � = 0.01) and in patients with cytogenetically deined
good prognostic ((c)� = 52, � = 1� − 5).
expression should be tested in the context of IgVH mutational status, ZAP70 protein expression and TP53 mutational status. Among the 20 genes we identiied, overexpression of ERCC1 correlated with a very poor prognosis (HR = 15.0143 and 15.6883 for 203720 s at and 203719 s at probes, resp.,
Table 1). Since many years, it has been shown that treatment
of CLL patients with alkylating agents is associated with low rates of complete remission and no improvement in OS [41]. he ability of CLL cells to eiciently repair alkylator-induced DNA damage through DNA repair genes might explain this lack of response. Indeed, ERCC1 forms with Xpf/ERCC4 an endonuclease complex that is involved in
O verall s u rv iv al 2000 2500 1500 1000 500 0
Days from diagnosis 0.0 0.2 0.4 0.6 0.8 1.0
Low GEP risk score/NRIP1low/TCF7low
Low GEP risk score/NRIP1highOR TCF7high High GEP risk score/NRIP1low/TCF7low
High GEP risk score/NRIP1highAND-OR TCF7high Low GEP risk score/NRIP1highAND TCF7high
(a) O verall s u rv iv al 2000 2500 1500 1000 500 0
Days from diagnosis 0.0 0.2 0.4 0.6 0.8 1.0
Low GEP risk score/NRIP1highOR TCF7high
Low GEP risk score/NRIP1highAND TCF7high Low GEP risk score/NRIP1low/TCF7low
High GEP risk score/NRIP1highAND-OR TCF7high
High GEP risk score/NRIP1low/TCF7low
(b)
Figure 4: Combination of the prognostic information of GE-based risk score and NRIP1 and TCF7 gene expression. (a) Kaplan-Meier analyses were performed to combine the prognostic information of GE-based risk score and NRIP1 and TCF7 gene expression. Patients were scored
from 1 to 5 according to GE-based risk score in���7high or Lowand����1high or lowgroups. (b) Ater merging consecutive groups with no
prognostic diference, 3 patient groups with diferent overall survival (OS) were obtained: I, II, and III (patients of the training cohort,� = 107).
nucleotide excision repair (NER) and in repair of drug-induced crosslinks between two complementary strands of DNA, known as interstrand crosslinking (ICL) [42]. For instance, there is evidence that increased expression of ERCC1 in CLL lymphocytes explains the development of resistance to DNA crosslinking agents, for example, nitrogen mustards [43]. In addition, Clingen et al. demonstrated that sensitivity to SJG-136, a highly eicient ICL agent that reacts with guanine bases in a 5�-GATC-3� sequence in the DNA minor groove, was dependent to some extent on ERCC1 expression in CHO cells [44]. Fludarabine could enhance the DNA ICL capacity of SJG-136 in primary human CLL cells and thereby ofer a rationale for its clinical use in combination with SJG-136 [45]. Furthermore, F11782, a novel dual catalytic inhibitor of topoisomerases I and II, known to be a potent inhibitor of NER could be of therapeutic interest in the GE-based high risk group of CLL patients [46]. More recently, it was demonstrated that a function of PARP in NER DNA repair and clinical grade PARP inhibitors in association with chemotherapy could reverse the resistance of CLL cells to DNA crosslinking agents [47].
Interestingly, GSEA analysis highlighted a signiicant enrichment of genes downregulated in CLL patients with mutated IgVH chain and genes upregulated in CLL patients expressing high levels of lipoprotein lipase in tumor cells
of patients within high risk GE-based score group (Supple-mentary Figure S2 and Supple(Supple-mentary Tables S1 and S2), in particular already known bad prognosis factors LPL, DMD, AKAP12, and SEPT10 (Supplementary Table S2) [31]. Inter-estingly, enrichment for IRF4 gene expression was identiied in the GE-based high risk group. he t(1,6)(p35.3,p25.2), exclusively found in unmutated CLL, is associated with the involvement of IRF4 (Interferon regulatory factor 4) gene. his translocation is observed with high-risk chromosomal aberrations including deletions of 11q and 17p and appears to be associated with an aggressive clinical course [48]. In CLL tumors with low GE-based risk score, GSEA analysis highlighted an enrichment of genes encoding for chemokine signaling pathways (Supplementary Figure S3 and Tables S3 and S4). Of interest, we identiied an enrichment of genes involved in the CXCR4 signaling pathway or in the interactions between the CLL tumor cells and their microen-vironment (CCL3, CCL4, and CD49d) (Supplementary Table S3). CLL cells express high levels of functional CXCR4 and signaling through this receptor reduces spontaneous and drug-induced apoptosis and also facilitates CLL cell migration beneath stromal cells [49, 50]. More recently, it was demonstrated that the tyrosine kinase inhibitor Dasa-tinib inhibits CXCR4 signaling in CLL cells and impairs their migration in response to chemokine stimulation [51]. Dasatinib may constitute a potential therapeutic approach in
Table 2: Cox univariate and multivariate analysis of OS in CLL
patient’s training cohort(� = 107).
(a)
Prognostic variable
Overall survival (� = 107)
HR � value
GEP risk score 45.39 <0.0001
ADAM29 0.40 0.04 AKAP12 2.60 0.02 DMD 3.39 0.004 LPL 4.19 0.001 NRIP1 0.12 <0.0001 SEPT10 2.95 0.01 SPG20 0.28 0.006 TCF7 0.35 <0.0001 TCL1A 4.14 0.001 TPM1 2.50 0.02 ZAP70 3.28 0.02 PS8 10.40 <0.0001 Del(17p) 10.13 <0.0001 (b) Prognostic variables
compared two by two
Overall survival (� = 107)
HR � value
GEP risk score 55.30 <0.0001
ADAM29 1.63 NS
GEP risk score 46.71 <0.0001
AKAP12 0.93 NS
GEP risk score 51.78 <0.0001
DMD 0.75 NS
GEP risk score 40.52 <0.0001
LPL 1.49 NS
GEP risk score 8.29 <0.0001
NRIP1 0.035 0.003
GEP risk score 50.95 <0.0001
SEPT10 0.76 NS
GEP risk score 53.31 <0.0001
SPG20 0.20 0.001
GEP risk score 28.34 <0.0001
TCF7 0.067 0.001
GEP risk score 40.39 <0.0001
TCL1A 2.33 NS
GEP risk score 69.60 <0.0001
TPM1 4.77 0.001
GEP risk score 44.60 <0.0001
ZAP70 1.04 NS
GEP risk score 10.35 <0.0001
PS8 4.73 0.001
(b) Continued. Prognostic variables
compared two by two
Overall survival (� = 107)
HR � value
GEP risk score 38.95 <0.0001
Del(17p) 3.14 0.02
(c)
All prognostic variables
Overall survival (� = 107)
HR � value
GEP risk score 26.23 0.002
ADAM29 1.04 NS AKAP12 6.89 NS DMD 0.58 NS LPL 0.54 NS NRIP1 0.017 0.01 SEPT10 0.58 NS SPG20 0.76 NS TCF7 0.022 0.01 TCL1A 0.29 NS TPM1 2.83 NS ZAP70 1.53 NS PS8 0.63 NS Del(17p) 1.94 NS
he prognostic factors were tested as single variable(a) or multivariables
(b, c) using Cox-model. � values and the hazard ratios (HR) are shown. NS: not signiicant at a 5% threshold.
these subgroups of CLL patients. Activated CLL cells secrete CCL3 and CCL4 for the recruitment of immune cells (T cells and monocytes) for cognate interactions. CD49d integrin (VLA-4), expressed on CLL cells, cooperates with chemokine receptors in establishing cell-to-cell adhesion with stromal cells [52]. hese data suggested that tumor CLL cells of the GE-based low risk subgroup are more dependent on the interactions with their microenvironment to support their survival and proliferation.
5. Conclusion
Given the heterogeneity of CLL patients, the current GE-based risk score combined with NRIP1 and TCF7 expression could help in identifying high-risk patients who may beneit from intensive therapeutic strategies and new-targeted treat-ments.
Conflict of Interests
he authors have no conlict of interest to declare.
Acknowledgments
his work was supported by Grants from ANR emergence (ETTMM), FEDER (141786 and 42667), ARC
(SFI20121205949), and INCa-Canceropole GSO (2012-011 et 2012-E14).
References
[1] N. Chiorazzi, K. R. Rai, and M. Ferrarini, “Chronic lymphocytic leukemia,” he New England Journal of Medicine, vol. 352, no. 8, pp. 804–815, 2005.
[2] M. Hallek, B. D. Cheson, D. Catovsky et al., “Guidelines for the diagnosis and treatment of chronic lymphocytic leukemia: a report from the International Workshop on Chronic Lym-phocytic Leukemia updating the National Cancer Institute-Working Group 1996 guidelines,” Blood, vol. 111, no. 12, pp. 5446–5456, 2008.
[3] K. Stamatopoulos, C. Belessi, C. Moreno et al., “Over 20% of patients with chronic lymphocytic leukemia carry stereotyped receptors: pathogenetic implications and clinical correlations,” Blood, vol. 109, no. 1, pp. 259–270, 2007.
[4] L. Z. Rassenti, L. Huynh, T. L. Toy et al., “ZAP-70 compared with immunoglobulin heavy-chain gene mutation status as a predictor of disease progression in chronic lymphocytic leukemia,” he New England Journal of Medicine, vol. 351, no. 9, pp. 893–901, 2004.
[5] L. Z. Rassenti, S. Jain, M. J. Keating et al., “Relative value of ZAP-70, CD38, and immunoglobulin mutation status in predicting aggressive disease in chronic lymphocytic leukemia,” Blood, vol. 112, no. 5, pp. 1923–1930, 2008.
[6] J. R. Mead, S. A. Irvine, and D. P. Ramji, “Lipoprotein lipase: structure, function, regulation, and role in disease,” Journal of Molecular Medicine, vol. 80, no. 12, pp. 753–769, 2002. [7] J. A. Orchard, R. E. Ibbotson, Z. Davis et al., “ZAP-70 expression
and prognosis in chronic lymphocytic leukaemia,” he Lancet, vol. 363, no. 9403, pp. 105–111, 2004.
[8] P. Josefsson, C. H. Geisler, H. Lefers et al., “CLLU1 expression analysis adds prognostic information to risk prediction in chronic lymphocytic leukemia,” Blood, vol. 109, no. 11, pp. 4973– 4979, 2007.
[9] M. Herling, K. A. Patel, N. Weit et al., “High TCL1 levels are a marker of B-cell receptor pathway responsiveness and adverse outcome in chronic lymphocytic leukemia,” Blood, vol. 114, no. 21, pp. 4675–4686, 2009.
[10] B. Stamatopoulos, N. Meuleman, B. Haibe-Kains et al., “microRNA-29c and microRNA-223 down-regulation has in vivo signiicance in chronic lymphocytic leukemia and improves disease risk stratiication,” Blood, vol. 113, no. 21, pp. 5237–5245, 2009.
[11] A. Zucchetto, R. Bomben, M. Dal Bo et al., “A scoring system based on the expression of six surface molecules allows the identiication of three prognostic risk groups in B-cell chronic lymphocytic leukemia,” Journal of Cellular Physiology, vol. 207, no. 2, pp. 354–363, 2006.
[12] A. Rodr´ıguez, R. Villuendas, L. Y´a˜nez, M. E. G´omez, R. D´ıaz, and M. Poll´an, “Molecular heterogeneity in chronic lymphocytic leukemia is dependent on BCR signaling: clinical correlation,” Leukemia, vol. 21, pp. 1984–1991, 2007.
[13] D. Kienle, A. Benner, C. L¨aule, D. Winkler, C. Schneider, and A. B¨uhler, “Gene expression factors as predictors of genetic risk and survival in chronic lymphocytic leukemia,” Haematologica, vol. 95, pp. 102–109, 2010.
[14] B. Stamatopoulos, N. Meuleman, C. de Bruyn et al., “A molec-ular score by quantitative PCR as a new prognostic tool at
diagnosis for chronic lymphocytic leukemia patients,” PLoS ONE, vol. 5, no. 9, Article ID e12780, pp. 1–12, 2010.
[15] T. Herold, V. Jurinovic, K. H. Metzeler et al., “An eight-gene expression signature for the prediction of survival and time to treatment in chronic lymphocytic leukemia,” Leukemia, vol. 25, no. 10, pp. 1639–1645, 2011.
[16] H.-Y. Chuang, L. Rassenti, M. Salcedo, K. Licon, A. Kohlmann, and T. Haferlach, “Subnetwork-based analysis of chronic lym-phocytic leukemia identiies pathways that associate with dis-ease progression,” Blood, vol. 120, pp. 2639–2649, 2012. [17] T. Herold, V. Jurinovic, M. Mulaw et al., “Expression analysis
of genes located in the minimally deleted regions of 13q14 and 11q22-23 in chronic lymphocytic leukemia-unexpected expression pattern of the RHO GTPase activator ARHGAP20,” Genes Chromosomes and Cancer, vol. 50, no. 7, pp. 546–558, 2011.
[18] A. Kassambara, D. Hose, J. Moreaux et al., “Genes with a spike expression are clustered in chromosome (sub) bands and spike (sub) bands have a powerful prognostic value in patients with multiple Myeloma,” Haematologica, vol. 97, no. 4, pp. 622–630, 2012.
[19] A. Subramanian, P. Tamayo, V. K. Mootha et al., “Gene set enrichment analysis: a knowledge-based approach for inter-preting genome-wide expression proiles,” Proceedings of the National Academy of Sciences of the United States of America, vol. 102, no. 43, pp. 15545–15550, 2005.
[20] C. Bret, B. Klein, and J. Moreaux, “Gene expression-based risk score in difuse large B-cell lymphoma,” Oncotarget, vol. 3, pp. 1700–1710, 2013.
[21] R. Rosenquist, D. Cortese, S. Bhoi, L. Mansouri, and R. Gun-narsson, “Prognostic markers and their clinical applicability in chronic lymphocytic leukemia: where do we stand?” Leukemia & Lymphoma, vol. 54, pp. 2351–2364, 2013.
[22] M. B. van’t Veer, A. M. Brooijmans, A. W. Langerak et al., “he predictive value of lipoprotein lipase for survival in chronic lymphocytic leukemia,” Haematologica, vol. 91, no. 1, pp. 56–63, 2006.
[23] J. Nautiyal, J. H. Steel, M. R. Mane, O. Oduwole, A. Poliandri, and X. Alexi, “he transcriptional co-factor RIP140 regulates mammary gland development by promoting the generation of key mitogenic signals,” Development, vol. 140, pp. 1079–1089, 2013.
[24] T. Reya, M. O’Riordan, R. Okamura et al., “Wnt signaling reg-ulates B lymphocyte proliferation through a LEF-1 dependent mechanism,” Immunity, vol. 13, no. 1, pp. 15–24, 2000.
[25] E. A. Ranheim, H. C. K. Kwan, T. Reya, Y.-K. Wang, I. L. Weissman, and U. Francke, “Frizzled 9 knock-out mice have abnormal B-cell development,” Blood, vol. 105, no. 6, pp. 2487– 2494, 2005.
[26] J. Roose, G. Huls, M. van Beest et al., “Synergy between tumor
suppressor APC and the�-catenin-Tcf4 target Tcf1,” Science, vol.
285, no. 5435, pp. 1923–1926, 1999.
[27] G. Huls, J. van Es, H. Clevers, G. de Haan, and R. van Os, “Loss of Tcf7 diminishes hematopoietic stem/progenitor cell function,” Leukemia, vol. 7, pp. 1613–1614, 2013.
[28] T. Zenz, A. Kr¨ober, K. Scherer et al., “Monoallelic TP53 inacti-vation is associated with poor prognosis in chronic lymphocytic leukemia: results from a detailed genetic characterization with long-term follow-up,” Blood, vol. 112, no. 8, pp. 3322–3329, 2008. [29] E. Bou Samra, B. Klein, T. Commes, and J. Moreaux, “Devel-opment of gene expression-based risk score in cytogenetically
normal acute myeloid leukemia patients,” Oncotarget, vol. 3, pp. 824–832, 2012.
[30] J. Moreaux, B. Klein, R. Bataille et al., “A high-risk signature for patients with multiple myeloma established from the molecular classiication of human myeloma cell lines,” Haematologica, vol. 96, no. 4, pp. 574–582, 2011.
[31] M. Sevov, R. Rosenquist, and L. Mansouri, “RNA-based markers as prognostic factors in chronic lymphocytic leukemia,” Expert Review of Hematology, vol. 5, no. 1, pp. 69–79, 2012.
[32] A. Docquier, P.-O. Harmand, S. Fritsch, M. Chanrion, J.-M. Darbon, and V. Cavaill`es, “he transcriptional coregulator RIP140 represses E2F1 activity and discriminates breast cancer subtypes,” Clinical Cancer Research, vol. 16, no. 11, pp. 2959– 2970, 2010.
[33] A. Docquier, P. Augereau, M. Lapierre, P.-O. Harmand, E. Badia, and J.-S. Annicotte, “he RIP140 gene is a transcriptional target of E2F1,” PLoS ONE, vol. 7, Article ID e35839, 2012.
[34] C. D. Baldus, S. Liyanarachchi, K. Mr´ozek et al., “Acute myeloid leukemia with complex karyotypes and abnormal chromosome 21: ampliication discloses overexpression of APP, ETS2, and ERG genes,” Proceedings of the National Academy of Sciences of the United States of America, vol. 101, no. 11, pp. 3915–3920, 2004. [35] C. Haslinger, N. Schweifer, S. Stilgenbauer et al., “Microar-ray gene expression proiling of B-cell chronic lymphocytic leukemia subgroups deined by genomic aberrations and VH mutation status,” Journal of Clinical Oncology, vol. 22, no. 19, pp. 3937–3949, 2004.
[36] J. Q. Wu, M. Seay, V. P. Schulz et al., “Tcf7 is an important regulator of the switch of self-renewal and diferentiation in a multipotential hematopoietic cell line,” PLoS Genetics, vol. 8, no. 3, Article ID e1002565, 2012.
[37] C. Y. Logan and R. Nusse, “he Wnt signaling pathway in devel-opment and disease,” Annual Review of Cell and Develdevel-opmental Biology, vol. 20, pp. 781–810, 2004.
[38] D. Lu, Y. Zhao, R. Tawatao et al., “Activation of the Wnt signaling pathway in chronic lymphocytic leukemia,” Proceedings of the National Academy of Sciences of the United States of America, vol. 101, no. 9, pp. 3118–3123, 2004.
[39] P. F. S. Etet, L. Vecchio, and A. H. Nwabo Kamdje, “Interac-tions between bone marrow stromal microenvironment and B-chronic lymphocytic leukemia cells: any role for Notch, Wnt and Hh signaling pathways?” Cellular Signalling, vol. 24, no. 7, pp. 1433–1443, 2012.
[40] X. Ge and X. Wang, “Role of Wnt canonical pathway in hema-tological malignancies,” Journal of Hematology & Oncology, vol. 3, no. 33, 2010.
[41] B. L. Abbott, “Chronic lymphocytic leukemia: recent advances in diagnosis and treatment,” he Oncologist, vol. 11, no. 1, pp. 21– 30, 2006.
[42] G. Weeda, I. Donker, J. de Wit et al., “Disruption of mouse ERCC1 results in a novel repair syndrome with growth failure, nuclear abnormalities and senescence,” Current Biology, vol. 7, no. 6, pp. 427–439, 1997.
[43] R. Geleziunas, A. McQuillan, A. Malapetsa et al., “Increased DNA synthesis and repair-enzyme expression in lymphocytes from patients with chronic lymphocytic leukemia resistant to nitrogen mustard,” Journal of the National Cancer Institute, vol. 83, no. 8, pp. 557–564, 1991.
[44] P. H. Clingen, I. U. de Silva, P. J. McHugh et al., “he XPF-ERCC1 endonuclease and homologous recombination contribute to the repair of minor groove DNA interstrand crosslinks in mam-malian cells produced by the pyrrolo[2,1-c][1,4]benzodiazepine
dimer SJG-136,” Nucleic Acids Research, vol. 33, no. 10, pp. 3283– 3291, 2005.
[45] C. Pepper, H. Lowe, C. Fegan et al., “Fludarabine-mediated suppression of the excision repair enzyme ERCC1 contributes to the cytotoxic synergy with the DNA minor groove crosslinking agent SJG-136 (NSC 694501) in chronic lymphocytic leukaemia cells,” British Journal of Cancer, vol. 97, no. 2, pp. 253–259, 2007. [46] J. M. Barret, M. Cadou, and B. T. Hill, “Inhibition of nucleotide excision repair and sensitisation of cells to DNA cross-linking anticancer drugs by F 11782, a novel luorinated epipodophyl-loid,” Biochemical Pharmacology, vol. 63, no. 2, pp. 251–258, 2002.
[47] B. S. King, K. L. Cooper, K. J. Liu, and L. G. Hudson, “Poly(ADP-ribose) contributes to an association between poly(ADP-“Poly(ADP-ribose) polymerase-1 and xeroderma pigmentosum complementation group A in nucleotide excision repair,” he Journal of Biological Chemistry, vol. 287, pp. 39824–39833, 2012.
[48] L. Michaux, I. Wlodarska, K. Rack et al., “Translocation t(1;6)(p35.3;p25.2): a new recurrent aberration in “unmutated” B-CLL,” Leukemia, vol. 19, no. 1, pp. 77–82, 2005.
[49] J. A. Burger, M. Burger, and T. J. Kipps, “Chronic lymphocytic leukemia B cells express functional CXCR4 chemokine recep-tors that mediate spontaneous migration beneath bone marrow stromal cells,” Blood, vol. 94, no. 11, pp. 3658–3667, 1999. [50] J. A. Burger, N. Tsukada, M. Burger, N. J. Zvailer, M. Dell’Aquila,
and T. J. Kipps, “Blood-derived nurse-like cells protect chronic lymphocytic leukemia B cells from spontaneous apoptosis through stromal cell-derived factor-1,” Blood, vol. 96, no. 8, pp. 2655–2663, 2000.
[51] A. M. McCaig, E. Cosimo, M. T. Leach, and A. M. Michie, “Dasatinib inhibits CXCR4 signaling in chronic lymphocytic leukaemia cells and impairs migration towards CXCL12,” PLoS ONE, vol. 7, Article ID e48929, 2012.
[52] M. Sivina, E. Hartmann, T. J. Kipps et al., “CCL3 (MIP-1�)
plasma levels and the risk for disease progression in chronic lymphocytic leukemia,” Blood, vol. 117, no. 5, pp. 1662–1669, 2011.
Submit your manuscripts at
http://www.hindawi.com
Stem Cells
International
Hindawi Publishing Corporationhttp://www.hindawi.com Volume 2014
Hindawi Publishing Corporation
http://www.hindawi.com Volume 2014
INFLAMMATION
Hindawi Publishing Corporation
http://www.hindawi.com Volume 2014
Behavioural
Neurology
Endocrinology
International Journal of Hindawi Publishing Corporationhttp://www.hindawi.com Volume 2014
Hindawi Publishing Corporation
http://www.hindawi.com Volume 2014
Disease Markers
Hindawi Publishing Corporation
http://www.hindawi.com Volume 2014
BioMed
Research International
Oncology
Journal ofHindawi Publishing Corporation
http://www.hindawi.com Volume 2014
Hindawi Publishing Corporation
http://www.hindawi.com Volume 2014
Oxidative Medicine and Cellular Longevity
Hindawi Publishing Corporation
http://www.hindawi.com Volume 2014
PPAR Research
The Scientiic
World Journal
Hindawi Publishing Corporation
http://www.hindawi.com Volume 2014
Immunology Research
Hindawi Publishing Corporation
http://www.hindawi.com Volume 2014
Journal of
Obesity
Journal ofHindawi Publishing Corporation
http://www.hindawi.com Volume 2014
Hindawi Publishing Corporation
http://www.hindawi.com Volume 2014
Computational and Mathematical Methods in Medicine
Ophthalmology
Journal ofHindawi Publishing Corporation
http://www.hindawi.com Volume 2014
Diabetes Research
Journal ofHindawi Publishing Corporation
http://www.hindawi.com Volume 2014
Hindawi Publishing Corporation
http://www.hindawi.com Volume 2014 Research and Treatment
AIDS
Hindawi Publishing Corporation
http://www.hindawi.com Volume 2014
Gastroenterology Research and Practice
Hindawi Publishing Corporation
http://www.hindawi.com Volume 2014