ABSTRACT: The influence of grass-only diets either from rye-grass-dominated lowland pastures (400 m above sea level) or botanically diverse alpine pastures (2000 m) on the FA profile of milk was investigated using three groups of six Brown Swiss cows each. Two groups were fed grass-only on pasture (P) or freshly harvested in barn (B), both for two experimental periods in the lowlands and, consecutively, two periods on the alp. Group C served as the control, receiving a silage-concentrate diet and per-manently staying in the lowlands. Effects of vegetation stage or pasture vs. barn feeding on milk fat composition were negligible. Compared with the control, α-linolenic acid (18:3n-3) consump-tion was elevated in groups P and B (79%; P < 0.001) during the lowland periods but decreased on the alp to the level of C owing to feed intake depression and lower 18:3n-3 concentration in the alpine forage. Average 18:3n-3 contents of milk fat were higher in groups P and B than in C by 33% (P < 0.01) at low and by 96% (P < 0.001) at high altitude, indicating that 18:3n-3 levels in milk were to some extent independent of 18:3n-3 consumption. The cis-9,trans-11 CLA content in milk of grass-fed cows was higher compared with C but lower for the alpine vs. lowland periods whereas the trans-11,cis-13 isomer further increased with alti-tude. Long-chain n-3 FA and phytanic acid increased while ara-chidonic acid decreased with grass-only feeding, but none of them responded to altitude. Grass-only feeding increased milk α-tocopherol concentration by 86 and 134% at low and high alti-tude (P < 0.001), respectively. Changes in the ruminal ecosystem due to energy shortage or specific secondary plant metabolites are discussed as possible causes for the high 18:3n-3 concentra-tions in alpine milk.
Paper no. L9566 in Lipids 40, 191–202 (February 2005).
Recently, elevated contents of beneficial functional FA in cows’ milk and cheese derived from alpine grazing systems were reported (1–4). Increased contents of n-3 PUFA and an improved ratio of n-3 to n-6 PUFA in milk of cows grazing on alpine pastures were shown (3,5). It was even hypothesized that a relation between high levels of α-linolenic acid (18:3n-3) in
alpine cheese and a favorable cardiovascular health status of the alpine population may exist (4). Generally, n-3 PUFA are known to be essential for human health, and problems may arise if they are consumed in too low a proportion relative to n-6 FA (6). Furthermore, the content of CLA (18:2 cis-9,trans-11 isomer), a FA that also has shown potential to benefit human health (7), was found to be clearly enriched in milk (3) or cheese (1,2) from alpine production systems compared with those from intensive lowland production. Additionally, the pro-portion of short- and medium-chain saturated FA (SFA), which are supposed to increase the risk of cardiovascular diseases (8), was found to be markedly lower in milk and milk products originating from cows grazing high alpine pastures (2,4,5).
Milk fat derived from cows grazing high alpine pastures therefore seems to have a considerably higher dietetic value than conventional milk, but the reasons for these differences are still unclear. To our knowledge, in previous studies the in-dividual factors of the alpine sojourn of cows potentially af-fecting milk fat composition were never differentiated, and diets fed in the lowlands for control were either not specified or not restricted to herbage-only, as is usual practice in Swiss alpine dairy systems. Known mechanisms influencing the FA profile in lowland milk are (i) the basic effect of grazing and the related body fat mobilization (9,10) as well as influences of the herbage’s botanical composition (10,11), (ii) the degree of usage of concentrates, in particular wheat, barley, and maize in the diets, which mainly contribute SFA, 18:1, and 18:2n-6 but very little 18:3n-3 (10,12,13), and (iii) the effect of herbage conservation (13–15). These factors could also contribute to the differences in composition between common lowland milk and milk from alpine pastures. It is, however, still unclear whether, in addition, specific plants (16), the 18:3n-3 content of the alpine flora (3,17) and even the hypoxic environment per
se (4) are responsible for the typically high contents of CLA
and n-3 PUFA of alpine milk products. Otherwise, the “alpine paradox” (4) would actually be a general phenomenon of feed-ing grass at any altitude and mainly reflect the difference from mixed, often maize-based, diet types. The objective of the pre-sent study was to determine experimentally the factors respon-sible for the composition of milk fat of cows consuming grass at high altitude. Comparisons included grass-only vs. mixed diets in the lowland, high altitude vs. lowland grazing of the cows, pasture vs. indoor feeding, and young vs. mature swards.
*To whom correspondence should be addressed at Institute of Animal Sci-ence, ETH Zurich, ETH-Zentrum/LFW B56, CH-8092 Zurich, Switzerland. E-mail: [email protected]
Abbreviations: 18:3n-3, α-linolenic acid; B, barn group; BHB, β-hydroxy-butyrate; C, control group; CRC, controlled release alkane capsules; DM, dry matter; LS, least squares; NEFA, nonesterified FA; P, pasture group; SFA, saturated FA.
A Study on the Causes for the Elevated n-3 Fatty Acids
in Cows’ Milk of Alpine Origin
Florian Leiber, Michael Kreuzer*, Daniel Nigg, Hans-Rudolf Wettstein, and Martin Richard Leo Scheeder
EXPERIMENTAL PROCEDURES
Animals. Eighteen Brown Swiss cows, having been 94 (65 to
127) d into their second lactation at the beginning of the exper-iment, were blocked by calving date and allocated to three groups (P, pasture group; B, barn-fed group; C, control group) with minimal between-group variance for energy-corrected milk yield, milk protein, and milk fat percentage. Average milk yield, at the start of the experiment, was 21.7, 22.2, and 22.3 kg/d for groups P, B, and C, respectively. The corresponding average contents per kilogram of milk were 43.6, 42.0, and 41.4 g fat; 30.3, 31.1, and 31.8 g protein; and 50.6, 50.4, and 49.1 g lactose, respectively.
Experimental schedule. Six subperiods (S0 to S5) were
de-fined. Each subperiod lasted for 21 d, and intensive sampling was always done during the respective third week. All data and data points in the figures refer to the average values of these in-tensive sampling weeks within each subperiod. The first part of the experiment took place at the ETH research station Chamau in central Switzerland at 400 m above sea level. Dur-ing the baseline subperiod (S0) all cows were tethered in a barn and fed a mixed control diet. During the “lowland period,” comprising the two subperiods S1 and S2, group P was turned out to pasture for 24 h/d, while groups B and C remained in the barn. Group B was fed only freshly harvested grass ad libitum, and group C remained on the control diet. After S2, all cows were kept in the barn again until the alpine vegetation was ready for grazing and harvest. During this time, groups P and B stayed on the grass-only diet at ad libitum access. At the end of this transition period, which lasted for 28 d, just before and after the transport to the alpine location, additional milk sam-ples were taken. These samsam-ples provided the additional data points in Figures 3 to 6. For the “alpine period,” Groups P and B were transported to the alpine ETH research station Alp Weissenstein located at 2000 m above sea level in the Eastern Swiss alps. Half of the group P and B cows were switched to the respective other group in order to counterbalance possible residual effects of the previous treatment. This balanced re-arrangement of groups P and B is indicated in the figures by the dotted line. Group C remained in the lowlands and contin-ued to serve as control group. Like the lowland period, the alpine period consisted of two subperiods (S3 and S4). S5 as a final baseline evaluation was carried out with all cows kept in the lowland barn again and fed the control diet.
During the intensive sampling weeks, milk yield was recorded and proportionate milk samples of each cow and each milking were obtained. The samples were frozen at −20°C immediately after sampling. Cows were weighed and blood samples were taken at days 2 and 6 within each sampling week. Two feed samples were drawn every day in each group during the sampling weeks of the subperiods. An aliquot of each feed sample was dried at 60°C for 48 h, and a second was frozen at −20°. Feces were sampled once a day from each ani-mal and frozen. Later, all samples were defrosted, pooled per sampling week (feed) or per animal and sampling week (feces), and then dried and ground through a 0.75-mm sieve for
analy-sis. Feed intake was measured daily for cows kept in barn. On pasture, feed samples were obtained mimicking the selection behavior of the cows for at least 3 h distributed over the whole daytime, and feed intake was calculated using the double-alkane technique (18). As the source for the synthetic marker alkanes (C32 and C36), controlled release alkane capsules (CRC; Captec, Auckland, New Zealand) were introduced into the rumen of the cows 8 d prior to each sampling week. Odd-chain alkanes (C31and C33) in feed were used as internal mark-ers. The actual alkane recovery rates in feces were determined with the known feed intake of the group B cows that had also received CRC.
Diets. S1 started at the earliest possible vegetation stage of
the first growth; S2 followed 3 wk later on a now more mature sward. The same principle was followed for S3 and S4 at the alpine location. The lowland areas were intensively managed leys with regular manure fertilization. The alpine pasture was native and not fertilized. The botanical composition was visu-ally estimated in the standing sward within each sampling week in eight systematically distributed 9-m2plots (four per pasture and harvest paddock, respectively) according to the method of Braun-Blanquet (19). The main species characteristics of the experimental sites are shown in Table 1. The analyzed nutrient and FA composition of the experimental feeds is listed in Table 2. Data for individual vegetation stages are not displayed since vegetation stage effects on milk fat composition were found to be not significant.
Herbage for group B was harvested daily in the early morn-ing from paddocks adjoinmorn-ing those grazed by group P cows; the two were similar in botanical composition. It was then kept tightly packed to avoid any possible losses of FA by wilting of the forage (15). The control diet contained hay, ryegrass silage, and maize silage in proportions of 0.1:0.6:0.3 on a dry-matter (DM) basis, was provided ad libitum, and was supplemented by concentrates according to milk yield. The two commercial concentrates used contained rumen-protected fat (Table 2), which made up 410 g/kg of total dietary FA in the control diet. The cows of all groups had ad libitum access to NaCl and a nonvitaminized mineral mix (Ca:P = 2:1; Nährkosan, Büron, Switzerland) during the whole experiment.
Analysis. Frozen milk samples were defrosted and pooled
per cow and sampling week. After direct transesterification, ac-cording to Suter et al. (20), the FAME were extracted with n-heptane and then separated and quantified with GC using a Sil 88 column (100 m × 0.25 mm, 0.2 µm; Varian Inc, Darmstadt, Germany) on an HP 6890 (Hewlett-Packard, Wilmington, DE). Hydrogen flow was 1.5 mL/min; 0.5 mL of n-heptane contain-ing the FAME was injected on column. The temperature pro-gram was: 60°C for 5 min; increase by 14°C/min up to 165°C; 2°C/min up to 225°C; isothermal for another 15 min. Tempera-ture program and peak identification were adapted from Col-lomb and Bühler (21) with some modifications. The peaks for 16:1trans and 20:1trans may contain some branched-chain FA (22). They were therefore only included in the calculation of total FAME and not separately shown in the tables. The applied chromatographic method also is not able to separate
trans-8,cis-10 and trans-7,cis-9 from the major cis-9,trans-11 CLA-isomer as well as trans-11,cis-13 from cis-9,cis-11 (3,23). However, the concentration of the trans-7,cis-9 isomer has been described to be about 100-fold lower than the cis-9,trans-11 isomer in milk, and changes due to (alpine) feeding occurred on a rather low level (3,24). Proportions of and effects on trans-8,cis-10 are even lower than for trans-7,cis-9 (24). Thus, we conclude that any distortion of the effect on the cis-9,trans-11 isomer is small, although it might be slightly biased because both of these minor isomers are likely to increase with altitude of the site where the dairy cows are kept (24). Similarly, the
cis-9,cis-11 isomer, coeluting with the trans-11,cis-13 isomer,
seems to be present only in traces if at all (24; Collomb, M., personal communication); we therefore refer to this peak as
trans-11,cis-13. Response factors were determined using BCR
164 standard milk fat (Certified Reference Material; EC Refer-ence Materials, Brussels, Belgium) as a referRefer-ence. The milk fat content measured with a standard NIR procedure (Milkoscan 4000; Foss, Höganäs, Sweden) closely correlated with the amount of total FAME obtained with GC (r2= 0.93). Phytanic acid (3,7,11,15-tetramethylhexadecanoic acid) was separated and quantified in the milk samples of S2 and S3 and in the sam-ples drawn directly before and after transfer to the alp, using an
RTX225 column (30 m × 0.32 mm, 0.5 µm; Restek Corpora-tion, Bellefonte, PA). Injection volume was 1 µL in a 30:1 split modus at 240°C. Hydrogen flow was 4.0 mL/min. The temper-ature program was 140°C for 2 min, ramp 5°C/min up to 215°C, isothermal for 5 min.
Lipids from feeds were extracted by accelerated solvent ex-traction (ASE 200; Dionex Corp., Sunnyvale CA) using hexane/isopropanol (2:1 vol/vol) and transformed into FAME according to Wettstein et al. (25). FAME were dissolved in hexane and analyzed with GC on a Supelcowax™-10 column (30 m × 0.32 mm, 0.25 µm; Supelco Inc., Bellefonte, PA) after split injection (1:30) at 270°C. The injection volume was 2 µL; hydrogen flow was 2.2 mL/min. The temperature program was 160°C for 1 min, ramp 20°C/min up to 190°C, ramp 7°C/min up to 230°C; isotherm at 230°C for 4 min, ramp 20°C/min up to 250°C, isotherm for 4 min.
Tocopherols in milk were analyzed after saponification with KOH with normal-phase HPLC on a Merck-Hitachi system with UV detection (La Chrom; Darmstadt, Germany) accord-ing to Rettenmaier and Schüepp (26). The β-, γ-, and δ-tocoph-erols were always below the detection limit.
Feed contents of DM and nitrogen (N × 6.25 = crude pro-tein) were analyzed with standard methods as described
previ-TABLE 1
Frequent Plant Species in the Lowland and the Alpine Pastures Used in the Experiment
Estimated proportions of total ground coveringa
>10% 4–10% 1–4%
Lowland site (16 plots) Monocotyledonae (77%)
Total species found: 9 Lolium multiflorum, Poa trivialis, Poa annua Festuca pratense, Poa pratense Lolium perenne
Leguminosae (6%)
Total species found: 2 Trifolium repens Trifolium pratense
Dicotyledonae (except Leguminosae) (16%)
Total species found: 8 Taraxacum officinale Rumex obtusifolius,
Ranunculus repens, Bellis perennis
Alpine site (16 plots) Monocotyledonae (36%)
Total species found: 14 Festuca rubra Trisetum flavescens, Phleum Poa trivialis, Nardus alpinum, Poa alpina, Festuca stricta, Poa pratense pratense
Leguminosae (23%)
Total species found: 11 Trifolium pratense Trifolium montanum Trifolium repens, Trifolium badii, Lotus spp.,
Trifolium nivale
Dicotyledonae (except Leguminosae) (40%)
Total species found: 46 Rumex arifolius, Alchemilla Peucedaneum osthrutium,
vulgaris, Taraxacum officinale Ranunculus montanus, Ranunculus acer, Achillea stricta, Carum carvi, Chaero phyllum cicutaria, Campanula scheuchzeri, Crepis aurea, Veronica chamaedrys, Plantago alpina, Leontodon hispidus
ously (27). Contents of net energy for lactation were calculated based on the equations used in the official Swiss feed evalua-tion (28). Plasma metabolites and insulin were analyzed with standard assays. Plasma insulin was measured with a radioim-munoassay kit (No. 1064 1401; Pharmacia, Uppsala, Sweden). Plasma concentrations of nonesterified FA (NEFA), β-hydrox-ybutyrate (BHB), glucose, and urea were analyzed on a COBAS-MIRA chemistry analyzer (Roche, Basel, Switzer-land), with the following assays: NEFA with NEFA-C WA 994-75409 (Wako, Neuss, Germany), BHB with product 310-A (Sigma, Buchs, Switzerland), glucose with assay No. 1447513 and urea with assay No. 1489364 (both Roche).
Statistics. Data were evaluated with three mixed models by
SAS V8.2e (PROC MIXED; SAS Institute, Cary, NC;). Model 1 included group (P, B, or C) and calving date (classified in three blocks of similar calving date) as fixed factors. Animal was included as random effect, and the individual baseline (S0) values were used as a covariate. The least squares (LS) means and all significances of the group × period interaction, shown in Tables 3 and 4, are based on model 1. The same model, but without the covariate S0, was used to obtain LS means of all subperiods (including S0) for the illustration in the figures. A third model was applied for the calculation of the altitude and the vegetation stage effects, considering vegetation stage (two classes: young or mature) and main period (lowland or alps) as additional fixed effects. Group C, for which feed and altitude remained unchanged, was excluded from the calculations with model 3.
RESULTS
Feed intake and metabolic energy supply. During the lowland
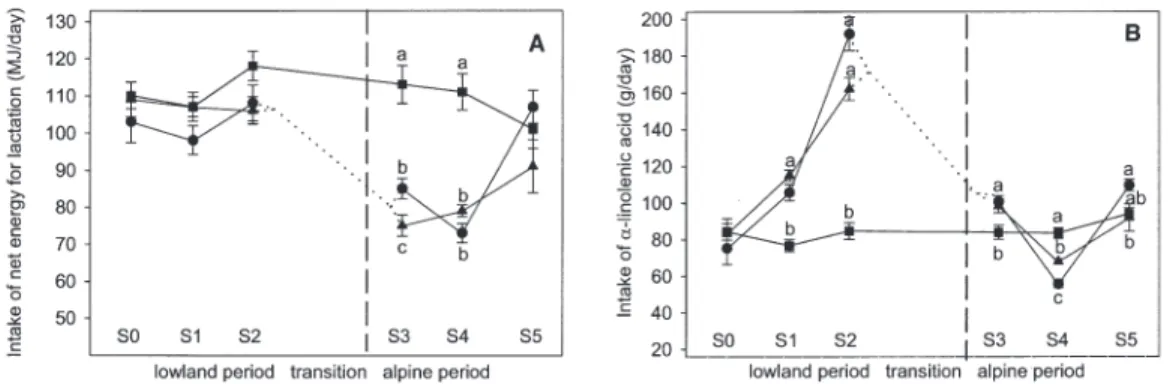
period, the DM intake of the grass-only fed cows was lower than in cows of group C [significantly for group P (P < 0.05) and as a tendency for group B (P < 0.1); Table 3]. Nevertheless, the calculated net energy intake of B and P cows did not differ significantly from C cows during the lowland period (Fig. 1A), and milk yield decreased only slightly (Fig. 2B). However, un-like C cows, P and B cows lost weight from S0 to S1 (P < 0.05; Fig. 2A), and all blood plasma metabolites indicated a certain catabolic state (Table 3). In the alpine period (S3 and S4), DM intake in groups P and B decreased (P < 0.001) compared with the lowland period and with C cows, and net energy intake was reduced by approximately one-third (P < 0.01). Accordingly, milk yield markedly decreased when cows were transferred to the alpine location (P < 0.001; Fig. 2). Although body weight did not further decline, plasma levels of BHB (P < 0.001) and NEFA (P < 0.001) still increased and plasma glucose (P < 0.05) and insulin (P < 0.001) further decreased during the alpine sojourn of the cows (Table 3).
FA intake. In S1 and S2, individual FA consumption of the
grass-only fed cows differed from that of the C cows (Table 3) since lowland grass had clearly higher levels of 18:3n-3 but much lower levels of SFA, monounsaturated FA, and 18:2n-6 than the control diet (cf. Table 2). Thus, 18:3n-3 was the main dietary FA for groups P and B, whereas for group C, 16:0 and
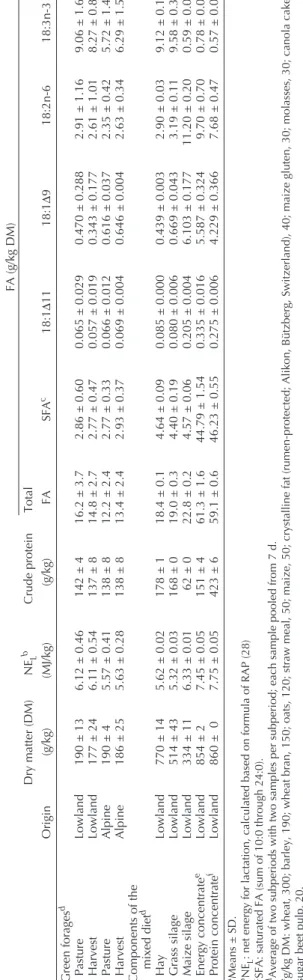
TABLE 2 Nutrient and FA Contents of Feeds Used in the Experim ent a FA (g/kg DM) Dry matter (DM) NE L b Crude protein Total Origin (g/kg) (MJ/kg) (g/kg) FA SFA c 18:1 ∆ 11 18:1 ∆ 9 18:2n-6 18:3n-3 Green forages d Pasture Lowland 190 ± 13 6.12 ± 0.46 142 ± 4 16.2 ± 3.7 2.86 ± 0.60 0.065 ± 0.029 0.470 ± 0.288 2.91 ± 1.16 9.06 ± 1.61 Harvest Lowland 177 ± 24 6.11 ± 0.54 137 ± 8 14.8 ± 2.7 2.77 ± 0.47 0.057 ± 0.019 0.343 ± 0.177 2.61 ± 1.01 8.27 ± 0.87 Pasture Alpine 190 ± 4 5.57 ± 0.41 138 ± 8 12.2 ± 2.4 2.77 ± 0.33 0.066 ± 0.012 0.616 ± 0.037 2.35 ± 0.42 5.72 ± 1.45 Harvest Alpine 186 ± 25 5.63 ± 0.28 138 ± 8 13.4 ± 2.4 2.93 ± 0.37 0.069 ± 0.004 0.646 ± 0.004 2.63 ± 0.34 6.29 ± 1.50 Components of the mixed diet d Hay Lowland 770 ± 14 5.62 ± 0.02 178 ± 1 18.4 ± 0.1 4.64 ± 0.09 0.085 ± 0.000 0.439 ± 0.003 2.90 ± 0.03 9.12 ± 0.19 Grass silage Lowland 514 ± 43 5.32 ± 0.03 168 ± 0 19.0 ± 0.3 4.40 ± 0.19 0.080 ± 0.006 0.669 ± 0.043 3.19 ± 0.11 9.58 ± 0.33 Maize silage Lowland 334 ± 11 6.33 ± 0.01 62 ± 0 22.8 ± 0.2 4.57 ± 0.06 0.205 ± 0.004 6.103 ± 0.177 11.20 ± 0.20 0.59 ± 0.01 Energy concentrate e Lowland 854 ± 2 7.45 ± 0.05 151 ± 4 61.3 ± 1.6 44.79 ± 1.54 0.335 ± 0.016 5.587 ± 0.324 9.70 ± 0.70 0.78 ± 0.02 Protein concentrate f Lowland 860 ± 0 7.75 ± 0.05 423 ± 6 59.1 ± 0.6 46.23 ± 0.55 0.275 ± 0.006 4.229 ± 0.366 7.68 ± 0.47 0.57 ± 0.09 aMeans ± SD. bNE L : net energy for lactation, calculated based on formu la of RAP (28) cSFA: saturated FA (sum of 10:0 through 24:0). dAverage of two subperiods with two samples per sub period; each sample pooled from 7 d. eg/kg DM: wheat, 300; barley, 190; wheat bran, 150 ; oats, 120; straw meal, 50; maize, 50; crystalline fat (rum en-protected; Alikon, Bützberg, Switzerland), 40; maize gluten, 30; molasses, 30; canola cake, 20; sugar beet pulp, 20. fg/kg DM: soybean meal, 480; maize gluten, 220; str aw meal, 60; maize, 50; wheat, 40; crystalline fat, 40; su gar beet pulp, 40; molasses, 30; wheat bran, 10.
18:0, originating from the concentrates, and 18:1 and 18:2n-6, coming from both the concentrates and the maize silage, were the major dietary FA. In the alpine period, the total FA content of the herbage tended to be lower (P < 0.1; t-test) than during the lowland period (Table 2). Additionally, the 18:3n-3 propor-tion of total FA in the herbage declined (P < 0.01; t-test). This resulted in a reduced intake of total FA and 18:3n-3 by 23 and 43%, respectively, in the alpine compared with the lowland pe-riod for both P and B (P < 0.001; Table 3 and Fig. 1B).
Fat content and saturated FA in milk. The fat content in milk
was not affected by the grass-only diets in the lowlands but (with concomitantly decreased milk yields) it increased in group P (P < 0.001) and in group B (P < 0.1) after transport to the alps. With the start of grass feeding in S1, the proportion of the even-chain SFA 6:0 through 14:0 in total milk FAME of groups P and B initially increased (P < 0.001). From subperiod S2 on, there was an almost linear decrease in the proportions of these FA in total FAME and in the milk of the P and B cows, with the values finally decreasing below the levels of control group (representatively shown for 10:0 and 12:0 in Fig. 3). Fig-ure 3 illustrates that this was a continuous decline that, to a con-siderable extent, had already taken place before the transfer to the alpine site. In S5, the concentration of 6:0 through 14:0 re-turned to the baseline values represented by the C cows. Dur-ing the lowland period, a decrease in the proportion of 16:0 as part of the total FAME occurred with the herbage-only diets (P cows: P < 0.01; B cows: P < 0.05) compared with the control diet (C), whereas 17:0 moderately increased (P < 0.05 for both groups) and the proportion of 18:0 remained unaffected. With
the alpine sojourn of P and B groups, the 18:0 proportion of total FAME significantly increased whereas those of 16:0 and 17:0 were not affected by the location.
18:1 FA in milk.Among the identified 18:1 trans isomers, the
18:1trans-10/trans-11 proportions of total FAME increased (P < 0.001) with lowland grass-only diets by more than 3.3-fold, whereas the 18:1trans-4-trans-9 isomers were moderately re-duced, particularly in group B (P < 0.01), compared with C cows (Table 4). During the alpine period, compared with the lowland values in groups P and B, the double-peak comprising 18:1trans-11 (trans-vaccenic acid) clearly decreased, whereas the concen-tration of the 18:1trans-4 to trans-9 in total FAME significantly increased. The proportion of 18:1cis-9, as the dominating 18:1, remained unaffected by the grass-only diets in the lowlands but was elevated at high altitude by 32% (P < 0.001) compared with the lowland values in P and B cows.
CLA in milk. All identified CLA isomers increased markedly
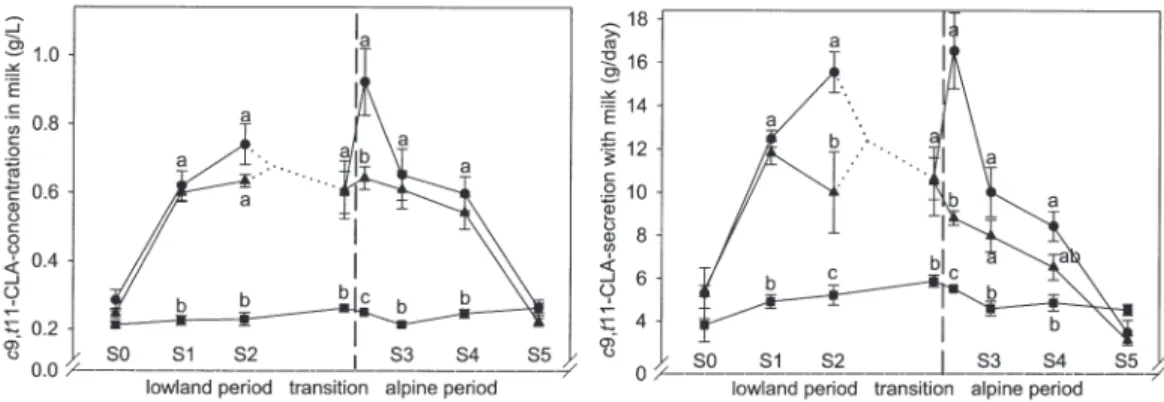
as a proportion of the total FAME when grass-only diets were fed in groups P and B (P < 0.001; Table 4). Accordingly, during the lowland periods, the proportion of the main isomer, 18:2 cis-9,trans-11, was on average 1.9-fold higher in milk fat of P and B cows than in the milk of C cows. From S0 to S1, CLA increased in both P and B cows (P < 0.001); from S1 to S2 a further in-crease occurred only in P cows (P < 0.05). This was the reason for the significant difference between P and B cows in the low-land period (P < 0.01; Table 4, Fig. 4). During the alpine sojourn, the concentration of the main CLA isomer, 18:2 cis-9,trans-11, in total FAME decreased (P < 0.01), whereas the 18:2 trans-11,cis-13 isomer significantly increased in the P and B groups
TABLE 3
Daily Intake and Metabolic Traits of Cows During the Experimental Periodsa
Lowland period Alpine period
(avg. of S1 and S2) (avg. of S3 and S4) Significances
Group Control Barn Pasture Control Barn Pasture SEb Groupc Period (altitude)d Group × periodc Intake
(per cow per day)e,f
DM (kg) 18.2a 16.9a,b 16.4b 18.3a 13.8c 13.7c 0.52 <0.001 <0.001 <0.01 FA (g) Total FA 597 238* 254* 580 169* 161* 19.3 <0.001 <0.001 NSh Saturated FA 342.9 45.5* 46.5* 325.3 38.2* 37.5* 14.70 <0.001 <0.001 NS 18:1∆9 56.3 5.74* 8.05* 54.9 8.54* 8.34* 1.695 <0.001 <0.01 NS 18:1∆11 3.26 0.97* 1.11* 3.17 0.93* 0.93* 0.112 <0.001 <0.05 NS 18:2n-6 114.0 44.4* 49.0* 112.3 34.7* 32.9* 3.37 <0.001 <0.001 NS 18:3n-3 80.4b 138.2a 148.5a 83.3b 82.8b 79.8b 5.53 <0.001 <0.001 <0.001 Blood plasma concentrationse,f BHBg(mmol/L) 477d 667c 638c,d 510c,d 921b 1119a 35.0 <0.001 <0.001 <0.01 NEFAg(mmol/L) 93c 64c 137b 60c 94c 203a 18.0 <0.001 <0.05 <0.05 Glucose (mmol/L) 3.23 3.20 3.02* 3.19 2.92* 2.92* 0.057 <0.05 <0.01 NS Insulin (pmol/L) 71.2 55.0* 37.1* 66.9 30.2* 24.1* 3.99 <0.001 <0.001 NS
an = 12 per group and period. bStandard error of groups. cEvaluated by model 1.
dEvaluated by model 3 (without control).
eSuperscript roman letters a–d indicate significant differences (P < 0.05) between group × period interaction means according to model 1. fValues marked with asterisks are significantly different (P < 0.05) from the respective control group value according to model 1. gBHB, β-hydroxybutyrate; NEFA, nonesterified FA.
(P < 0.001). In S5, the CLA concentration and secretion returned to the baseline value (Fig. 4).
Linolenic acid in milk. Whereas the γ-linolenic acid
(18:3n-6) proportion of total FAME decreased with grass-only diets (P < 0.01) in the lowland period, the concentration of α-linole-nic acid (18:3n-3) increased by 34% (P < 0.001; Table 4). Slightly lower 18:3n-3 proportions were observed for B cows compared with P cows (P < 0.01) and for S2 compared with S1 (P < 0.05; Fig. 5). After transfer to the alpine site, 18:3n-3 proportions of total FAME of pastured cows (group P) were 0.63-fold higher compared with the respective lowland levels
(P < 0.001) and 1.14-fold higher than the value found in the C group (P < 0.001). The increase in B cows was less pro-nounced. The analysis of the milk samples obtained directly before and after the transfer to the alps showed that the increase of 18:3n-3 proportion was a direct response to the alpine so-journ rather than a continuous time effect of grass feeding (Fig. 5). In contrast to the proportionate values, the absolute daily 18:3n-3 secretion with milk remained unaffected by feeding grass to cows kept in barn. The pastured cows still showed a significantly higher daily 18:3n-3 secretion in the lowlands (P < 0.01) and at the alpine site (P < 0.001) compared with the
TABLE 4
FA Content of Milk, FA Profile of Milk Fat, and αα-Tocopherol Content of Milka
Lowland period Alpine period
(avg. of S1 and S2) (avg. of S3 and S4) Significances
Group Control Barn Pasture Control Barn Pasture SEb Groupc Period (altitude)d Group × periodc Total FAMEe(g/L) 41.1b 43.8a,b 41.3b 40.1b 46.0a,b 47.0a 1.76 NSi <0.001 <0.05 FAe,f(g/100 g FAME) 4:0 3.48b 3.48b 3.55b 3.26c 3.89a 3.55b 0.071 <0.05 <0.01 <0.001 6:0 2.37b 2.55a 2.55a 2.19c 2.17c 2.04d 0.033 NS <0.001 <0.01 8:0 1.31b 1.52a 1.53a 1.21c 1.06d 1.02d 0.020 NS <0.001 <0.001 10:0 2.74b 3.46a 3.54a 2.53b 1.91c 1.95c 0.011 NS <0.001 <0.001 12:0 3.14b 4.04a 3.85a 3.00b 2.23c 2.09c 0.067 NS <0.001 <0.001 14:0 10.7b 12.1a 11.5a,b 10.8b 9.5c 8.5d 0.25 <0.05 <0.001 <0.001 16:0 34.0 29.3* 25.3* 33.7 29.5* 25.4* 0.79 <0.001 NS NS 17:0 0.627c 0.875a 0.843a,b 0.642c 0.811b 0.843a,b 0.0089 <0.001 <0.05 <0.05 18:0 10.2b,c 9.3c 10.1b,c 9.4c 10.4b 11.8a 0.25 <0.01 <0.001 <0.001 18:1t4-t8 0.249b 0.185c 0.236b,c 0.238b,c 0.285a,b 0.313a 0.0161 NS <0.001 <0.01 18:1t9 0.426a,b 0.309c 0.328b,c 0.422a,b 0.450a 0.469a 0.0256 NS <0.001 0.05 18:1t10-11 0.84d 3.34a 4.01a 0.73d 2.37c 3.12b 0.219 <0.001 <0.001 <0.05 18:1t12 0.182 0.191 0.185 0.166 0.187 0.177 0.0090 NS NS NS 18:1c9 18.8b,c 16.4c 18.3c 20.2b,c 21.6a,b 24.1a 0.88 NS <0.001 <0.001 18:1c11 0.477 0.399 0.460 0.541 0.576 0.653 0.0371 NS <0.001 NS 18:1c12 0.160 0.092* 0.095* 0.174 0.101* 0.117* 0.0042 <0.001 <0.001 NS 18:2c9,t11g 0.529c 1.370b 1.705a 0.551c 1.163b 1.340b 0.098 <0.001 <0.01 <0.05 18:2t9,t11 0.041 0.082* 0.088* 0.045 0.077* 0.085* 0.0032 <0.001 NS NS 18:2t10,c12 0.038c 0.046b 0.044b,c 0.041b,c 0.042b,c 0.051a 0.0020 <0.05 NS <0.05 18:2t11,c13h 0.020c 0.073b 0.073b 0.020c 0.102a 0.114a 0.0072 <0.001 <0.001 <0.05 18:2n-6 1.38b 0.84c 0.94c 1.31b 1.42b 1.57a 0.040 <0.01 <0.001 <0.001 18:2c9,c15 0.033c 0.049b 0.047b 0.032c 0.050b 0.054a 0.0011 <0.001 <0.01 <0.05 18:3n-6 0.028a 0.021b 0.021b 0.029a 0.017c 0.018c 0.0009 <0.001 <0.001 <0.05 18:3n-3 0.495d 0.619c 0.703c 0.536d 0.950b 1.146a 0.030 <0.001 <0.001 <0.001 20:0 0.162b 0.136c 0.139c 0.171b 0.183a,b 0.200a 0.0054 NS <0.001 <0.001 20:4n-6 0.077 0.071 0.066* 0.083 0.073* 0.066* 0.0020 <0.001 NS NS 20:5n-3 0.060 0.073* 0.083* 0.065 0.083* 0.083* 0.0038 <0.001 NS NS 22:5n-3 0.078 0.113* 0.109* 0.085 0.118* 0.120* 0.0048 <0.001 NS NS 22:6n-3 ND 0.009* 0.009* ND 0.010* 0.009* 0.002 <0.001 NS NS Total n-3 0.81d 1.32c 1.43c 0.85d 1.64b 1.98a 0.056 <0.001 <0.001 <0.001 Total n-6 2.18b 1.62c 1.77c 2.11b 2.16b 2.36a 0.056 <0.05 <0.001 <0.001 n-6/n-3f 2.71 1.24* 1.24* 2.54 1.32* 1.21* 0.067 <0.001 NS NS α-Tocopherolf(mg/L) 0.75 1.42* 1.37* 0.67 1.57* 1.57* 0.041 <0.001 <0.05 NS
an = 12 per group and period.
bStandard error of groups.
cEvaluated by model 1.
dEvaluated by model 3 (without control).
eSuperscript roman letters indicate significant differences (P < 0.05) between group × period interaction means according to model 1. fValues marked with asterisks are significantly different (P < 0.05) from the respective control group value according to model 1. gIncluding the trans-8,cis-10 and trans-7,cis-9 isomers.
hPossibly including traces of the cis-9,cis-11 isomer. iNS, not significant; ND, not detected.
FIG. 1. Average intake of net energy and α-linolenic acid throughout the entire experiment. S0 and S5 baseline subperiods; S1 and S2, lowland subperiods; S3 and S4 alpine subperiods. ● Pasture group; ▲ indoor grass group; ■control group; n = 6 per group. Dotted lines indicate that half of the cows were switched between pasture and indoor group. Dashed lines mark the day of transport of the grass-fed cows to the alpine location. Error bars repre-sent SE. Different superscripts indicate significant group differences at P < 0.05.
FIG. 2. Average body weight and milk yield throughout the entire experiment. S0 and S5 baseline subperiods; S1 and S2, lowland subperiods; S3 and S4 alpine subperiods. ● Pasture group; ▲ indoor grass group; ■ control group; n = 6 per group. Dotted lines indicate that half of the cows were switched between pasture and indoor group. Dashed lines mark the day of transport of the grass-fed cows to the alpine location. Error bars represent SE. Differ-ent superscripts indicate significant group differences at P < 0.05.
FIG. 3. Concentrations of medium-chain saturated FA in milk throughout the entire experiment. S0 and S5 baseline subperiods; S1 and S2, lowland subperiods; S3 and S4 alpine subperiods. ● Pasture group; ▲ indoor grass group; ■control group; n = 6 per group. Dotted lines indicate that half of the cows were switched between pasture and indoor group. Dashed lines mark the day of transport of the grass-fed cows to the alpine location. Error bars repre-sent SE. Different superscripts indicate significant group differences at P < 0.05.
control cows. In S5, 18:3n-3 concentration returned to the base-line value (Fig. 5).
Long-chain PUFA in milk. Concentrations of the long-chain
n-3 PUFA (EPA, 20:5n-3; docosapentaenoic acid, 22:5n-3; DHA, 22:6n-3) were higher in milk samples of the grass-only groups than in C cows (P < 0.01), whereas 20:4n-6 (arachi-donic acid) was somewhat lower in P and B cows (Table 4). The ratio of all n-6/n-3 PUFA was diminished by half in P and B compared with C. The long-chain PUFA responded neither to the alpine sojourn (Table 4) nor to the stage of vegetation (data not shown).
Phytanic acid. Phytanic acid concentration in milk fat, which
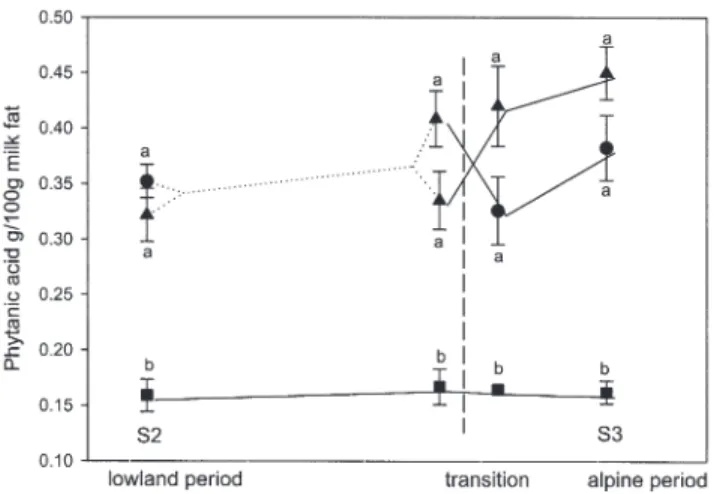
was analyzed in a smaller subset of samples (S2, transition pe-riod, and S3), was markedly higher with grass-only feeding com-pared with the control diet (P < 0.001; Fig. 6). There was a slight, but not significant, additional increase with alpine sojourn.
α-Tocopherol. The α-tocopherol concentration was 0.86-and 1.31-fold higher in milk of P 0.86-and B cows than that of C
cows during the lowland and the alpine period, respectively (P
< 0.001; Table 4). In S5, the values of the previously grass-fed
groups dropped nearly to the baseline level (from 1.57 mg/L in S4 to 0.95 mg/L in S5; the baseline value in S0 had been 0.79 mg/L for P and B on average).
DISCUSSION
Impact of feeding grass only on milk FA profile. In the lowland
period, turnout to pasture and the concurrent start of feeding only grass in the barn did not markedly change the net energy intake relative to controls but clearly altered the amount and composi-tion of the ingested lipids and the FA composicomposi-tion of the milk lipids. The intake of SFA, 18:1, and 18:2n-6 declined for groups P and B in the lowlands, since the concentrates and the included rumen-protected fat, maize, and cereals were no longer avail-able. In turn, 18:3n-3-intake was nearly doubled (Fig. 1).
Among the unsaturated FA, 18:3n-3 is one of those most
FIG. 4. Milk concentrations and daily excretion of CLA (18:2c9,t11) throughout the entire experiment. S0 and S5 baseline subperiods; S1 and S2, lowland subperiods; S3 and S4 alpine subperiods. ● Pasture group; ▲ indoor grass group; ■ control group; n = 6 per group. Dotted lines indicate that half of the cows were switched between pasture and indoor group. Dashed lines mark the day of transport of the grass-fed cows to the alpine location. Error bars represent SE. Different superscripts indicate significant group differences at P < 0.05.
FIG. 5. Milk concentrations and daily excretion of α-linolenic acid (18:3n-3) throughout the entire experiment. S0 and S5 baseline subperiods; S1 and S2, lowland subperiods; S3 and S4 alpine subperiods. ● Pasture group; ▲, in-door grass group; ■ control group; n = 6 per group. Dotted lines indicate that half of the cows were switched be-tween pasture and indoor group. Dashed lines mark the day of transport of the grass-fed cows to the alpine loca-tion. Error bars represent SE. Different superscripts indicate significant group differences at P < 0.05.
susceptible to ruminal biohydrogenation (29). Up to 99% of the dietary 18:3n-3 can be partially or completely hydrogenated (30). Main derivatives of 18:3n-3 biohydrogenation are 18:1trans-11 and 18:0 (31), which are partly desaturated at the ∆9 position to cis-9,trans-11 CLA and 18:1cis-9, respectively, in the mammary gland (32). As a consequence, under normal ruminal conditions, the high proportion of 18:3n-3 in grass-only diets explains the elevated contents of CLA and 18:1trans-11 in milk fat as also found in the current study (Fig. 4, Table 4). However, the increase of cis-9,trans-11 CLA dur-ing lowland grazdur-ing in our case was even more pronounced than in other studies (3,10,11,33). We did not find a substantial reduction of CLA in milk fat when harvested grass was fed in-stead of grazing, as has been previously described by Elgersma
et al. (34), but this is probably a problem related to the wilting
during storage (15), which we had carefully avoided.
The small proportion of 18:3n-3 passing by the rumen may appear in milk in its native form or in the form of endogenous derivatives (20:5n-3, 22:5n-3, and 22:6n-3; 35). Accordingly, all 20- and 22n-3 PUFA were higher in the milk fat of grass-only fed cows compared with the control. However, the mod-erate increase of these n-3 PUFA proportion found in milk fat in the lowland period of the present study (Table 4) did not re-flect the massive increase in 18:3n-3 intake of cows fed only grass (Fig. 1; Table 3). This underlines the high extent and rel-evance of the biohydrogenation of 18:3n-3 during the lowland period. We assume that the supply of fermentable energy dur-ing this period was sufficiently high to support extensive bio-hydrogenation. Furthermore, mobilized body fat, as indicated by the decrease in body weight (Fig. 2) and the significantly higher NEFA concentration in plasma of the pasture group (Table 3), may have contributed to the 18:3n-3 in milk fat (36). Thus, the actual recovery of ingested 18:3n-3 in the milk can be assumed to be even lower than the apparent recovery.
The relatively sharp increase in the proportion of 6:0 to 14:0
in milk of P and B cows at the beginning of the lowland period (Fig. 3) may be explained by a shift in ruminal production from propionate to acetate, when all concentrates were withdrawn since acetate is the substrate for the FA de novo synthesis in the mammary gland. The subsequent continuously decreasing amount of medium-chain SFA might have been a result of a de-creased energy intake and mobilization of body fat stores at the expense of de novo synthesis. However, as a moderate decrease of these medium-chain SFA also occurred in the control group, which was not exposed to dietary changes, a general effect linked to the progression of lactation may be assumed.
Impact of feeding alpine grass on the milk FA profile.
Un-like Kraft et al. (3), we found that cis-9,trans-11 CLA and 18:1trans-11 concentrations in milk fat were not further ele-vated when P and B cows received alpine instead of lowland grass (Fig. 4). These are not necessarily conflicting results, be-cause other influencing factors apart from alpine effects cannot be excluded, since Kraft et al. (3) compared milk from differ-ent herds. Ferlay et al. (12) found a considerable reduction of CLA after 3 wk of alpine grazing and related this to the stage of plant development (17). In the present experiment, no corre-sponding effect of stage of vegetation occurred at any experi-mental site (Fig. 4). In contrast to what was indicated by the re-sults of Fievez et al. (11), there was also no noticeable effect of forage biodiversity on the CLA concentration. Thus, feeding only grass, irrespective of site and vegetative stage, may per se be a main contributor to high cis-9,trans-11 CLA proportions in milk fat. Whereas the main isomer, cis-9,trans-11, slightly declined owing to alpine feeding, the trans-11,cis-13 isomer was further increased, making it an interesting marker and po-tential target of experiments elucidating its possible physiolog-ical effects.
The 18:3n-3 contents of forages were described to decrease with maturation of the grass (37). In the present study, this was also found in the alpine grass (6.81 vs. 4.13 g 18:3n-3/kg DM for young vs. mature grass) but not in the lowlands (6.76 vs. 9.01 g 18:3n-3/kg DM). Furthermore, Lolium perenne and
Tri-folium repens, two of the dominant species in the lowland
pas-ture (Table 1), contain far higher contents of 18:3n-3 than many other grasses and legumes (37). The absence of these species and the on-average higher maturity of the alpine forages (27) may at least partly explain the lower 18:3n-3 proportion in total FAME of the alpine grass. Together with alpine-specific anorexia of the cows (27), this drastically decreased 18:3n-3 intake (Fig. 1). In contrast to this, the most surprising and, with respect to human nutrition, most important effect of the alpine sojourn was the sharp increase of 18:3n-3 concentrations in milk fat, which in our case was definitely not related to the 18:3n-3 supply from food as suggested elsewhere (3,17).
Three hypotheses will be discussed here that could explain, alone or in combination, this discrepancy between intake of 18:3n-3 and its concentration in milk fat. One hypothesis (i) is that body fat mobilization with a preference for 18:3n-3 took place as a result of the energy deficiency associated with high al-titude. The other hypotheses are that ruminal biohydrogenation activity was reduced by either energy deficiency (ii) or specific
FIG. 6. Phytanic acid concentration in milk fat. S2, lowland period; S3, alpine period. ● Pasture group; ▲ indoor grass group; ■ control group; n = 6 per group. Dotted lines indicate that half of the cows were switched between pasture and indoor group. Dashed line marks the day of transport of grass-fed cows to the alpine location. Error bars represent SE. Different superscripts indicate significant differences at P < 0.05.
secondary plant ingredients that inhibit ruminal microbes (iii). The fact that less than 10% of 18:3n-3 escapes biohydrogenation in the rumen (30) makes it likely that even small changes in the ruminal ecosystem, influencing hydrogenating microbes, may have large effects on the amount of 18:3n-3 available at the duo-denum.
(i) Metabolic energy deficiency related to altitude. One key
issue might be the decrease in energy intake of the cows trans-ferred to the alpine site. Although cows partially reduced the energy deficit by a sharp decline in milk yield, as found in pre-vious studies (27,38), there were several indications of a per-sisting metabolic energy deficit such as decreased plasma glu-cose and insulin levels and increased body fat mobilization (as indicated by elevated plasma NEFA and BHB levels). Mobi-lization of body fat depots is typical for cows kept in high alpine regions (27,39), and a preferential release of 18-PUFA from body fat was observed in undernourished ruminants (36). This would suggest that the elevated 18:3n-3 concentrations in the milk fat obtained in the alpine period (Fig. 5) could origi-nate at least partially from body fat. This hypothesis is under-lined by the fact that 18:3n-3 was even more highly concen-trated in the P cows because grazing activity is assumed to cause additional energy expenditure in this hypoxic and uneven environment (38). The differences in plasma BHB and NEFA concentrations between the P and the B group during the alpine period further support this explanation. The higher proportion of 18:1cis-9 in the alpine milk vs. control and of the milk from P vs. B cows also fits this hypothesis, because 18:1cis-9, the major FA in depot fat, is likely to be released from body stores.
(ii) Ruminal energy deficiency. Kelly et al. (33) considered
ruminal ecosystem changes to be responsible for alterations in PUFA proportions of milk fat. In our study, in response to the nutritional energy deficiency during the alpine period in groups P and B (here: lack of fermentable organic matter), the rumen microbial capacity for biohydrogenation may have been re-duced and more 18:3n-3 could have remained available for ab-sorption. This would explain the negative response of cis-9,trans-11 CLA and 18:1trans-11 to alpine sojourn on the one hand and the positive response of 18:3n-3 on the other hand, which was found when comparing lowland and alpine milk samples derived from the grass-fed cows in our experiment (Table 4; Figs. 4 and 5). Milk of cows having restricted access to pasture was reported to have lower 18:3n-3 and increased 18:1trans-11 and cis-9,trans-11 CLA proportions when the an-imals were supplemented with grain (10). Also, Sasaki et al. (30) reported an increase of ruminal biohydrogenation of 18:3n-3 in sheep from 93 to 99% when a roughage-only diet was supplemented with concentrate at 400 g/kg. This supports the assumption of fermentable organic matter being one key factor for milk FA profile.
Both the mobilization hypothesis and the hypothesis of a re-duced ruminal biohydrogenation are based on the presence of a serious energy deficiency during high-altitude grazing, which is underlined by many variables concerning performance and metabolic profile. Data are consistent with those of Agenäs et
al. (9) where, at turnout to pasture, an impaired energy balance
of the cows was associated with elevated 18:3n-3 concentra-tions in milk.
(iii) Inhibition of ruminal biohydrogenation by dietary com-ponents. Another explanation, which would rely on a specific
high-alpine phenomenon, is the assumption that typically high concentrations of secondary plant ingredients, such as polyphe-nols and terpenoids (40,41) as well as others, may inhibit hy-drogenating microorganisms in the rumen. Tannins were shown to inhibit several strains of Butyrivibrio fibrisolvens (42), one of the most important biohydrogenating ruminal bac-teria species (31). On the other hand, the findings of Dewhurst
et al. (43) that 18:3n-3 biohydrogenation was reduced when
feeding Trifolium pratense instead of T. repens suggest that plant constituents other than tannins also may influence biohy-drogenation. In the present study, T. pratense was the most abundant legume in the alpine pasture but made up only 1.6% of the lowland forage. We assume that a complex interaction of different factors determines CLA and 18:3n-3 concentrations in milk rather than a monofactorial alpine mechanism. This im-plies that CLA and 18:3n-3 may be variable across milks from different alpine origins, which also may explain part of the dif-ferences between studies.
All hypotheses discussed to explain the higher 18:3n-3 con-centrations in alpine pasture-derived milk fat would include the expectation of enhanced 20:5n-3 (EPA) and 22:6n-3 (DHA) content too, as 18:3n-3 can be converted to some extent into these FA in mammals (35). Although all 20- and 22n-3 PUFA were significantly higher in milk of groups P and B compared with group C and thus showed a diet effect, no additional ef-fect of the alpine sojourn was found. It can be speculated that the maximal transfer rate was already reached at the 18:3n-3 concentration met in the lowlands by groups P and B. Further-more, the transfer of PUFA from blood into milk also has to be considered: In particular, 20 and 22n-3 PUFA are reported to be preferentially bound to phospholipids in lipoproteins and therefore are hardly cleaved by lipoprotein lipases in the mam-mary gland. This could explain the low transfer rate into milk (44). The answer to the question—Which are the limiting fac-tors of EPA and DHA synthesis and secretion?—is not yet clear (44), but it seems relevant to examine this question, since these n-3 PUFA are of an even higher specificity and importance for human health than 18:3n-3 (35).
Phytanic acid. This branched-chain 20:0 FA, being present
in the plasma lipids of cows in proportions as high as 130 g/kg total FA (45), was strongly discriminated for by the mammary gland and was found in milk fat in concentrations between 10 and 500 mg/kg (46). The markedly increased values that were reached on pasture in the present study are at the upper limit of the literature values for butter as reviewed by Brown et al. (46). Similar to CLA, phytanic acid is supposed to act as a gene tran-scription factor and is assumed to exert antidiabetic effects (47). However, in this context a general risk of consuming higher amounts of phytanic acid for Refsum’s disease patients, who suffer from inherited disorders of peroxisomal α-oxida-tion (48), must be considered.
prob-lem in PUFA-rich milk lipids (49), including technological, fla-vor-related, and human health aspects. Our results indicate that pasture in any form obviously provides high amounts of α-to-copherol for milk synthesis and that its concentration is even higher in milk derived from alpine pasture. The α-tocopherol concentrations in pasture-derived milk were much higher than the minima suggested by Al-Mabruk et al. (49) to ensure a fa-vorable oxidative stability of milk. According to Jensen et al. (50), α-tocopherol is actively secreted into the milk, and its daily amounts excreted with milk remain constant at levels be-tween 20 and 30 mg/d. Indeed, in the grass-only fed cows, the absolute excretion of α-tocopherol per day with milk was on average higher during the lowland than during the alpine pe-riod. Thus, the significantly higher concentrations in milk pro-duced during the alpine period were mainly a consequence of the reduced milk yield. On the other hand, the control cows on average did not reach a level of 20 mg α-tocopherol excretion per day, suggesting that the supply with this diet was too low to reach the naturally determined range.
General implications. Concerning high CLA and n-3 PUFA
contents, a low n-6/n-3 ratio, and low concentrations of SFA, the alpine milk in this study, as in previous studies, constituted a more favorable FA pattern than conventionally produced low-land milk (2,3,8). However, levels of cis-9,trans-11-CLA were not different from milk obtained with lowland grazing, even though this pasture was intensively managed and poor in species diversity. We therefore conclude that the effects on this CLA isomer and on 18:1trans-FA are linked to grazing in gen-eral rather than being the result of a specific alpine pasture ef-fect. In agreement with Kraft et al. (3), the same seems to hold true for the long-chain PUFA (20:5, 22:5, and 22:6 n-3). The situation is obviously different for 18:3n-3, which was markedly elevated by the alpine conditions, thus confirming previous findings (3,4). However, the real nature of the alpine grazing effect on 18:3n-3 concentration in milk still has to be elucidated. Where specific plant constituents are one of the major reasons affecting CLA and n-3 PUFA contents, strate-gies to increase 18:3n-3 further would be applicable also for lowland milk production systems. Where energy deficiency is the major driving factor, there would be only a very limited po-tential since a conflict would arise between product quality and animal welfare.
ACKNOWLEDGMENTS
We acknowledge the great help of the staff of the ETH research sta-tions under the direction of Dr. Hans Leuenberger in carrying out the animal experiments. Further, we thank Seher Ayra, Carmen Kunz, and Carmen Kleiner for analytical support. This study was partially supported by the Swiss Federal Office of Agriculture, Berne.
REFERENCES
1. Innocente, N., Praturlon, D., and Corradini, C. (2002) Fatty Acid Profile of Cheese Produced with Milk from Cows Grazing on Mountain Pastures, Ital. J. Food Sci. 3, 217–224.
2. Zeppa, G., Giordano, M., Gerbi, V., and Arlorio, M. (2003) Fatty Acid Composition of Piedmont “Ossolano” Cheese, Lait 83, 167–173.
3. Kraft, J., Collomb, M., Möckel, P., Sieber, R., and Jahreis, G. (2003) Differences in CLA Isomer Distribution of Cow’s Milk Lipids, Lipids 38, 657–664.
4. Hauswirth, C.B., Scheeder, M.R.L., and Beer, J.H. (2004) High Omega-3 Fatty Acid Content in Alpine Cheese—The Basis for an Alpine Paradox, Circulation 109, 103–107.
5. Bianchi, M., Fortina, R., Battaglini, L., Mimosi, A., Lussiana, C., and Ighina, A. (2003) Characterisation of Milk Production in Some Alpine Valleys of Piemonte, Ital. J. Anim. Sci. 2, 305–307. 6. Simopoulos, A.P. (2002) The Importance of the Ratio of
Omega-3/Omega-6 Essential Fatty Acids, Biomed. Pharma-cother. 56, 365–379.
7. Belury, M.A. (2002) Dietary Conjugated Linoleic Acid in Health: Physiological Effects and Mechanisms of Action, Annu. Rev. Nutr. 22,505–531.
8. Nakamura, T., Azuma, A., Kuribayashi, T., Sugihara, H., Okuda, S., and Nakagawa, M. (2003) Serum Fatty Acid Levels, Dietary Style and Coronary Heart Disease in Three Neighbour-ing Areas in Japan: The Kumihama Study, Br. J. Nutr. 89, 267–272.
9. Agenäs, S., Holtenius, K., Griinari, M., and Burstedt, E. (2002) Effects of Turnout to Pasture and Dietary Fat Supplementation on Milk Fat Composition and Conjugated Linoleic Acid in Dairy Cows, Acta Agric. Scand. 52A, 25–33.
10. Wijesundera, C., Shen, Z., Wales, W.J., and Dalley, D.E. (2003) Effect of Cereal Grain and Fibre Supplements on the Fatty Acid Composition of Milk Fat of Grazing Dairy Cows in Early Lac-tation, J. Dairy Res. 70, 257–265.
11. Fievez, V., Vlaeminck, B., Raes, K., Chow, T.T., De Smet, S., Demeyer, D., and Bruinenberg, M.H. (2002) Dietary and Milk Fatty Acid Composition in Relation to the Use of Forages from Semi-natural Grasslands, Grassl. Sci. Eur. 7, 558–559. 12. Ferlay, A., Martin, B., Pradel, P., Capitan, P., Coulon, J.B., and
Chilliard, Y. (2002) Effect of the Nature of Forages on Cow Milk Fatty Acids Having a Positive Role on Human Health, Grassl. Sci. Eur. 7, 556–557.
13. Chilliard, Y., Ferlay, A., and Doreau, M. (2001) Effect of Dif-ferent Types of Forages, Animal Fat or Marine Oils in Cow’s Diet on Milk Fat Secretion and Composition, Especially Conju-gated Linoleic Acid (CLA) and Polyunsaturated Fatty Acids, Livest. Prod. Sci. 70, 31–48.
14. Boufaied, H., Chouinard, P.Y., Tremblay, G.F., Petit, H.V., Michaud, R., and Belanger, G. (2003) Fatty Acids in Forages. II. In vitro Ruminal Biohydrogenation of Linolenic and Linoleic Acids from Timothy, Can. J. Anim. Sci. 83, 513–522.
15. Dewhurst, R.J., Moorby, J.M., Scollan, N.D., Tweed, J.K.S., and Humphreys, M.O. (2002) Effects of a Stay-Green Trait on the Concentrations and Stability of Fatty Acids in Perennial Ryegrass, Grass Forage Sci. 57, 360–366.
16. Collomb, M., Bütikofer, U., Sieber, R., Jeangros, B., and Bosset, J.-O. (2002) Correlation Between Fatty Acids in Cows’ Milk Fat Produced in the Lowlands, Mountains and Highlands of Switzer-land and Botanical Composition of the Fodder, Int. Dairy J. 12, 661–666.
17. Martin, B., Fedele, V., Ferlay, A., Grolier, P., Rock, E., Gruffat, D., and Chilliard, Y. (2004) Effects of Grass-Based Diets on the Content of Micronutrients and Fatty Acids in Bovine and Caprine Dairy Products, Grassl. Sci. Eur. 9, 876–886.
18. Berry, N.R., Scheeder, M.R.L., Sutter, F., Kröber, T.F., and Kreuzer, M. (2000) The Accuracy of Intake Estimation Based on the Use of Alkane Controlled-Release Capsules and Faeces Grab Sampling in Cows, Ann. Zootech. 49, 3–13.
19. Braun-Blanquet, J. (1964) Pflanzensoziologie, 3rd edn., Springer Verlag, Vienna.
20. Suter, B., Grob, K., and Pacciarelli, B. (1997) Determination of Fat Content and Fatty Acid Composition Through 1-min Trans-esterification in the Food Sample; Principles, Z. Lebensm. Un-ters. Forsch. A 204, 252–258.
21. Collomb, M., and Bühler, T. (2000) Analyse de la composition en acides gras de la graisse de lait, Mitt. Lebensm. Hyg. 91, 306–332.
22. Wolff, R.L., and Precht, D. (2002) A Critique of 50-m CP-Sil 88 Capillary Columns Used Alone to Assess trans-Unsaturated Fatty Acids in Foods: The Case of the TRANSFAIR Study, Lipids 37, 627–629.
23. Kramer, J.K.G., Blackadar, C.B. and Zhou, J. (2002) Evaluation of Two GC Columns (60-m SUPELCOWAX 10 and 100-m CP Sil 88) for Analysis of Milkfat with Emphasis on CLA, 18:1, 18:2 and 18:3 Isomers, and Short- and Long-Chain FA, Lipids 37, 823–835.
24. Collomb, M., Sieber, R., and Bütikofer, U. (2004) CLA Isomers in Milk Fat from Cows Fed Diets with High Levels of Unsatu-rated Fatty Acids, Lipids 39, 355–364.
25. Wettstein, H.-R., Scheeder, M.R.L., Sutter, F., and Kreuzer, M. (2001) Effect of Lecithins Partly Replacing Rumen-Protected Fat on Fatty Acid Digestion and Composition of Cow Milk, Eur. J. Lipid Sci. Technol. 103, 12–22.
26. Rettenmaier, R., and Schüep, W. (1992) Determination of Vita-mins A and E in Liver Tissue, Int. J. Vitam. Nutr. Res. 62, 312–317.
27. Leiber, F., Kreuzer, M., Jörg, B., Leuenberger, H., and Wettstein, H.-R. (2004) Contribution of Altitude and Alpine Origin of Forage to the Influence of Alpine Sojourn of Cows on Intake, Nitrogen Conversion, Metabolic Stress and Milk Syn-thesis, Anim. Sci. 78, 451–466.
28. RAP (Station federale de recherches en production animále) (1999) Fütterungsempfehlungen und Nährwerttabellen für Wiederkäuer, 4th edn., Landwirtschaftliche Lehrmittelzentrale, Zollikofen, Switzerland.
29. Wachira, A.M., Sinclair, L.A., Wilkinson, R.G., Hallett, K., Enser, M., and Wood, J.D. (2000) Rumen Biohydrogenation of n-3 Polyunsaturated Fatty Acids and Their Effects on Microbial Efficiency and Nutrient Digestibility in Sheep, J. Agric. Sci. 135, 419–428.
30. Sasaki, H., Horiguchi, K., and Takahashi, T. (2001) Effects of Different Concentrate and Roughage Ratios on Ruminal Bal-ance of Long-Chain Fatty Acids in Sheep, Asian-Austral. J. Anim. Sci. 14, 960–965.
31. Song, M.K. (2000) Fatty Acid Metabolism by Rumen Microor-ganisms, Asian-Austral. J. Anim. Sci. 13, 137–148.
32. Griinari, J.M., Corl, B.A. Lacy, S.H., Chouinard, P.Y., Nurmela, K.V.V., and Bauman, D.E. (2000) Conjugated Linoleic Acid Is Synthesized Endogenously in Lactating Dairy Cows by ∆9-De-saturase. J. Nutr. 130, 2285–2291.
33. Kelly, M.L., Kolver, E.S., Baumann, D.E., van Amburgh, M.E., and Muller, L.D. (1998) Effect of Intake of Pasture on Concen-trations of Conjugated Linoleic Acid in Milk of Lactating Cows, J. Dairy Sci. 81, 1630–1636.
34. Elgersma, A., Ellen, G., and Tamminga, S. (2004) Rapid De-cline of Contents of Beneficial Omega-7 Fatty Acids in Milk from Grazing Cows with Decreasing Herbage Allowance, Grassl. Sci Eur. 9, 1136–1138.
35. Sinclair, A.J., Attar-Bashi, N.M., and Li, D. (2002) What Is the Role of α-Linolenic Acid for Mammals? Lipids 37, 1113–1123. 36. Soppela, P., and Nieminen, M. (2002) Effect of Moderate
Win-tertime Undernutrition on Fatty Acid Composition of Adipose Tissues of Reindeer (Rangifer tarandus tarandus L.), Comp. Biochem. Physiol. A 132, 403–409.
37. Boufaied, H., Chouinard, P.Y., Tremblay, G.F., Petit, H.V., Michaud, R., and Belanger, G. (2003) Fatty Acids in Forages. I. Factors Affecting Concentrations, Can. J. Anim. Sci. 83, 501–511.
38. Christen, R.E., Kunz, P.L., Langhans, W., Leuenberger, H., Sut-ter, F., and Kreuzer, M. (1996) Productivity, Requirements and Efficiency of Feed and Nitrogen Utilization of Grass-fed Early Lactating Cows Exposed to High Alpine Conditions, J. Anim. Physiol. Anim. Nutr. 76, 22–35.
39. Kreuzer, M., Langhans, W., Sutter, F., Christen, R.E., Leuen-berger, H., and Kunz, P.L. (1998) Metabolic Response of Early Lactating Cows Exposed to Transport and High Altitude Graz-ing Conditions, Anim. Sci. 67, 237–248.
40. Barry, T.N., and McNabb, W.C. (1999) The Implications of Condensed Tannins on the Nutritive Value of Temperate For-ages Fed to Ruminants, Br. J. Nutr. 81, 263–272.
41. Mariaca, R.G., Berger, T.F.H., Gauch, R., Imhof, M.I., Jeangros, B., and Bosset, J.O. (1997) Occurrence of Volatile Mono- and Sesquiterpenoids in Highland and Lowland Plant Species as Possible Precursors for Flavor Compounds in Milk and Dairy Products, J. Agric. Food Chem. 45, 4423–4434.
42. Min, B.R., Barry, T.N., Attwood, G.T., and McNabb, W.C. (2003) The Effect of Condensed Tannins on the Nutrition and Health of Ruminants Fed Fresh Temperate Forages: A Review, Anim. Feed Sci. Technol. 106, 3–19.
43. Dewhurst, R.J., Evans, R.T., Scollan, N.D., Moorby, J.M., Merry, R.J., and Wilkins, R.J. (2003) Comparison of Grass and Legume Silages for Milk Production. 2. In vivo and in sacco Evaluations of Rumen Function, J. Dairy Sci. 86, 2612–2621. 44. Offer, N.W., Mardsen, M., Dixon, J., Speake, B.K., and
Thacker, F.E. (1999) Effect of Dietary Fat Supplements on Lev-els of n-3 Poly-unsaturated Fatty Acids, trans Acids and Conju-gated Linoleic Acid in Bovine Milk, Anim. Sci. 69, 613–625. 45. Lough, A.K. (1977) The Phytanic Acid Contents of the Lipids
of Bovine Tissues and Milk, Lipids 12, 115–119.
46. Brown, P.J., Mei, G., Gibberd, F.B., Burston, D., Mayne, P.D., McClinchy, J.E., and Sidey, M. (1993) Diet and Refsum’s Dis-ease. The Determination of Phytanic Acid and Phytol in Certain Foods and the Application of This Knowledge to the Choice of Suitable Convenience Foods for Patients with Refsum’s Dis-ease, J. Hum. Nutr. Diet. 6, 295–305.
47. McCarty, M.F. (2001) The Chlorophyll Metabolite Phytanic Acid Is a Natural Rexinoid—Potential for Treatment and Pre-vention of Diabetes, Med. Hypoth. 56, 217–219.
48. Mukherji, M., Schofield, C.J., Wierzbicki, A.S., Jansen, G.A., Wanders, R.J.A., and Lloyd, M.D. (2003) The Chemical Biol-ogy of Branched-chain Lipid Metabolism, Prog. Lipid Res. 42, 359–376.
49. Al-Mabruk, R.M., Beck, M.F.G., and Dewhurst, R.J. (2004) Ef-fects of Silage Species and Supplemental Vitamin E on the Ox-idative Stability of Milk, J. Dairy Sci. 87, 406–412.
50. Jensen, S.K., Johannsen, A.K.B., and Hermansen, J.E. (1999) Quantitative Secretion and Maximal Secretion Capacity of Retinol, β-Carotene and α-Tocopherol into Cows’ Milk, J. Dairy Res. 66, 511–522.