Design and Optimization of a High Thermal Flux Research Reactor via Kriging-Based Algorithm
By MAssA cus
Stephanie Anne Kempf B.S., Nuclear Engineering (2007)
The University of Tennessee, Knoxville
R R ES
S.M., Nuclear Science and Engineering (2008)
Massachusetts Institute of Technology
Submitted to the Department of Nuclear Science and Engineering in partial fulfillment of the requirements for the degree of
Doctor of Philosophy in Nuclear Science and Engineering at the
Massachusetts Institute of Technology June 2011
0 Massachusetts Institute of Technology. All rights reserved.
Signature of Author:
Department of Nuclear Sience and Engineering May 16, 2011 Certified by:
Dr. Lin-wen Hu Associate Director, Research Utilization and Development, MIT Reactor Laboratory Thesis Supervisor Certified by:
Professor Benoit Forget Assistant Professor of Nuclear Science and Engineering Thesis Supervisor Accepted by:
Design and Optimization of a High Thermal Flux Research Reactor via Kriging-Based Algorithm
By Stephanie A. Kempf
Submitted to the Department of Nuclear Science and Engineering on May 16, 2011 in Partial Fulfillment of the Requirements for the Degree of Doctor of Philosophy in Nuclear Science and
Engineering
Abstract
In response to increasing demands for the services of research reactors, a 5 MW LEU-fueled research reactor core is developed and optimized to provide high thermal flux within specified limits upon thermal hydraulic performance, cycle length, irradiation utilization, and
manufacturability.
A novel fuel assembly concept which makes use of integral flux traps is postulated to meet these
requirements. Each assembly can be rotated into one of three different configurations to produce flux traps of different size, shape, and neutron energy spectrum within the core.
A method for predicting and guiding the search for the optimum geometry was sought. Kriging
has been chosen to predict the values of eigenvalue and thermal flux at untested geometric parameters. Because kriging treats all measurements as the sum of a global deterministic function and a stochastic departure from that function, predictions come with a measurement of uncertainty. As a result, the analyst can search the design space for likely improvement, or probe areas of high uncertainty for improvements that might have been missed using other methods. The technique is used in an algorithm for constrained optimization of the design, and a set of best practices for use of this are described.
The optimized design produces a peak thermal flux of 1.56 x 101 n/cm2s. Safety is
demonstrated by presentation of reactivity feedback coefficients and the results of loss of flow and reactivity insertion transient analysis.
A single fission target can be used to produce 96 6-day Ci of 99Mo per week. When the reactor is
oriented to take advantage of high fast flux, steels can be subjected to damage rates of 5.76 dpa per year. Silicon carbide can be damaged at a rate of 2.79 dpa/y. The concept is a safe, versatile, proliferation-resistant means of supplying current and future irradiation needs.
Thesis Supervisor: Dr. Lin-wen Hu
Acknowledgements
As in most research endeavors, this work could not have been undertaken without a great deal of support from others. First and foremost are my advisors, Dr. Lin-wen Hu and Prof. Ben Forget, who conceptualized and funded the project and provided a wealth of guidance on how to make my own ideas into a realistic design.
Second, I owe a great deal of gratitude to Dr. Sung Joong Kim for his patient instruction in the use of RELAP.
Third, I am grateful to a number of my fellow students and researchers for their assistance in various forms: Dr. Matthew Denman for sharing a multitude of resources and for being a
sounding board for ideas; Dustin Langewisch for first introducing me to the kriging technique for interpolation; Koroush Shirvan for help with RELAP; Bo Feng, Paul Romano, and Nick Horelik for assisting with neutronic calculations; Dr. David Carpenter for sharing his knowledge of SiC experiments.
Finally, I want to thank my husband, Kevin for his constant love and support, and for the selflessness that made him set aside his own graduate studies in order to follow me as I chased this amazing opportunity. I truly can't put my gratitude into words.
Contents
Chapter 1 : Introduction, Background and Objectives ... 14
1.1 Introduction... ... 14
1.2 Applications of Research Reactors and the Need for High Flux ... 16
1.2.1 M aterial Testing ... 16
1.2.2 N eutron Capture R eactions... 17
1.3 D esign O bjectives ... 19
1.4 D esign M etrics for Evaluation of Current D esigns... 20
1.4.1 Pow er D ensity to Therm al Flux R atio... 21
1.4.2 Pow er to Therm al Flux Ratio ... 22
1.4.3 O perating Cycle Length and A vailable Fluence ... 23
1.4.4 A vailable Flux Trap A rea... 24
1.4.5 Heat Transfer Coefficient and Margin to Saturation Temperature ... 24
1.5 Com parison of Selected Reactors ... 26
1.5.1 A dvanced Test R eactor... 26
1.5.2 H igh Flux Isotope Reactor ... 29
1.5.3 M issouri U niversity R esearch Reactor... 31
1.5.4 Jules H orow itz R eactor ... 33
1.5.5 M assachusetts Institute of Technology R eactor- II... 34
1.5.6 Perform ance m etrics of other reactor designs... 36
1.6 Sum m ary... 39
1.7 R eferences ... 39
Chapter 2 : Proposed Designs and Analysis M ethods... 41
2.1 Introduction...41
2.2 D esign Lim its... 41
2.2.1 N eutronic Lim its ... 41
2.2.2 M aterial Lim its... 44
2.4.1 N eutronic A nalysis ... 54
2.5 Trapezoidal A ssem bly w ith Integral Flux Trap... 56
2.5.1 Prelim inary Core M ap A nalysis ... 57
2.6 Sum m ary ... 60
2.7 R eferences...61
Chapter 3 : Neutronic Optim ization via Kriging-Based Algorithm ... 63
3.1 Introduction...63
3.2 K riging ... 63
3.2.1 Prior U se in D esign O ptim ization... 66
3.2.2 A pplicability to Neutronic D esign Tasks... 66
3.2.3 Applications of Other Optimization Techniques in Reactor Design ... 67
3.3 K riging-Based A lgorithm ... 69
3.4 A pplication to System of Interest ... 72
3.4.1 D esign Bounds on System of Interest ... 72
3.4.2 G eneration of Training D ata Locations ... 74
3.4.3 Results of Training D ata G eneration ... 76
3.4.4 Selection of R egression Function ... 77
3.4.5 Selection of Correlation Function... 78
3.5 Best Practices for K riging in R eactor D esign ... 82
3.5.1 Im portance of the Correlation Function... 82
3.5.2 The G lobality Q uestion... 83
3.5.3 Slow script run tim e... 84
3.6 R esults of O ptim ization ... 85
3.9 R eferences...88
Chapter 4 : Neutronic Analysis...90
4.1 Introduction...90
4.2 Conversion to H eterogeneous M odel... 90
4.3 Initial Checks on A ssem bly Perform ance ... 92
4.3.1 Excess R eactivity ... 92
4.3.2 R adial and axial peaking factors ... 94
4.5.1 Reactivity Coefficients ... 96
4.6.1 Sizing and Placem ent of Control Structures ... 99
4.6.2 W orst-case axial pow er shape ... 101
4.6.3 Rod Ejection from Critical Reactor ... 103
4.7 Sum m ary...103
4.8 References...103
Chapter 5 : Therm al Hydraulic Analysis ... 104
5.1 Introduction...104
5.2 Steady state operation...104
5.2.1 H and Calculations...104
5.2.2 Com parison to other concepts ... 111
5.3 Vibration of Fuel Assem blies ... 113
5.4 RELAP5 A nalysis...115
5.4.1 M odel D evelopm ent ... 115
5.4.2 R esults of Steady State Calculation...120
5.4.3 Loss of Flow Transient ... 120
5.4.4 Reactivity Insertion Transient ... 125
5.5 Sum m ary...130
5.6 R eferences...130
Chapter 6 : Fuel M anagem ent and Reactivity ... 131
6.1 Introduction...131
6.2 A nalysis of Fuel M anagem ent Criteria ... 131
6.3 D evelopm ent of Fully Loaded Core Com position...135
6.3.1 M ethod ... 135
6.3.2 R esults of Calculations...136
6.4 Im pact on Therm al H ydraulics ... 140
6.5 Im pact on Flux Spectra ... 141
6.6 Licensing Issues Related To Fuel M anagem ent ... 143
7.3 Production of R adionuclides ... 148
7.3.1 Background ... 148
7.3.2 A nalytical A ssum ptions... 150
7 .3 .3 R esu lts ... 15 2 7.3.4 Reactivity Worth of Targets and Safety Implications ... 154
7.3.4 C om parison to O ther D esigns...154
7.4 M aterial D am age ... 155
7.4.1 B ackground and A ssum ptions... 155
7.4.2 R esults of A n alysis ... 158
7.4.3 Comparison to Needs and to Other Designs ... 158
7 .5 S u m m ary... 159
7.6 R eferences. .... . . ... 159
Chapter 8 NSummary Optmim... ... 161
8.1 In tro d u ctio n ... 161
8.2 Neutronic Optimization via Kriging-Based Algorithm... 162
8.4 Safety A nalysis f .re... ... 163
8.5 Fuel M anagem ent os... 166
8.6 Supply of Irradiation Services... 166
8.7 Summary of Contributions vi. riigt... ... 167
8.8 F uture W ork n ... 168
8.8.1 Neutronic Optimization via Kriging Based Algorithm ... 168
8.8.2 Neutronic Analysis ... 168
8.8.3 T h erm al H ydraulics...169
8.8.4 Applications... 169
8.9 References... 169
Appendix A: M CNP and M CO DE Input Decks ... 171
A ppendix B: O ptim ization Script... 236
Appendix C: Core M aps and Characteristics ... 246
Table of Figures
Figure 1-1:Plot of Power Density vs. Peak Thermal Flux in Various Classes of U.S. Research and Test R e a c to rs ...----.---.-... 2 2 Figure 1-2: Plot of Reactor Thermal Power vs. Peak Thermal Flux for U.S. Research and Test Reactors 23
Figure 1-3: Top View of Advanced Test Reactor... 28
Figure 1-4: Cross Section of HFIR Reactor and Experimental Facilities, [HFIR Reactor Assembly, 2010] ... 3 0 Figure 1-5: Detail of Involute Plates [Ellis, 2010]... 30
Figure 1-6: Schematic of MURR Fuel Assembly [McKibben, 2006]. ... 32
Figure 1-7: Jules Horowitz Assembly Design and Potential Core Configuration [Bergamaschi, 2002].... 33
Figure 1-8: Top view of MITR-II core [Newton, 2006]... 35
Figure 2-1: Plot of Lu-177 (t1/2=6.734 d) Inventory for Arbitrary Production Rate of 5x10 1 " /s, with D ischarge from R eactor at 20 d ... 42
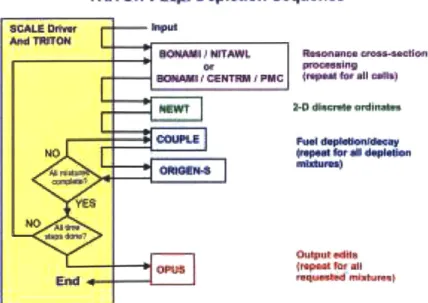
Figure 2-2: Diagram of T-DEPL Control Sequence [ORNL, 2009]... 50
Figure 2-3: Diagram of Predictor-Corrector Sequence Algorithm Used by ORIGEN-S, [ORNL, 2009]..52
Figure 2-4: Top view of 7-cylinder core configuration ... 56
Figure 2-5: Trapezoidal Assembly with Triangular Grid Plate Support... 57
F igu re 2 -6 : C o re 1 ... 5 8 F igu re 2 -7 : C o re 2 ... 5 8 F igu re 2 -8 : C o re 3 ... 5 9 F ig u re 2 -9 : C o re 4 ... 5 9 Figure 3-2: Safe-Margin Heat Flux, as Empirically Related to Channel Hydraulic Diameter ... 74
Figure 3-3: Flux Trap Edge Length Covariogram ... 79
Figure 3-4: Assembly Side Length Covariogram ... 80
Figure 3-5: Fuel Volume Fraction Covariogram ... 80
Figure 4-1: Sketch of Assembly (Not to scale)... 91
Figure 4-2: Average Flux Spectrum at Peak Flux Trap ... 92
Figure 4-3: Guide to Assembly ID Numbers ... 94
Figure 4-4: Unperturbed Axial Power Shape in Hot Assembly... 95
Figure 4-5: Assembly Peaking Factors for 1/6 Core (center of core located in lower right corner)...95
Figure 4-6 Coolant Temperature Coefficient for Fresh Core... 98
Figure 4-7: Control Rod Worth Curve for Beginning of Cycle Core ... 101
Figure 4-8: Axial power shape for first cycle core at startup...102
Figure 4-9: Axial Flux Peaking, Assembly 1...102
Figure 5-7: Decay Heat Curve used to M odel Reactor SCRAM ... 121
Figure 5-8: Peak Clad Temperatures After LOF...122
Figure 5-9: M ass Flow Rate During LOF ... 123
Figure 5-10: Detail of M ass Flow Rate After Pump Coastdown...123
Figure 5-11: Cladding Temperatures for LOF with Increased Valve Height ... 124
Figure 5-11: Reactor Power During Ramp Reactivity Transient...126
Figure 5-12: Peak Clad Temperature During Ramp Reactivity Transient...127
Figure 5-13: Reactor Power During Step Reactivity Transient ... 128
Figure 5-14: Peak Cladding Temperature During Step Reactivity Transient ... 128
Figure 6-1 :Post-startup Xe-135 Reactivity W orth...133
Figure 6-2: Reactivity worth of Xe-135 after scram ... 134
Figure 6-3: Diagram of Assembly Positions...139
Figure 6-4: Plot of Cycle Reactivities...139
Figure 6-5: Spectra in Full Core ... 142
Figure 7-1: Mo-98 Radiative Capture Cross Section(red), and U-235 Fission Cross Section (green), E N D F 7 ... 1 4 9 Figure 7-2: Diagram of Cylindrical Targets [CM IPW HEU, 2009]. ... 151
Figure 7-3: M o-99 Activity vs. Fission Target Irradiation Time, 4.51 x 10¹⁴ fsn/s ... 152
Figure 7-4: Mo-99 Activity vs. Time for 7 Day Cycle at 4.51 x 10¹⁴ fsn/s, 10% Processing Losses...153
Figure 7-5: SiC displacement cross section [Greenwood, 2003]...157
Figure 7-6: Stainless Steel Cross Sections from Lindhard M odel [Doran, 1975]...157
Figure C-1: Diagram of configuration 1 core ... 247
Figure C-2:Diagram of core configuration 2 ... 248
Figure C-3: Diagram of core configuration 3 ... 249
Figure C-4:Diagram of core configuration 4 ... 250
Figure C-5: Diagram of core configuration 5 ... 251
Figure C-6: Diagram of core configuration 6 ... 252
Figure C-7: Diagram of core configuration 7 ... 253
Figure C-8: Diagram of core configuration 8 ... 254
Figure C-9: Diagram of core configuration 9 ... 255
Figure C-10: Diagram of core configuration 10 ... 256
Figure C- 1: Diagram of core configuration ... 257
Figure C-12: Diagram of core configuration 12 ... 258
Figure C-13: Diagram of core configuration 13 ... 259
Figure C- 14: Diagram of core configuration 14 ... 260
Table of Tables
Table 1-1:Table of US Research Reactor Conversion Dates ... 15
Table 1-2: Fluxes Necessary to Produce Medical Isotopes [IAEA, 1999] ... 19
T able 1-3: A T R C haracteristics ... 29
T able 1-4 : H F IR P roperties...31
T able 1-5: M U R R C haracteristics...32
T able 1-6: JH R C haracteristics ... 34
Table 1-7: MITR-II Characteristics ... ... ... 35
Table 1-8: Pool-type Plate Fueled Systems ... 37
Table 1-9: Tank-in-pool Plate Fueled Systems ... 38
Table2-1: Residence Time Required to Reach 95% Equilibrium Activity of Various Isotopes... 43
Table 2-2: Gains from Initial RERTR Dispersion Fuel Qualification [Muranka, 1983] ... 44
Table 2-3: Comparison of HEU and LEU Fuels [Rest, 2006] ... 46
Table 2-4: Summary of 7-Cylinder Core Findings ... 55
Table 2-5: Results of Initial Core Map Calculations ... 60
Table 2-6: Summary of Design Limitations ... 61
T able 3-1: T raining D ata L ocations...75
Table 3-2: Parameters for Kriging Routine Training Data ... 76
Table 3-3: Results of Training Data Generation...77
Table 3-4: Correlation Function Models Available in dace toolbox... 78
Table 3-5: Covariograms Generated for Peak Thermal Flux...81
Table 3-6: Covariograms Developed for Eigenvalue... 82
Table 3-7: Summary of Early Work on Globality ... 84
Table 3-8: Results of MATLAB Kriging Routine, with Neutronic Analysis by MCNP...86
Table 3-9: Loadings of 23 5 U in High Performance Research Reactor Fresh Cores [Bum, 1997]...87
Table 3-10: Potential Parameters for Kriging-Based Conversion Optimization... 88
Table 4-1: Revised Assembly Parameters ... 91
Table 4-2: R esults of Start-up Calculations ... 93
Table 4-3: In-assembly Heat Flux Peaking... 96
Table 4-4: Reactivity Parameters of Fresh Core... 98
Table 4-5: Composition of Borated Stainless Steel Control Blade... 99
Table 4-6: Results of Control Blade Thickness Study...100
Table 5-1: Optimum Assembly Geometry Resulting from Neutronic Analysis...105
Table 5-2: Nominal Channel Hydraulic Diameters after Neutronic Optimization ... 105
Table 5-3: Thermal hydraulic parameters from hand calculation...110
Table 5-10: Characteristics of Lumped Average Core Channel for RELAP model...117
Table 5-11: Steady State System Properties from RELAP-MOD3.3 ... 120
Table 6-1: Description of Fuel Management Operations Prior to Full Core ... 138
Table 6-2: EOC In-assembly Power Distribution, Cycle 1...141
Table 6-3: Tabulated Fluxes for Full and Fresh Cores ... 143
Table 7-1: Summary of Core Map Analysis ... 147
Table 7-2: Dimensions of Assumed LEU Mo-99 Production Target ... 151
Table 7-3: Summary of Mo99 Production Calculations ... 153
Table 7-3: Characteristics of the Major Mo-99 Production Reactors [CMIPWHEU, 2009]...154
Table 8-1: Kriging Algorithm Inputs, Outputs, and Constraints ... 162
Table 8-2: Summary of Optimum Homogeneous Assembly Characteristics ... 163
Table 8-3: Summary Table of Neutronic Properties...164
Table 8-4: Core Average Properties from RELAP5/MOD3.3...165
Table C-1: Average Fluxes for Configuration ... 247
Table C-2: Average Fluxes for Configuration 2...248
Table C-3: Average Fluxes for Configuration 3 ... 249
Table C-4: Average Fluxes for Configuration 4...250
Table C-5: Average Fluxes for Configuration 5 ... 251
Table C-6: Average Fluxes for configuration 6 ... 252
Table C-7: Average Fluxes for Configuration 7...253
Table C-8: Average Fluxes for Configuration 8 ... 254
Table C-9: Average Fluxes for Configuration 9...255
Table C-10: Average Fluxes for Configuration 10 ... 256
Table C-1 1: Average Fluxes for Configuration 11...257
Table C-12: Average Fluxes for Configuration 12...258
Table C-13: Average Fluxes for Configuration 13... 259
Table C-14: Average Fluxes for Configuration 14 ... 260
Abbreviations
ANS: American Nuclear Society
ANSI: American National Standards Institute
ATR: Advanced Test Reactor
DPA: Displacements per Atom GA: Genetic Algorithm
GDA: Great Deluge Algorithm
GTRI: Global Threat Reduction Initiative
HEU: Highly-enriched Uranium
HFIR: High Flux Isotope Reactor HFR: High Flux Reactor
HIV/AIDS: Human Immunodeficiency Virus/Acquired Immune Deficiency Syndrome IAEA: International Atomic Energy Agency
ID: Inner diameter
LEU: Low-enriched Uranium
LOF: Loss of Flow
MURR: Missouri University Research Reactor MLE: Maximum Likelihood Estimator
NRU: National Research Universal OD: Outer diameter
ONB: Onset of Nucleate Boiling PCA: Particle Collision Algorithm
RERTR: Reduced Enrichment Research and Test Reactors RIA: Reactivity Insertion Accident
SA: Simulated Annealing
Chapter 1 : Introduction, Background and Objectives
1.1Introduction
Research and test reactors are crucial tools for ongoing scientific experiments, testing of advanced reactor materials, production of medical isotopes and other industrial products, and education. In many of these facilities, the reactor fuel consists of highly enriched uranium (HEU) in order to permit compact core design and accordingly, high neutron flux. The Global Threat Reduction Initiative, the latest in a series of policies aimed at increasing the proliferation
resistance of nuclear fuel supply chains, mandates that all existing research reactors transition to the use of low-enriched uranium (LEU) [JAEA, 2004]. As such, dozens of research and test reactors have undergone this transition, with a few still awaiting the development and
qualification of new high density LEU fuel which will enable them to make the change without compromising their scientific missions. Table 1-1 provides a summary of research reactor conversion in the U.S.
All reactors which have undergone transition have endeavored to make the change via
"backfitting", with as few major modifications as possible: in most cases they have preserved the outer dimensions of their cores, or of their fuel assemblies, in order to obviate the need for upgrades to peripheral structures. As a result of this effort to reduce the expense of the
conversion process, the design spaces for the new cores are small, and many are not capable of achieving the same thermal fluxes with existing low-enriched uranium fuels that they could with existing highly enriched uranium fuels. Other existing LEU-fueled reactors suffer from economic
limitations. For example, the LEU-fueled McMaster University research reactor in Canada is licensed to operate at 5 MW and can produce thermal fluxes of up to 1 x 10¹⁴ n/cm2 s at that
power level. It does not operate at this power rating because its fuel costs are too high for operation at 5 MW to be economical. As a result, it operates at 2 MW and the scientific mission of the facility is compromised [Glaser, 2002].
Table 1-1:Table of US Research Reactor Conversion Dates
Reactor Date of Conversion
University of Michigan Ford Reactor 1984 Rensselaer Polyechnic Institute 1987
Ohio State University 1988
Worcester Polytechnic Institute 1988
Iowa State University 1991
Manhattan College 1992
University of Missouri, Rolla 1992
Rhode Island Nuclear Science Center 1993
University of Virginia 1994
University of Massachusetts, Lowell 2000
Purdue University 2007
University of Florida 2006
University of Wisconsin 2009
Oregon State University 2008
Texas A&M University 2006
Washington State University 2008
Massachusetts Institute of Technology ~2015*
University of Missouri and Columbia ~2015*
development, and an open-endedness to the research reactor problem not seen since the first generation of these systems was built, it would be possible to develop a research reactor core which has higher thermal flux than presently achievable in LEU research reactors. In this work, an innovative LEU research reactor core is designed, optimized for thermal flux, and analyzed to determine its potential as an irradiation facility.
1.2 Applications of Research Reactors and the Need for High Flux
Research and test reactors are utilized in scientific, industrial and educational facilities around the world and serve a broad spectrum of functions. Because each facility was designed with a unique combination of these functions in mind, there are roughly as many research and test reactor designs as there are research and test reactors. In general, research and test reactors serve one or both of two broad categories of functions: provision of education and training on reactor physics and safety or supply of a source of neutrons for one of a number of purposes. Reactors geared toward educational use are generally of low power (<1 MW), and are not optimized for high neutron flux. They are also frequently of TRIGA design, so that students are able to observe the various reactivity feedback mechanisms. Reactors which serve primarily as neutron sources often additionally serve secondary educational functions, but are designed with the goal of supplying high neutron flux in the energy range of interest to the irradiation or experimental facilities.
1.2.1 Material Testing
Testing of advanced materials is conducted in high fast neutron flux ($f>5x 10¹³ n/cm2s), since
thermal neutrons are too low in energy to cause atomic lattice displacements (displacement energies are typically on the order of eV or tens of eV [Lucasson, 1975]). These reactors also require an accompanying thermal flux in the neighborhood of 1x10'3 n/cm2s [IAEA, 1999].
These required fluxes are high because the fluences required for the production of observable effects in materials range between 1017 and 1021 n/cm2, and because of the irradiations must be
able to be completed in a manageable period of time. This fact has led to the design of reactors like the Jules Horowitz reactor, which is optimized for high fast flux at multiple experimental locations in the core [Bergamaschi, 2002].
Experiments which investigate the nature of materials, such as neutron radiography, small-angle scattering, interferometry, and diffractometry, require high thermal neutron flux outside the reactor core. Reactors such as HFIR and FRM-I were designed with compact cores surrounded
by beryllium as neutron reflector. Neutron beam tubes in their reflectors are extended through
the biological shielding and provide thermal neutrons to various instrument stations used for these experiments.
These beam tubes are also employed in radiography. Static radiography, which uses thermal neutrons to produce an image of a sample on a screen, needs low fluxes to be delivered via beamport. Low fluxes (~105 n/cm2s) are required in order to make the imaging time long enough
to be practical. Motion radiography, however, which images a moving sample in real time, requires a high power reactor to produce the needed fluxes (~106 n/cm2s), as the imaging time to achieve the required fluence is extremely short.
1.2.2 Neutron Capture Reactions
Most other activities, such as radioisotope production and activation analysis, are best performed in high thermal flux. All rely on absorption of neutrons by the target material, which is most probable at thermal energies. All additionally require the induction of a high level of activity in order to be proven useful. Radioisotope production clearly coincides with a high level of
discharge activity because these isotopes are valued for their level of specific activity. In similar fashion, the goal of activation analysis is to induce measurable gamma activity in a sample, so that the spectrum of the sample can be used to determine the elements present, and their
respective quantities. This is most efficient in high flux for all target materials, but in the case of isotopes which have long-lived (n,y) products, it becomes critical.
1.2.2. 1 The Medical Isotope Crisis
supply was so drastically cut that websites for health professionals started posting forecasts of the predicted supply in the coming weeks and months, assisting doctors in planning the
scheduling of procedures to coincide with supply. While the NRU (Canada) and HFR
(Netherlands) reactors, totaling 70% of the world supply, have returned to service, the status of the 99Mo supply, and its future, are unclear. This crisis led to several recent studies which highlighted the urgent need of securing reliable production facilities [CSSNM, 2007].
In addition to the instability of the 99Mo supply, researchers are also suffering from the shortage of other isotopes for investigations into new treatments for disease. Therapy research for
treatment of non-Hodgkins lymphoma and thyroid cancer using 131I has suffered stops and starts as the isotope becomes unavailable. The clinical trials of 225Ac in treatment of acute
myelogenous leukemia have been delayed or canceled as a result of shortages, and the same is true for experiments on the use of 67CU in treating lymphoma, 2 21At in destroying brain cancers,
and 213Bi in experimental treatment of HIV/AIDS. [Troyer, 2009]
Clearly a stable supply of several medical isotopes is required for the continued treatment of disease, and the advancement of clinical research. The need for high neutron flux in production of such medical isotopes can be illustrated through a simple mathematical exercise. When a stable target material is subjected to a constant rate R=i of production of a nuclide N, the amount of N present in the target goes as
Equation 1-1
R
N(t) = --(I1-e~'),
where A is the decay constant of the species N, and t is the irradiation time.
The activity thus available upon discharge and processing of the target is
Equation 1-2
A(r) = R(1 - e-'t)e--' = R(e--v - e-A'*)), where r is the time after discharge from the reactor.
A high rate of production is most effective at producing high residual activity at all values of 1.
However, it is absolutely crucial that species with high A be produced at high rates so that a high equilibrium inventory, R/I of radionuclide is attained. Only this will ensure that a useful quantity of the nuclide of interest remains after discharge, processing and transportation. Because the cross sections for the capture reactions of interest are highest in the thermal range, it is clear that
a high level of thermal flux must be available in order to maximize the quantity of radionuclide which can be delivered to a user. These facts have led the IAEA to set guidelines upon which
classes of reactors can be used to produce which medical isotopes via fission. These guidelines, which are listed in Table 1-2, indicate that fluxes of greater than 1014 n/cm2s are desirable if
isotope production is to be one of the major goals of a reactor's operation.
Table 1-2: Fluxes Necessary to Produce Medical Isotopes [IAEA, 1999]
Can be produced in $<1013 Can be produced in Can be produced in $>1014 103<$<10'4
24Na All of column 1 plus: All of columns 1 and 2 plus:
32 P 907 14t 3 8 c 99Mo S 36Mn 1251 51Cr 41 1311 6 0 co 6 4 Cu 13 3Xe 8 9Sr 198Au 1 Sm 169 Y 170 Tm 192 i
resistance. For these reasons, the goal of the present work is the design of a research reactor which:
1. Produces a maximum of 5 MW, the export control limit for research reactors stated in
l0CFR110
2. Operates at atmospheric pressure, in order to reduce construction cost
3. Has one or (preferably) more flux traps of 1" ID or greater, which provide an optimized
thermal flux of >1 x 10¹⁴ n/cm2s.
4. Is capable of operating in equilibrium cycles longer than 20 days, for high discharge fluence in targets
5. Uses proliferation resistant LEU fuel
6. Meets safety criteria laid out by NUREG- 1537
Because this long list of requirements renders optimization of the reactor computationally expensive, the present work will include development of a numerical optimization scheme for maximization of thermal flux within the relevant neutronic, mechanical, and thermal hydraulic limitations. This optimization scheme will be based on kriging, a geospatial technique which makes use of measurement uncertainty in predicting the values of response variables between measurement points. The technique is intended to push the design to its greatest potential while making efficient use of computational resources.
Further neutronic analysis will also be performed in order to assure that the reactivity feedback coefficients of the optimized system are negative, a crucial passive safety feature, and that this core's excess reactivity can be suitably managed over the course of operation. Thermal hydraulic analysis will be performed both before and after neutronic calculations in order to ensure that the core can be adequately cooled under both normal and transient conditions. Finally, the
applicability of the design to selected irradiation tasks will be assessed, to demonstrate the merits of the new design over existing reactors.
1.4Design Metrics for Evaluation of Current Designs
In order to assess the merits of currently available reactor designs in meeting the design objectives stated above, and identify areas for improvement, a set of design metrics was
developed. These design metrics are simple ratios of various system parameters which provide insight into the engineering aspects of maximizing peak thermal flux.
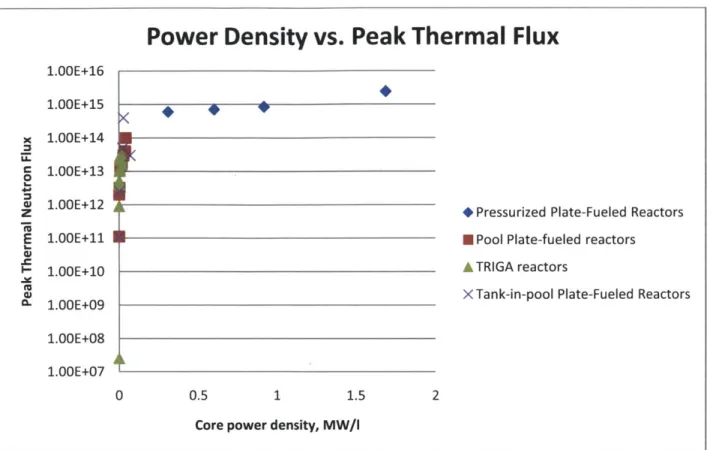
1.4.1 Power Density to Thermal Flux Ratio
It is intuitive that power density should scale directly with thermal flux as
Equation 1-3
q "'= w (<
Where q" '= power density, W/m3
w energy released per fission
Ef= macroscopic fission cross section,
cm-#-b
flux, n/cm2sThis is because the vast majority of heat produced in the reactor is a direct result of the fission reaction, with fission reaction rate being linearly proportional to the available flux and relevant cross sections. A plot of thermal flux vs. power density for U.S. research and test reactors (Fig.
1-1) shows considerable scatter in the data, with the ratio of thermal flux to power density
ranging by more than an order of magnitude. This indicates an important fact: because of the different tasks for which each reactor is optimized, the spectrum-averaged fission cross sections vary dramatically. As such, there is only a slight correlation, and not a linear relationship, between power density and thermal neutron flux for existing facilities.
The highest values of peak thermal flux occur for the pressurized reactors, which can operate at high power density due to the increase in saturation temperature. However, these reactors are also very compact, and do not have large moderated regions which permit the slowing of neutrons. As a result, the achievable thermal fluxes reach a plateau. The atmospheric-pressure systems display greater ratios of thermal flux to power density, meaning that small increases in
Power Density vs. Peak Thermal Flux
1.OOE+16 1.00E+15 x 1.OOE+14 C1.00E+13 01.00E+12 * Pressurized Plate-Fueled Reactors
E 1.00E+11 U Pool Plate-fueled reactors
1.00E+10 A TRIGA reactors
1.OOE+08 1.OOE+07
0 0.5 1 1.5 2
Core power density, MW/l
Figure 1-1:Plot of Power Density vs. Peak Thermal Flux in Various Classes of U.S. Research and Test Reactors
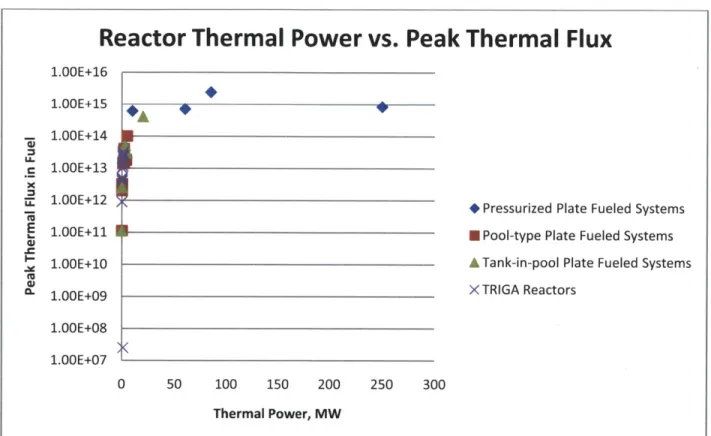
1.4.2 Power to Thermal Flux Ratio
A plot of thermal power to peak thermal flux (Fig. 1-2) demonstrates a strikingly linear trend up
to thermal powers of 10 MW. This makes sense, as most of the low power reactors are of similar size, meaning that their power densities scale with thermal power. Since the low power reactors are at atmospheric pressure, they all have approximately equal water densities, leading to less variation in their cross sections and therefore less scatter in the ratio between power and thermal flux than was found in the power density-thermal flux ratio. However, because the high-power reactors are subjected to a range of pressures, there is more scatter in their relevant cross section data.
While the pressurized reactors can sustain higher power density than their non-pressurized counterparts, there is an upper limit (a prescribed margin to incipience of boiling) at which core
power must increased by increasing the size of the core, rather than by further increasing power density. This produces the plateau shown in the figure.
The small, atmospheric pressure reactors clearly demonstrate the greatest peak thermal flux to power ratio. As stated in section 1.4.1, these reactors stand to produce the greatest improvement in flux per unit increase in thermal power. This supports the decision to design the concept with a maximum thermal power of 5 MW.
Reactor Thermal Power vs. Peak Thermal Flux
1.OOE+16 1.OOE+15 *A 1.OOE+14 U-1.OOE+13 X 1.OOE+12 *Pressurized Plate Fueled Systems
7i
E 1.00E+11 N Pool-type Plate Fueled Systems
1.OOE+10 A Tank-in-pool Plate Fueled Systems
1.00E+09 _ XTRIGA Reactors
1.00E+08
1.OOE+08
1.OOE+07
0 50 100 150 200 250 300
Thermal Power, MW
Figure 1-2: Plot of Reactor Thermal Power vs. Peak Thermal Flux for U.S. Research and Test Reactors
1.4.3 Operating Cycle Length and Available Fluence
Reactivity-limited operating cycles should be long, in order to minimize outage time, encourage fuel economy, and maximize availability of neutrons. The availability of neutrons, of course, is key in both ensuring that the facility fulfills its scientific mission, and in generating revenue
The maximum fluence on a target within the flux trap during an irradiation cycle likewise is an important parameter in assessing the merit of the design. For example, the greater the fluence on a medical isotope target, the greater the amount of isotope which makes it to market for sale. The greater the fluence on a material test specimen, the fewer the operating cycles needed to
complete an experimental campaign.
As shown in Tables 1-8 and 1-9 and section 1.4.6, long cycle lengths and multi-batch cores are not unique to either high-power or low-power reactors. However, those with the highest fluxes demonstrate the greatest difficulty in refueling and in keeping long cycle lengths. The issues with the HFIR and MURR will be discussed in detail in later sections.
1.4.4 Available Flux Trap Area
The available area of the flux trap(s) is also key in assessing the value of the design for both experimental and commercial irradiations. The irradiation area in the reactor presently under development will consist of one or more small flux traps, and as such, may be smaller than the area available in test reactors. Test reactors, which are routinely used to irradiate experimental fuel assemblies or heat transfer loops, are permitted by 1OCFR20 to have irradiation positions of size greater than 16 in 2, while research reactors are not.
Flux trap availability also ranges a great deal, but intuitively is lowest for the cores with highest power density. In order for the present design task to be successful, power density will need to remain high despite the presence of in-core irradiation positions. The use of new high-density fuel should go a long way in achieving this goal, but much will still depend on assembly geometry.
1.4.5 Heat Transfer Coefficient and Margin to Saturation Temperature
The hot spot heat transfer coefficient is crucial in limiting the permissible plate surface heat flux while maintaining a safe margin to incipience of boiling. The margin to incipient boiling is a
crucial safety parameter for reactor core design, since the presence of the vapor phase in narrow channels can lead to flow instability, and an inability to cool the fuel under both normal and transient conditions.
For the present work, the correlation by Bergles and Rohsenow [Todreas, 1990] is used to predict the heat flux at which incipient boiling occurs:
Equation 1-4
0-3pl156[ (T
2.83 / Po.0234 q"= 1.76x10³Pl.156 Tw - Ta,) ,
Where q "=heat flux in W/m2
Tw= wall temperature at point of incipient boiling, degrees C Tsat= saturation temperature, degrees C
P=pressure, Pa.
As it happens, this equation, like those derived from first principles, is undefined when Tw<Tsa, and the margin to incipient boiling cannot be calculated. In addition, the two unknowns in the equation, T, and q ", require another equation, 1-4.
Equation 1-5
q"= h(T, - T),
Where h is the heat transfer coefficient, calculated from operating data and one of a number of correlations. In order to find q "ONB for the systems under study, many parameters of the systems need to be either known or assumed. These parameters include channel geometry, mass flow rate, peaking factors, and axial power profile. Since these parameters are not made available by many reactors, and the use of assumptions could introduce considerable error, it is ill-advised to attempt calculation of the actual margin to incipient heat flux for these reactors.
Since
Equation 1-6
T,(z) = T,,+ q" f(z),
where Ti, = core inlet temperature, C
q "ave = core average heat flux, W/m2
f(z) = some shape function for the heat flux in the hot channel, m2*oC/W.
Some manipulation yields
Equation 1-7
qfi,ave Tat - Tn
where qi,a = the average surface heat flux needed for saturation temperature at the wall
Tw,max = the peak wall temperature at normal operating conditions
This method requires no assumptions about mass flow rate, peaking factor, or axial power profile, using only the Ti, and Tv, max reported in the Directory of U.S. Research Training and
Test Reactors [Bum, 1997.].
Nearly all of the low power reactors display large margins to Tw=Tsa, indicating that their power densities (and therefore thermal fluxes) could be increased significantly without changes to fuel design. This observation is validated by power uprate applications of TRIGA reactors, and most recently the 20% power uprate from 5 MW to 6 MW of the MITR.
1.5 Comparison of Selected Reactors
In order to ensure that these performance metrics do indeed yield good values for reactors with favorable characteristics, they are applied to selected reactors, and compared with the general body of research reactors.
1.5.1 Advanced Test Reactor
The Advanced Test Reactor is located at Idaho National Laboratory, and has a licensed power rating of 250 MWth. Its actual operating power level depends on customer requirements. Its core
the desired position to produce different power levels in each of the core's four lobes. These drums have the added benefit of producing a relatively flat axial power profile, compared with reactors controlled by axial insertion of rods.
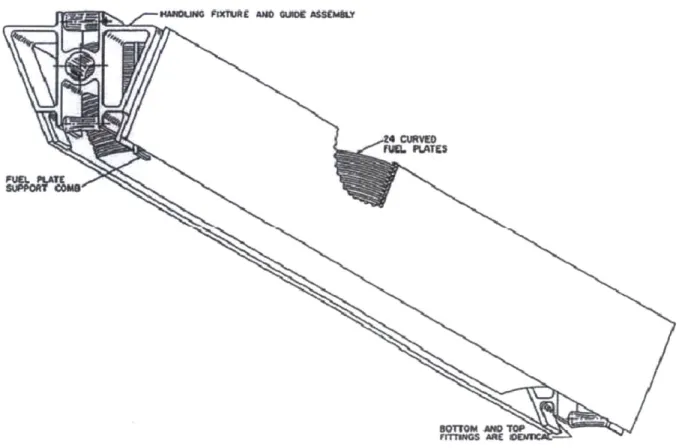
The ATR core consists of 40 curved-plate HEU fuel assemblies, arranged in a cloverleaf pattern to provide multiple high-flux regions at the center of the core and at the center of each lobe. Eight flux trap locations are available for materials testing, and a total of 77 irradiation facilities provide a range of fast-to-thermal flux ratios for either testing or irradiation purposes. The largest
'A" Positions B" Positions "H" Positions Fuel assembly Flux trap guide tubes Neck shim rods
Neck Shim Rod Housing Control drums In-pile tubes Irradiaton Tank "I" Positions
The pertinent features and performance metrics of the ATR are shown in Table 1-3.
Table 1-3: ATR Characteristics
Power, MWth 250
Peak thermal flux, n/cm2s 8.50 x 10¹⁴
Thermal flux to power density 9.25 x 10¹⁴
ratio, (n/cm2s) /(MWth/m2
Thermal flux to power ratio, 3.40 x 10¹² (n/cm2s)/MWth
Cycle Length, d 15-40, varies
Available fluence per cycle, 1.10 x 10²¹ - 2.94 x 10²¹
n/cm2
Available flux trap area, cm2 1392.683
q"i,ave/q"ave 1.49
As can be seen in the table, the reactor delivers a high thermal flux, but the decoupling of the different lobes of the reactor core results in a low thermal flux to power ratio. The cycle length also ranges broadly depending on how the reactor is used during a given period. However, it does provide a massive total flux trap area, and very high fluence with each operating cycle. This
high fluence per cycle, combined with the large area in which this fluence can be attained, make
the ATR the nation's premier irradiation facility.
1.5.2 High Flux Isotope Reactor
The High Flux Isotope Reactor is operated by Oak Ridge National Laboratory. The reactor consists of two fuel elements, with HEU involute plates, which produce coolant channels of constant thickness. This, together with tapered fuel meat, allows for an extremely compact core with low power peaking. The core is cooled by pressurized water and reflected by beryllium. The reactor operates at power levels of up to 85 MW, providing high thermal fluxes to irradiation
Target Bundle-In Flux T rp -0 -0 toO Horizontal
Beam Tube HO-2 Large Removable
Beryllium Facility (PIS*) Peripheral "1-Targe O Small Vertical Experiment Facility (VXF)
inner Fuel Elemoent n ma Largo Vertical
Outer Fuel Element Experinment Control Region 0 2 4 6 Fclt VF
Inches
Figure 1-4: Cross Section of HFIR Reactor and Experimental Facilities, [HFIR Reactor Assembly, 2010]
-~ - - (Aft"'
Table 1-4: HFIR Properties
Power, MWth 85
Peak thermal flux, n/cm2s 2.40 x 10" Thermal flux to power density 1.42 x 101
ratio, (n/cm2s) /(MWth/m2)
Thermal flux to power ratio, 2.82 x 101
(n/cm2s)/MWth
Cycle Length, d 22
Available fluence per cycle, 4.56 x 10⁷
n/cm2
Available flux trap area, cm2 126.677
q"i,ave/q"ave 0.748
The reactor has one of the highest thermal flux to power density ratios in existence, as the core is extremely compact, encroaching upon the incipient boiling limit. With its fuel design come a number of problems like short cycle length, high fuel cost, and small available flux trap area.
1.5.3 Missouri University Research Reactor
The 10 MW reactor operated by the University of Missouri-Columbia is the highest-power research reactor operated in a university setting. The core, a ring of HEU curved plate
assemblies, is moderated and cooled by pressurized light water, and reflected by graphite and beryllium. Services performed by the facility include activation analysis, neutron and gamma
-Humemm 90Mhot Au 0u"t atndLM.
. E
RW. "LT93
W M I TO vu~FIIIs ME 0
Figure 1-6: Schematic of MURR Fuel Assembly [McKibben, 20061.
Table 1-5: MURR Characteristics
Power, MWth 10
Peak thermal flux, n/cm2s 6.00 x 10¹⁴ Thermal flux to power density 1.96 x 10¹⁵
ratio, (n/cm2
s) /(MWth/m2)
Thermal flux to power ratio, 6.00 x 10³ (n/cm2s)/MWth
Cycle Length, d 7
Available fluence per cycle, 3.62 x 10²⁰
n/cm2
Available flux trap area, cm2 34.023
q"i,ave/g"ave 1.394
The reactor has an extremely high thermal flux to power ratio, and one of the highest thermal flux to power density ratios in existence. As a result of the cylindrical design, the available flux trap area is small and excess reactivity is extremely low, leading to short cycle lengths. The core
has considerable margin to ONB, but power cannot be increased without relicensing as a test reactor rather than a research reactor.
1.5.4 Jules Horowitz Reactor
The Jules Horowitz Reactor, currently under construction, is intended by Cadarache to replace the aging OSIRIS reactor, and to ensure availability of a high-flux irradiation facility to
European experimenters. Because the reactor is intended to be used primarily for materials testing and qualification, with some flexibility for other experiment, its spectrum is considerably harder than that of the other reactors under study.
The proposed pool-type core design consists of curved LEU fuel plates assembled into
cylindrical elements, with concentric cylinders producing an array of flux traps, and is reflected
by light water and Be. The reactor is expected to operate at 100 MW, and generate very high
fluxes for advanced materials testing.
3-6 curved fuel Opes
Stiffeners
Places for specific
experimental devices
Aluminiun
Place for control ro
Alloy core rack
or experimental devi
Table 1-6: JHR Characteristics
Power, MWth 100
Peak thermal flux, n/cm2s 2.40 x 10¹⁴
Thermal flux to power density 1.22 x 10 ratio, (n/cm2s) /(MWth/m3)
Thermal flux to power ratio, 7.3 x 10"
(n/cm2s)/MWth
Cycle Length, d 26
Available fluence per cycle, n/cm2 5.39 x 10²
Available flux trap area, cm2 345.90
q"i,ave/q"ave 0.723
The reactor, intended primarily for materials testing, has a faster spectrum than most of the other reactors described here. Its thermal flux to power and thermal flux to power density ratios are quite low, but the multi-cylinder concept provides a sizable total flux trap area, and, if the spectrum were more thermal, would produce a high thermal fluence per cycle.
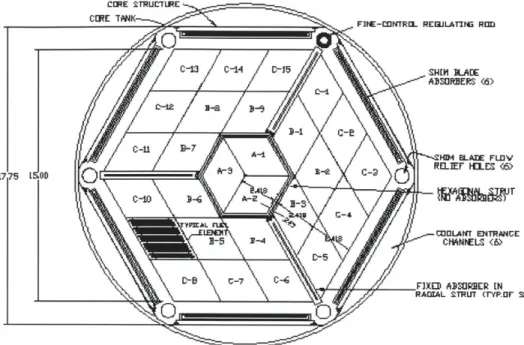
1.5.5 Massachusetts Institute of Technology Reactor- II
The second generation of the MIT Reactor operates at 4.9 MW (approval for a 6MW uprate was obtained in 2010), and produces a thermal flux-to-power ratio 70% lower than desired for the current design task. Nevertheless, it is instructive to study the MITR-II, as it is not pressurized, has roughly the same power level desired for the current design task, and is about to begin conversion to LEU fuel.
The core typically consists of between 24 hexagonal HEU plate-type fuel assemblies, with the remaining 3 positions left available for irradiation. The system is cooled and moderated by light water, and reflected by heavy water. A secondary graphite reflector is home to a number of vertical thermal neutron irradiation facilities.
The reactor performs a range of tasks, including education, commercial semi-conductor doping, materials testing, and in the past, boron neutron capture therapy clinical trials.
Figure 1-8: Top view of MITR-II core [Newton, 20061
Table 1-7: MITR-II Characteristics
Power, MWth 4.9
Peak thermal flux in fuel, 3.00 x 10¹³
n/cm2s
Thermal flux to power density 4.37 x 10¹⁴
ratio, (n/cm2s) /(MWth/m2)
Thermal flux to power ratio, 6.12 x 10¹² (n/cm2s)/MWth
Cycle Length, d 75
Available fluence per cycle, 1.94 x 10²⁰
n/cm2
Available flux trap area, cm2 41.047
q"i,ave/q"ave 2.286
The reactor does not produce a high thermal flux to power density ratio. Additionally, it suffers from small in-core irradiation area. Nevertheless, it operates in long cycles and has a large
1.5.6 Performance metrics of other reactor designs
The suitability of the high power reactors can be assessed by comparing them with the design metrics of other plate fueled systems. TRIGA reactors are discounted here because their poor heat transfer properties render wholly them incapable of supplying the power densities needed to attain the desired flux. Each of the high power reactors produce high thermal flux, often in excess of 101 n/cm2s. However, these reactors consistently underperform low-power reactors in the thermal flux-to-power ratio, which indicates an upper bound on neutron flux, despite power increase. The optimum thermal flux-to-power density ratio occurs around 5 MW with the
MITR-II, though some of the lower power reactors listed in Table 1-9 achieve similar values, but with lower neutron flux. It can be expected that a design of this type would be able to
dramatically increase its peak thermal flux delivered with increases in power density. Such a compact design should be achievable because of the large margin to onset of nucleate boiling.
Table 1-8: Pool-type Plate Fueled Systems
Parameter McMaster Rhode ACRR FTR UMass Ford- Missouri- Virginia WPI
Island Lowell UMich Rolla
Power, MWth 5 2 4 0.1 1 2 0.2 2 0.01
Peak thermal flux in 1.OOE+14 4.OOE+13 1.80E+13 2.OOE+12 1.40E+13 1.50E+13 3.24E+12 3.00E+13 1.12E+11
fuel, n/cm2s
Thermal flux to 2.40E+15 1.06E+15 1.02E+15 2.80E+15 1.76E+15 1.27E+15 1.11E+15 1.06E+15 1.01E+15
power density ratio, (n/cm2s)
/(MWth/m2
)
Thermal flux to 2.OOE+13 2.OOE+13 4.50E+12 2.OOE+13 1.40E+13 7.50E+12 1.62E+13 1.50E+13 1.12E+13
power ratio,
(n/cm2s)/MWth
Cycle Length, d 30 730 Lifetime Lifetime Lifetime 150 Lifetime Unknown Lifetime
Available fluence 2.59E+20 2.52E+21 NA NA NA 4.20E+19 NA NA NA
per cycle, n/cm2
Available flux trap 27.1066 256.8507 408.2814 2.865211 58.05977 121.1959 30.78148 50.67075 Unknown
area, cm2
Table 1-9: Tank-in-pool Plate Fueled Systems
Parameter Brookhaven Medical NIST General Electric Test Iowa State
Reactor
Power, MWth 3 20 0.1 0.01
Peak thermal flux in fuel, 4.84E+13 4.OOE+14 2.50E+12 1.OOE+11
n/cm2s
Thermal flux to power density 2.04E+15 1.43E+16 9.50E+14 8.78E+14
ratio, (n/cm2s) /(MWth/m2)
Thermal flux to power ratio, 1.61E+13 2.OOE+13 2.50E+13 1.00E+13
(n/cm2s)/MWth
Cycle Length, d 365 49 Lifetime Lifetime
Available fluence per cycle, 1.53E+21 1.69E+21 NA NA
n/cm2
Available flux trap area, cm2 34.38253 637.9485 126.6769 110.6132
1.6Summary
Existing HEU research reactors are in the process of undergoing conversion to LEU. As a result of this conversion process, the reactors have been left with non-optimized peak thermal fluxes in order to fill the same physical footprints as their HEU predecessors. With new fuel materials and without constraints on core footprint, research reactor cores can be designed for optimal thermal flux and for versatility, helping them achieve ever-changing research goals. The goal of the present work is the design of a small research reactor which meets GTRI goals, maintains all applicable safety limits under transient conditions, makes effective use of the uranium resource, and meets experimental needs. Optimization of the concept will make use of a kriging-based algorithm previously untested in nuclear reactor design. Investigations of existing reactors indicate that the most promising design will have a rated power of 5 MW, and have an extremely compact core similar to that of the MITR-II.
1.7 References
Y. Bergamaschi, Y. Bouilloux, P. Chantoin, B. Guignon, X. Bravo, C. Germain, M. Rommens, P. Tremodeux, "Jules Horowitz Reactor, Basic Design", Proceedings of 2002 International Meeting on Reduced Enrichment for Research and Test Reactors, Bariloche, Argentina, November 3-8 2002.
R. Burn, ed. Directory of Operating Research, Training, and Test Reactors in the United States
ofAmerica, 4th edition. United States Department of Energy, 1997.
Committee on the State of the Science of Nuclear Medicine, Advancing Nuclear Medicine
Through Innovation, National Research Council, 2007.
R. Ellis, J. Gehin, G. Ilas, R. Primm, "Neutron Physics of an LEU U-Mo Fueling Study for the High Flux Isotope Reactor". Online. [Available]
http://www.ornl.gov/-webworks/cppr/y200 1/pres/125583.pdf . Accessed July 14, 2010.
A.Glaser, "The Conversion of Research Reactors to Low-Enriched Fuel and the Case of the FRM-II", Science and Global Security: The Technical Basis for Arms Control, Disarmament,
"HFIR Reactor Core Assembly". Online. [Available]
http://neutrons.oml.gov/facilities/HFIR/reactorassembly.shtml accessed July 14, 2010 International Atomic Energy Agency, "The Applications of Research Reactors,"
IAEA-TECDOC-1234, October 1999.
International Atomic Energy Agency, "IAEA Welcomes U.S. New Global Threat Reduction Initiative", Online. [Available]
http://www.iaea.org/NewsCenter/News/2004/GTRI Initiative.html May 27, 2004.
P. Lucasson; M. Robinson, F. Young, ed., "The Production of Frenkel Defects in Metals,"
Fundamental Aspects ofRadiation Damage in Metals, Oak Ridge National Lab, 1975.
J. McKibben, K. Kutikkad, L. Foyto, "Current Status of the Missouri University Research
Reactor HEU to LEU Conversion Feasibility Study", Proceedings of 2006 RERTR International Meeting, Cape Town, South Africa, October 29-November 2, 2006.
N. Todreas, M. Kazimi, Nuclear Systems I: Thermal Hydraulic Fundamentals, Taylor & Francis, 1990.
G. Troyer, R. Schenter, "Medical Isotope Development and Supply Opportunities in the 2 1" Century," Journal of Radioanalytical and Nuclear Chemistry, 2009.
Chapter 2 : Proposed Designs and Analysis Methods
2.1 Introduction
As in any design task, there exist a number of limits upon the potential design of the research reactor under study. These limits have a number of different sources: some are regulatory, others introduced for the purpose of maintaining adequate heat transfer or utility of the neutron flux. Still others are driven by mechanical requirements for construction of the fuel assemblies and later operation of the reactor. These limits, combined with the objectives listed in Chapter 1, drove the design choices made, and permitted the rejection of several early reactor core concepts. These concepts, the limits which led to their rejection, and the codes used to analyze them and their successor are detailed in this chapter.
2.2 Design Limits
2.2.1 Neutronic Limits
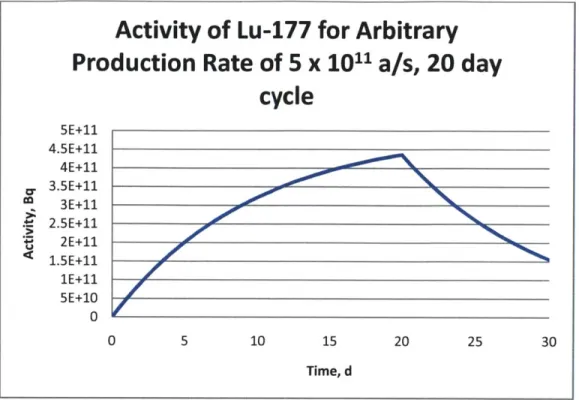
The equilibrium beginning-of-cycle core must be critical and have sufficient excess reactivity to compensate for the effects of fission product poisoning and fuel burnup in order to permit a long interval between refueling outages. This is necessary because it leads to a high capacity factor for material irradiations, educational use, and beamline experiments. In addition, it allows for
Activity of Lu-177 for Arbitrary
Production Rate of 5 x 10¹¹ a/s, 20 day
cycle
5E+11 4.5E+11 4E+11 3.5E+11 C 3E+11 . 2.5E+11 ' 2E+11 1.5E+11 1E+11 5E+10 0 0 5 10 15 20 25 30 Time, dFigure 2-1: Plot of Lu-177 (t1 12=6.734 d) Inventory for Arbitrary Production Rate of 5x10" /s, with Discharge from
Reactor at 20 d
In order to illustrate this point further, one can examine how long it takes for various popularly used medical isotopes to approach equilibrium concentrations. If the discharge activity of a radioisotope is given by
Equation 2-1
A = R
(1-
e -)
where R = production rate, nuclei/s
A= decay constant, s-1
t = irradiation time, s
Equation 2-2
0.99 = 1
j0.05
The time required for twelve common radioisotopes to reach 95% of equilibrium is displayed in Table 2-1. As can be seen, many isotopes, including the highly desirable 99Mo, come to
equilibrium in under four weeks. Others take significantly longer, on the order of multiple refueling cycles. For the purposes of the present work, it is required that the equilibrium operating cycle be longer than 20 days, in order to ensure that the most possible isotope can be discharged, and that material samples can sustain high fluence during each cycle. Longer cycles may also be acceptable, as fresh targets can be exchanged for spent ones during an operating cycle.
Table2-1: Residence Time Required to Reach 95% Equilibrium Activity of Various Isotopes
Isotope Half life (d) Time to reach 95% equilibrium (d) 99Mo 2.75 11.88 131I 8.04 34.74 1Xe 5.25 22.69 89Sr 50.5 218.25 I92r 73.8 318.95 '5 3Sm 1.95 8.42 186Rh 3.78 16.33 1251 60.1 259.74 90Y 2.67 11.53 169Er 9.4 40.62 17 7Lu 6.71 29.00 16 6Ho 1.12 4.84
In addition to the cycle length requirement, the core must also be undermoderated, so that losses of moderator, or decreases of moderator density, insert negative reactivity. Fuel volume fraction

![Figure 1-4: Cross Section of HFIR Reactor and Experimental Facilities, [HFIR Reactor Assembly, 2010]](https://thumb-eu.123doks.com/thumbv2/123doknet/14680911.559238/30.918.170.774.107.507/figure-cross-section-reactor-experimental-facilities-reactor-assembly.webp)

![Figure 2-3: Diagram of Predictor-Corrector Sequence Algorithm Used by ORIGEN-S, [ORNL, 2009]](https://thumb-eu.123doks.com/thumbv2/123doknet/14680911.559238/52.918.111.780.106.432/figure-diagram-predictor-corrector-sequence-algorithm-used-origen.webp)
