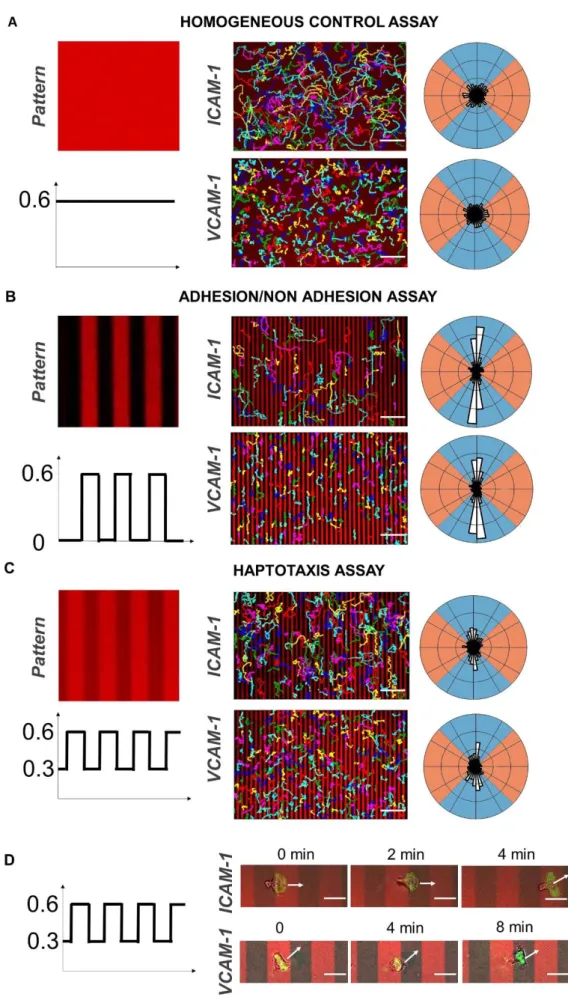
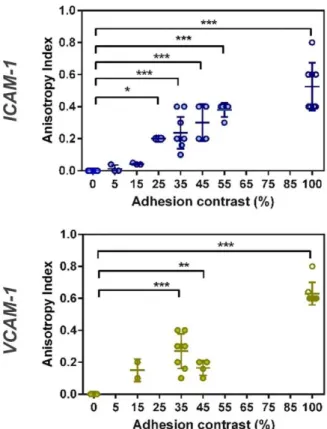
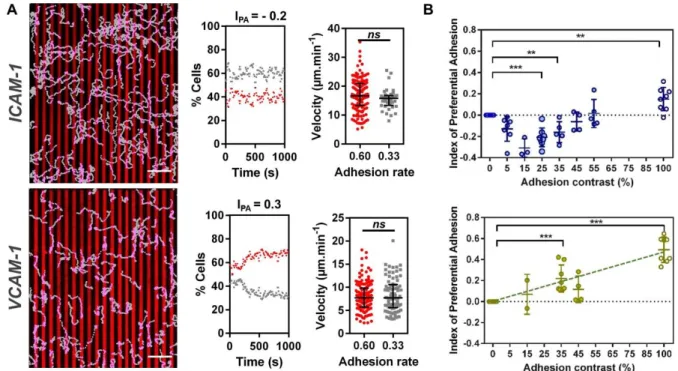
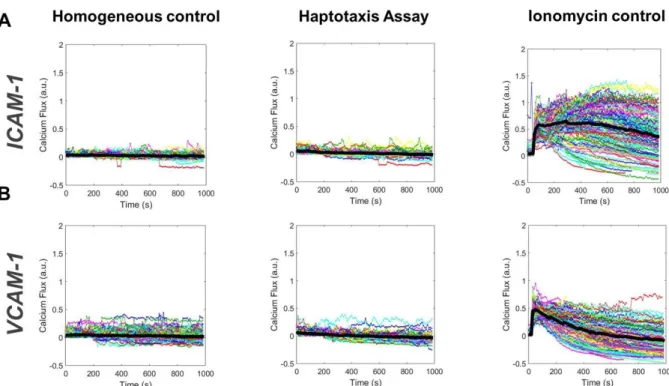
Lymphocytes perform reverse adhesive haptotaxis mediated by LFA-1 integrins
Texte intégral
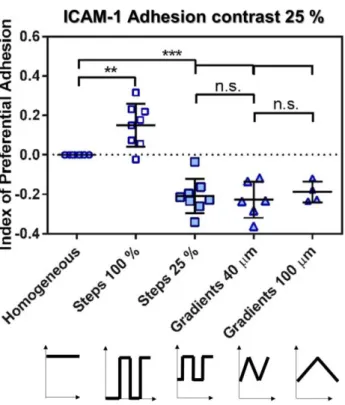
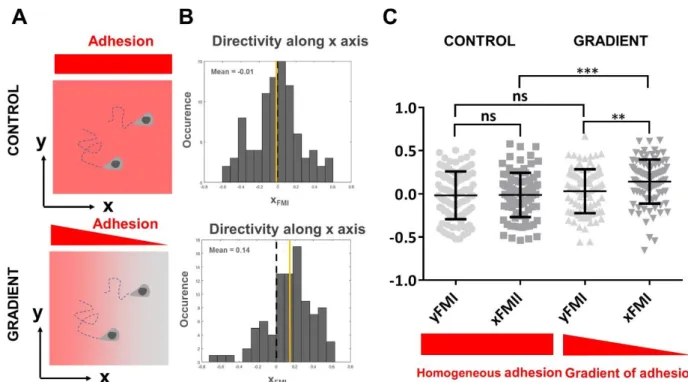
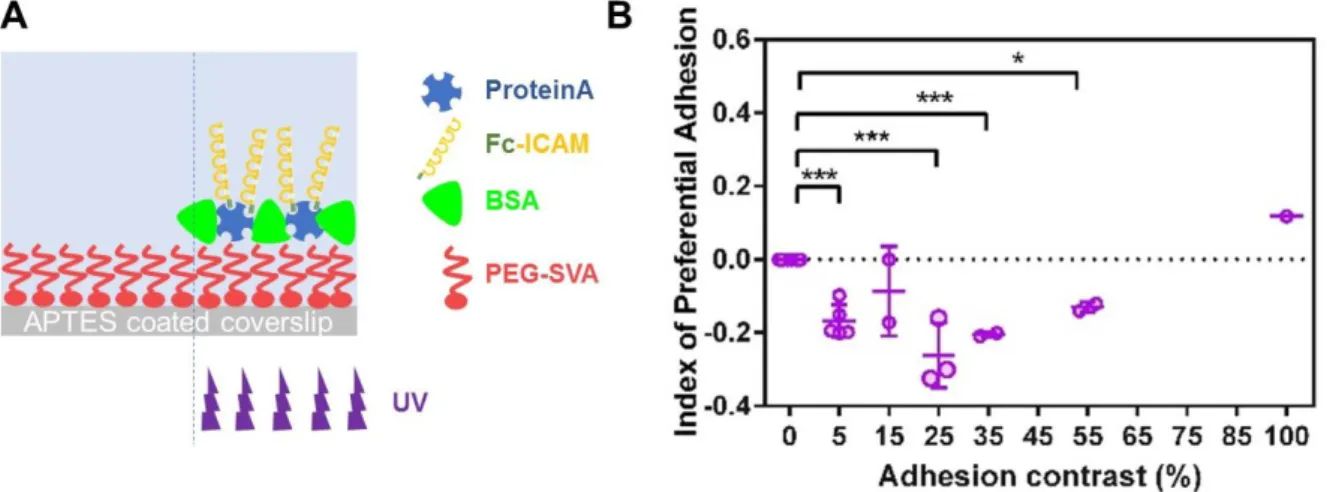
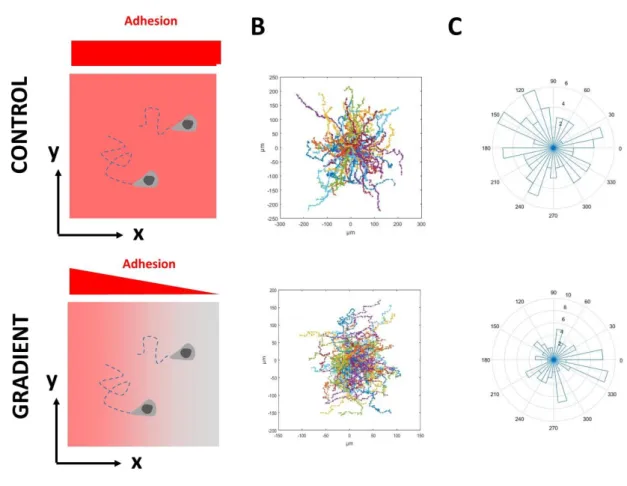
Figure


Documents relatifs
C’est cette souffrance qui s’institue comme « motif » récurrent dans l’œuvre qui constitue tout le savoir de l’auteur concernant la relation que tout sujet entretient dans
This has already been succesfully applied to the second order formula- tion of the acoustic wave equation and we focus here on the first order formulation of acoustic and
Hier zeigte sich, dass Ki-67 für die Abgrenzung des nichtdysplastischen Epithels (durch- schnittliche Proliferationsrate: 13%) von CIN1 (durchschnittliche Proliferationsra- te:
Une semaine avant l’enregistrement des données les enseignants ont tous reçu un album jeunesse traitant de la thématique « Qu’est-ce qu’un ami ? » Ce choix a été fait en
We demonstrate for the first time that Dectin-1 expressed on the surface of M cells acts as a receptor involved in SIgA reverse transcytosis both in vitro and in vivo..
Activités du Centre MITIC interjurassien dans le domaine de l'intégration des technologies, des médias et de l'image à l'école obligatoire, selon le contrat du 1 er mars 2007
Here, a simple conceptualization through a 2-D vertical model is used to test whether (i) ignoring microforms in groundwater models at the macroform scale can impact estimations
In this case, the laser pump excites the titanium film and, through a thermoelastic process, leads to the generation of picosecond acoustic pulses that propagate within the copper
