HAL Id: hal-01338109
https://hal.archives-ouvertes.fr/hal-01338109v2
Submitted on 1 Jul 2016
HAL is a multi-disciplinary open access
archive for the deposit and dissemination of
sci-entific research documents, whether they are
pub-lished or not. The documents may come from
teaching and research institutions in France or
abroad, or from public or private research centers.
L’archive ouverte pluridisciplinaire HAL, est
destinée au dépôt et à la diffusion de documents
scientifiques de niveau recherche, publiés ou non,
émanant des établissements d’enseignement et de
recherche français ou étrangers, des laboratoires
publics ou privés.
Memory Carving in Embedded Devices: Separate the
Wheat from the Chaff
Thomas Gougeon, Morgan Barbier, Patrick Lacharme, Gildas Avoine,
Christophe Rosenberger
To cite this version:
Thomas Gougeon, Morgan Barbier, Patrick Lacharme, Gildas Avoine, Christophe Rosenberger.
Mem-ory Carving in Embedded Devices: Separate the Wheat from the Chaff. 14th International Conference
on Applied Cryptography and Network Security (ACNS 2016), Jun 2016, Guilford, United Kingdom.
�10.1007/978-3-319-39555-5_32�. �hal-01338109v2�
Memory carving in embedded devices:
separate the wheat from the chaff
Thomas Gougeon1, Morgan Barbier1, Patrick Lacharme1, Gildas Avoine2,3,
and Christophe Rosenberger1
1 Normandie Univ, ENSICAEN, UNICAEN, CNRS, GREYC, 14000 Caen, France 2
INSA Rennes, IRISA UMR 6074
3 Institut Universitaire de France
Abstract. This paper investigates memory carving techniques for em-bedded devices. Given that cryptographic material in memory dumps makes carving techniques inefficient, we introduce a methodology to dis-tinguish meaningful information from cryptographic material in small-sized memory dumps. The proposed methodology uses an adaptive boost-ing technique with statistical tests. Experimented on EMV cards, the methodology recognized 92% of meaningful information and 98% of cryp-tographic material.
Keywords: forensics, memory carving, randomness, embedded devices, smart-cards, privacy.
1
Introduction
Embedded devices usually gather and store personal data about the behaviours of their holders. They are typically low-cost devices including (but not limited to) credit cards, mass transportation passes, electronic passports, keyless entry and start systems, and ski passes. They usually gather and store a lot of personal data, for example an electronic passport contains the identity and the picture of its holder [2], a mass transportation pass may store the last trips of its holder [4], a ski pass may also contain the location of the ski lifts the skier used [21], an EMV card records the last payments done by the customer [8], a car ignition key in recent vehicle contains plenty of information about the car and the behaviour of the driver, including the monthly fuel consumption, the external temperature during the last trip, and the average engine speed. In most cases, the personal data contained in these devices are accessible without requiring any authentica-tion, and can be obtained using, for example, the ISO/IEC 7816 interface or by sniffing a genuine communication between the device and a reader.
Interpreting the meaning of the captured raw data is hard when the system specifications are not available. However, such a task is important today when investigations must be carried out. It can be to find digital evidence for example in connection with criminal investigations – when information related to a sus-pect is stored in a device – or to verify that a system complies with the national privacy regulations.
A large body of literature exists in the field of memory forensics. Many off-the-shelf tools exist, too. The analyses typically focus on hard drives [18] and volatile memories [3]. Analyses of hard drives are typically based on file carv-ing, i.e. a technique that consists in searching for files in the considered data. The main difficulty is the file fragmentation in the system. File carving is conse-quently performed using machine learning techniques, the entropy of the blocks, or the file headers and footers. The technique targets specific file formats, e.g., PDF, ZIP [5], or file systems such as NTFS [26]. Analyses of volatile memories consist in searching for special strings or signatures, interpreting internal kernel structures, or enumerating and correlating all page frames, in order to retrieve running and terminated processes, open ports, sockets, hidden data, etc.
The analysis of the non-volatile memory of an embedded device differs from classical memory forensics techniques for several reasons. (i) First of all, the memory typically consists of a few kilobits only. (ii) The data available in these devices are poorly structured: in most cases, there are no file headers, sentinels, or field separators. (iii) Home-made encoding systems are commonly used in practice to save memory or to naively hide information. (iv) Performing a bit-by-bit copy of the memory is rarely possible because the only way to access the memory is to use the application program interface (API) or to eavesdrop a genuine communication. This means that the captured data is not necessarily a perfect copy of the memory.
A naive technique to interpret data retrieved from embedded devices (called a dump) consists in applying several encoding functions to the dumps until retrieving the correct one for each information stored. Due to the nature of the dumps, there is unfortunately no oracle that can efficiently determine whether the decoding of the information is correct. As a consequence, the technique outputs many false positives that renders it unusable in practice. Most existing contributions on the memory carving problem for embedded devices consider ad-hoc, hand-made analyses, e.g., for retrieving keys hidden in an EEPROM [6]. There exist few techniques designed for an automatic analysis of embedded devices. A seminal work, though, is due to Ton Van Deursen et al. [25], who investigated the memory carving problem for sets of memory dumps, and ap-plied it to public transportation cards. It is worth noting that they obtained the memory dumps using the API of the cards, meaning that there is no guarantee that the dumps are indeed bit-by-bit copy of the memory. The authors aimed to singulate the memory data fields using the concept of commonalities and dissim-ilarities applied to a dump set. A commonality occurs for a given bit position if the value of the bit is the same for all the dumps of a given set, whereas a dissim-ilarity occurs otherwise. Using these commonalities and dissimilarities, as well as contextual information (as data printed on the coupon), the technique deduces the data fields. Once the data fields are singulated, a manual investigation is needed to retrieve the encoding function. The authors applied their technique to the E-Go System (the public transportation card in Luxembourg) and retrieved a dozen of fields, e.g., the date and time of the last validation. Their work does not provide an automatic interpretation of the data and it requires contextual
information to complete the analysis. Another work related to ours is due to Jean-Louis Lanet et al. [14], who investigated the reverse engineering of EEP-ROM in Java Cards. They aim to retrieve the location of the source code and data related to the language(package, class, instance . . . ). The index of coinci-dence [10] is used to locate the source code. This approach is not very efficient, though. Still worse, in our case, real-life dumps are generally generated using several (unknown) encoding functions. This makes the calculation of the index of coincidence meaningless. To retrieve the data related to the language [14] uses a pattern matching technique applied to the headers (or metadata), which differ for each type of data. Unfortunately, there is neither header nor metadata in our dumps.
Given the difficulty to retrieve personal data from the memory dump of an embedded device, this work focuses on a narrower problem that consists in distinguishing meaningful information (encoded with ASCII, BCD, etc.) from cryptographic material (ciphered data, hash value, secret key, etc.). The ratio-nale behind this restriction is that cryptographic materials generate many false positives and no personal information can be obtained from these values, assum-ing the algorithms used to create the materials are cryptographically secure. As a consequence, we introduce a technique that separates the wheat from the chaff, namely a preliminary step in the forensics process that distinguishes meaningful information from cryptographic materials, considered as random data. Unfortu-nately, the size of the considered dumps does not allow to naively use classical tools (e.g., NIST’s statistical tests [19]) that usually require several kilobytes of data to make the statistical tests relevant. Moreover, the tests cannot be di-rectly applied to the data because the considered dumps contain data fields, which must be analysed separately. For the same reason, techniques for locat-ing cryptographic keys hidden in gigabytes of sparse data, proposed by [20] and based on the entropy computation, are not possible on such dumps.
This paper introduces a statistical and automatic recognition technique that distinguishes meaningful information from cryptographic material, obtained from non-volatile memory dumps of embedded devices. The technique, based on a machine learning method, called boosting [9], requires information neither on the dump structure, nor on the application context, for the classification between these two sets of data. The technique is then improved by comparing dumps of different devices belonging to the same application. Our technique reaches quite a high success rate: we applied it to EMV-based dumps and Calypso-based dumps, obtaining a 99% success rate.
2
Dump examples
To illustrate the problem considered in this paper, Section 2 provides details on two dumps extracted from EMV and Calypso cards. The cards contain elemen-tary files that have been retrieved using the cards’ APIs. The files are made of records. Files can be linear fixed (linear data structure of fixed length), lin-ear variable (linlin-ear data structure of variable length), or cyclic (oldest data are
erased to store newest data). The information is contained in (non-necessarily contiguous) fields, e.g., holder’s name, holder’s zip code, a cryptographic key, etc. A pedestrian approach has been used to analyse the dumps, given that there does not exist automatic tools that can achieve this task.
2.1 EMV dump
Figure 1 is a (partial) anonymised dump of a credit card compliant with the EMV specifications [8]. Each numbered line represents a record. The underlined sequences are fields that contain the holder name, the issuer’s public key mod-ulus, the amount, and the date of the last transactions.
1. 9F3602004D 2. 9F13020046 3. 9F170103 4. 9F4F109F02069F27019F1A025F2A029A039C01 5. 70615F201A4A4F484E2F534D4954482E4D52202020202020202020202020205F300202018C1B9F02069F03069 F1A0295055F2A029A039C019F37049F45029F4C088D1A8A029F02069F03069F1A0295055F2A029A039C019F37 049F4C08 6. 9F49039F3704701A5F25030911015F24031003315A0849750000075922345F340100 7. 70369F0702FF008E0E0000000000000000020301031F009F0D059800B420009F0E0500504800009F0F05B820B 4F8005F280202509F4A0182 8. 70329F080200028F01069F320103922434592451B87DA8C05BA7F1DE5DC802BF59D394D6CC034A046F46995E0 245E437AED7B899 9. 000000001350400250097810032600 10. 000000001770400250097810032600 11. 000000002090400250097810032500 12. 000000007707400250097810032400
Fig. 1: Extract of an anonymised credit card dump.
Holder name. The underlined sequence of the 5th record represents the name of the holder of the credit card (MR John Smith) encoded using ASCII and padded with the repeated pattern 0x20.
Issuer’s public key modulus. The underlined sequence of the 8th record repre-sents the issuer public key modulus used by the authentication protocol. Transactions. Records 9 to 12 represent the last four transactions (cash withdrawal) made by the card. The first underlined sequence represents the transaction amount (13.50 euros for the 9th record) and the second one is the date of the transaction (2010/03/26 for the 9th record).
The EMV card contains a cyclic file that stores information on the transac-tions. For any new transaction, the information in the cyclic file is rotated such that the record about the oldest transaction is discarded to save room for the newest transaction.
2.2 Calypso dump
Figure 2 is a (partial) anonymised dump of a transportation card compliant with the Calypso specifications [4]. The record names (ICC, Holder1, Holder2, etc.) are available in the specifications, but the content of the records is not defined by Calypso. The content is indeed let to the discretion of the public transportation operator. The provided example illustrates that a single card may contain several encoding rules, and the information in the card is not necessarily byte-aligned.
ICC 00 00 00 00 00 00 00 04 00 71 B3 00 00 00 00 00 01 B8 B2 4A 02 50 00 33 01 1A 13 43 00 Holder1 04 00 98 E5 94 C8 02 0D 60 C9 65 C7 D5 90 00 00 00 00 00 00 00 19 75 08 10 92 82 D2 CF Holder2 F3 6A 68 88 00 00 00 00 00 00 00 00 00 00 00 00 00 00 00 00 00 00 00 00 00 00 00 00 00 EnvHol1 08 38 2B 00 08 BD 59 2A 46 60 C4 81 98 E5 94 C8 02 0D 60 C9 65 C6 41 F4 00 00 00 00 00 EnvHol2 00 00 00 00 00 00 00 00 00 00 00 00 00 00 00 00 00 00 00 00 00 00 00 00 00 00 00 00 00 EvLog1 09 0E E5 92 04 20 60 86 60 00 00 00 00 1C D6 DD 56 40 00 01 C0 00 00 51 08 66 E0 00 00 EvLog2 09 0E E5 7A 04 20 60 86 60 00 00 00 00 1C D6 DD 56 40 00 01 80 00 00 11 08 66 E0 00 00 EvLog3 09 0E E5 5A 04 20 60 86 60 00 00 00 00 1C D6 DD 56 40 00 01 40 00 00 91 08 66 E0 00 00 ConList 11 2B 40 01 80 00 00 00 00 00 00 00 00 00 00 00 00 00 00 00 00 00 00 00 00 00 00 00 00
Fig. 2: Anonymised transportation car dump.
On the Holder1 line, the first underlined sequence represents the BCD-encoded birth date of the holder: 1975/08/10. The second underlined sequence that continues on the Holder2 line represents the name of the holder, namely “James Smith”. To decode this information the binary representation of the se-quence must be split into 5-bit pieces (omitting the first bit of the sese-quence), which are then decoded with the rule (decimal representation): A=1, B=2, C=3, etc. This information is not byte-aligned.
EvLog1, EvLog2, and EvLog3 are the last three trips performed by the card, stored in a cyclic file. For example, the first underlined sequences in the EvLog lines correspond to the validation time, which is “11:53 am” for EvlLog1. This in-formation is retrieved using the binary representation of 0x592 (omitting the last bit), and converting it to an integer that represents the number of minutes since the beginning of the day. The second underlined sequence in each log represents the validation date of the card during the trip: 2008/12/09, for EvlLog1. This information is retrieved by using the binary representation of 0x5108 (omitting the two first bits) and by converting it to an integer that represents the number of days since 1997/01/01. Other information on this line are the transportation means (metro, bus, tramway), the bus line number, the number of travellers who shared the card for that trip, the station, etc. Additional information can be found in the dump, e.g., the serial number of the card, the manufacturer, the date of manufacture, etc.
3
Statistical analysis
Retrieving the meaningful information from a dump using a statistical analysis is a difficult problem. In particular, the meaningful information is drowned in a mass of information that include pseudo-random values generated by crypto-graphic means. This paper consequently focuses on a preliminary step in the forensics process that distinguishes meaningful information from cryptographic materials. To start with, we explain below the difficulty to use statistical tests to perform this task in our framework.
3.1 Statistical tests for (pseudo-) random generators
There exist many statistical tests for random and pseudo-random number gen-erators. The NIST statistical test suite [19] includes the most important ones, while keeping small the redundancy between them. We consequently decided to consider this suite for our experiments.
A statistical test aims to verify a given null hypothesis, which is data are random in our experiments. A p-value represents the strength of the evidence against the null hypothesis. This p-value is computed from the reference distri-bution of the tested statistical property. NIST uses an asymptotic distridistri-bution. The hypothesis is rejected if the p-value is lower than the level of significance of the test (for example 0.01 or 0.001). Thus, a threshold of 0.01 means that one sequence among 100 sequences is expected to be rejected. A p-value greater than this threshold (respectively lower) indicates that the sequence is considered to be random (respectively non-random) with a 99% confidence.
The NIST proposes two methods to decide whether or not a generator is suitable for a cryptographic use. A set of sequences is produced by the generator, and its quality is evaluated by means of statistical tests. The result is determined from the rate of sequences that successfully pass each test (p-value greater than the level of significance), or from the uniformity of the p-values.
Even if tests like the monobit test, the longest runs test, or the approximate entropy test could be theoretically applied to short sequences (100 bits), the recommended length is 20, 000-bit long according to the NIST, because asymp-totic approximations are used to determine the limiting distribution. Additional information on these statistical tests can be found in [19].
Moreover, some tests like the linear complexity test or the random excursions test require at least 106 bits to be applied. For short sequences, the NIST
sug-gests that asymptotic distribution would be inappropriate and would need to be replaced by exact distributions that, according to them, would commonly be difficult to compute. Thus, [23] [7] [1] introduce new tests with their exact dis-tribution, and [24] suggests a new method to take the decision of randomness for short sequences. Unfortunately, although these approaches can deal with short sequence, they require a significantly large set of such sequences.
3.2 Statistical tests in our context
Dumps obtained from embedded devices typically contain information fields whose lengths are between 1 bit and 1, 024 bits (the size of an entire dump is typically 100-bit to 40, 000-bit long).
Each sequence tested can be seen as an output of a different generator (name, date, ciphered or hashed data, etc.), then for a dump, only one sequence per generator can be tested. Section 3.1 and the above-mentioned arguments justify that most of statistical tests are not suited to short sequences, and the technique used by the NIST to decide whether or not a sequence is random is therefore not applicable. Moreover, there is no technique that use a combination of statistical tests to take the decision of randomness. In our context, the decision of the classification of each bit into meaningful information or cryptographic material is only done by directly comparing a p-value to a threshold, but this threshold need to be determined.
4
Distinguish cryptographic materials from meaningful
information
A first step to distinguish meaningful information from cryptographic materials in a memory dump of an embedded device consists in establishing a methodology to apply the statistical tests. Applying the tests to the entire dump is inefficient. Instead, tests should be applied to each field of the considered dumps. Unfor-tunately, neither the location nor the size of the fields of the dump are known. The methodology consequently consists in classifying the data (meaningful or cryptographic) bit by bit, instead of field by field.
A second step consists in performing a learning phase where the methodology is applied to dumps for which the classification of bits is known. This ground truth allows us to determine the decision threshold: the statistical tests provide a score to each bit of the considered dump, and the score is compared to the threshold to decide whether a bit is classified meaningful or cryptographic.
Then, a boosting algorithm [12] is used, namely a machine learning approach that identifies the most appropriate statistical tests to be applied and how to combine their results.
The identified tests can then be applied to dumps whose ground truth is unknown.
Finally, comparing the classification obtained by this combination of statis-tical tests on different dumps of the same application, we propose a technique that improves the classification for each dump of the application.
4.1 Applying statistical tests to dumps
Given dumps cannot be split into fields, the classification of the data has to be done bit by bit. However statistical tests are not applicable to single bits. As a consequence, bits need to be grouped into sequences. A methodology that separates a dump into several overlapping sequences is thus proposed.
Let D be a n-bit dump (bits indexed from 1 to n), a sequence length `, and a shift s, with 0 < s ≤ ` ≤ n. The shift represents the distance between two start bits of two consecutive tested sequences. The i + 1-th tested sequence of D is from the bit index (i × s + 1) to i × s + ` with 0 ≤ i ≤ bn−`s c. In the case where s does not divide n − `, the bits from dn−`s e × s + l − s + 1 to n are never tested, and so a last sequence from index n − ` + 1 to n is tested. For each tested sequence, the statistical test returns a p-value. Due to the use of a shift s potentially shorter than the sequence length `, each bit of D is tested in at most d`
se different sequences. All bits of D are therefore related to a variable number
of p-values. However, the classification method used in Section 4.2 works with the same number of scores per bit. A score function that takes p-values as input and outputs a single score is therefore applied to the p-values of each bit. The function can be for example the mean of the p-values.
As a consequence, the previous parameters, namely sequence length, shift, and score function play an important role in the quality on the classifier. Fur-thermore, some statistical tests require an internal parameter. For example, the serial test looking at the proportion of each possible block of m bits in the tested sequence, takes m as additional input. It leads to a set of N features, F = {Fj, 1 ≤ j ≤ N } where each feature is defined by a 5-tuple (statistical test,
sequence length, shift, score function, internal parameter ). Applying a feature Fj
to D outputs a score set Sj = {s j
i, 1 ≤ i ≤ n} – as presented in Figure 3 – where
sji is the score assigned by Fj to the i-th bit of D. Applying all the features Fj
of F so generates a set S = {sji, 1 ≤ j ≤ N, 1 ≤ i ≤ n} as presented in Figure 4.
4.2 Bits classification using statistical tests
In order to decide whether a bit in a dump should be classified as cryptographic or meaningful, scores returned by each feature need to be compared to a thresh-old. This process that determines the class of each bit using the scores and a pre-definite threshold is a classifier. Given a n-bit dump D and its score set Sj
ob-tained by applying a feature Fj, and the predetermined threshold t, the classifier
Cjcomputes the prediction Pj = {p j
i ∈ {cryptographic, meaningful }, 1 ≤ i ≤ n}
for D where the prediction of the class of the i-th bit of D is done as following :
pji = (
cryptographic, if sji > t meaningful , otherwise
Using scores returned by each Fj together with the ground truth of D,
repre-sented by G = {gi∈ {cryptographic, meaningful }, 1 ≤ i ≤ n}, a learning process
determines the best threshold to use. We use the learning process described in [22] whose complexity is O(n) in our case. The best threshold is the one that leads to the classification which is the most similar to the ground truth. Namely, the classification that maximises the recognition rate Rj, where Rj is computed
Analysed dump Apply test T Obtain p-values :
0 1 0 0 1 0
T(010)
T(100)
T(001)
T(010)
p1 p2 p3 p4p-values
linking
Each bit is related up to 3 p-values
0 1 0 0 1 0
p1 p1 p1 p2 p2 p2 p3 p3 p3 p4 p4 p4 . . . .sc
or
e
function
mean
0 1 0 0 1 0
sj1 s j 2 s j 3 s j 4 s j 5 s j 6 Fig. 3: Applying a feature Fj= (T, 3, 1, mean, .) on a 6-bit dump D. The processassigns the score set Sj= {sji, 1 ≤ i ≤ 6} to D.
Apply each F
jto
0
1
0
0
1
0
sj1 sj2 sj3 sj4 sj5 sj6 Bit 0 1 0 0 1 0 S1 s11 s21 s13 s41 s51 s61 S2 s12 s22 s23 s42 s52 s62 . . . . Sj s1j s 2 j s 3 j s 4 j s 5 j s 6 j . . . . SN s1N s 2 N s 3 N s 4 N s 5 N s 6 N Fig. 4: Set S = {sji, 1 ≤ j ≤ N } of scores obtained after applying all features FjRj= Pn i r j i n with r j i = ( 1, if Gi= pji 0, otherwise
Applying the learning process to all Fj leads to a set of classifier C = {Cj, 1 ≤
j ≤ N }, where each Cj is related to the feature Fj.
4.3 Boosting of statistical tests
In order to determine the best features Fj to use, we propose to use the boosting
technique that is a machine learning technique to combine several classifiers of the set C into a final classifier bC.
More precisely, we propose here to use the AdaBoost algorithm [9] which is the most popular boosting method. Given a dump, AdaBoost first selects the best classifier of C and adds it to the final classifier bC. The best classifier of the set C is the one that leads to the best recognition rate respecting the ground truth of the dump. Then looking at the obtained classification, misclassified bits by bC receive a more important weight. The boosting then selects the new best classifier taking into account the bit weights (thus this second classifier focuses on misclassified bits) and adds it to bC. The weights of the bits misclassified by
b
C are updated. Repeating those actions until all the bits are correctly classified, or a certain preset number of classifiers in bC is reached. AdaBoost does not return the optimal classifier bC because it behaves as a greedy algorithm but it is efficient whereas the naive optimal algorithm is computationally infeasible. AdaBoost’s complexity is O(|C|L), where L is the complexity of the learning algorithm.
The final classifier provided by the boosting is then used to distinguish cryp-tographic material from meaningful information in dumps where the ground truth is unknown.
4.4 Merging classifications in a set of dumps
Dumps belonging to the same application share similarities on their data. How-ever, the prediction bP obtained by the final classifier is done independently for each dump. Therefore a merging technique is proposed to combine their classi-fication in order to improve the recognition rate.
A set of dumps of the same application can be obtained by dumping memory of different cards belonging to several holders. It can also be acquired by dumping the same card at different time of the card lifetime, e.g. before and after a cash withdrawal for bank cards.
One may expect that dumps belonging to a given application to be identically structured, i.e. containing the same fields, in the same locations. For example, in some Calypso dumps, the name, the birth date, and the postal code of the holder or details of his last trips are always located at the same place in the dump, with the same encoding. The data of these fields vary for each dump but the class
(meaningful information or cryptographic material) is the same. The merging process is also applied to cyclic records, because they contain the same fields in the same locations. Therefore a classification of the bits of the application is computed rather than a classification for each dump.
Given a set D = {Dk, 1 ≤ k ≤ d} of d dumps of length n bits belonging to the
same application the merging process creates a prediction Pmerging that replaces
all the prediction of the final classifier. The prediction Pmerging is computed as
follows : Pmerging = {Majority( bPi1, bP 2 i, . . . bP d i), 1 ≤ i ≤ n}
Where bPik represents the prediction of the final classifier for the i-th bit of the dump Dk, and Majority represents the application of a majority vote to the
classes. The Pmerging obtained has a better recognition rate than the prediction
obtained independently for each dump of D.
5
Experiments
We present the data and the values of the features used by our boosting experi-ment. The final classifier obtained by AdaBoost is applied to real EMV dumps. The merging process finally allows us to reach a recognition rate greater than 99% on these EMV dumps.
5.1 Generating data for the learning phase
When fitting the classifiers, AdaBoost requires a sufficient amount of data be-longing to each class (i.e. meaningful information and cryptographic material ) from different embedded objects, to be representative of all the existing embed-ded devices.
We have extracted the data of about 300 devices (using CardPeek [16] or RFIDIOT [15]) from various applications: access control, transportation, bank-ing, health insurance and loyalty cards, train tickets, e-passports, ski passes, etc. Unfortunately, only a small part of these data can be used for the learning phase, because the ground truth of a large part of these data is unknown. In order to solve this problem, we set up a large synthetic dump containing data similar to real dumps, inspired by our 300 dumps. This synthetic dump is mod-eled by several sequences of variable lengths, containing cryptographic materials (hashed or ciphered data, cryptographic keys, etc.) or meaningful information (dates, names, etc.).
A generated synthetic dump is 100, 000-bit long. It contains approximately 65% of meaningful information, where sequences are between 80 and 300-bit long. Cryptographic materials are generated from various cryptographic algorithms as RSA, AES, SHA-1, etc. They are truncated to obtain the expected length. Mean-ingful information includes dates with different encoding, e.g., ASCII, BCD, and various formats like YYYY-MM-DD, YY/MM/DD, etc. There are also names, textual information, and zip codes with various encoding techniques.
5.2 Considered features
Given each feature is described by 5 parameters (Statistical test, Sequence length, Shift, Score function, Internal parameter ) and each parameter can be assigned with various values, the set F contains approximately 10, 000 features. Statistical test: It is the statistical test that is applied to the dump sequences. All these tests are the NIST tests except those that require 106
bits or a specific pattern to test. These NIST tests represent 8 tests : monobit, runs, block frequency, serial, discrete Fourier transform, approximate entropy, cumulative sum, and longest runs. These 8 tests provided in the NIST suite are completed by the autocorrelation [13] and tests suited to short sequences: TBT [1] and saturation point [23]. There is so 11 tests in total.
Sequence length: We have decided to lower bound the sequences to 32 bits because tests on too short sequences are not relevant. Sequence lengths used in our experiments are thus chosen in the set {32, 48, 76, 100, 128, 192, 256}. Shift: 10 different shifts are used, represented by a percentage of the sequence length : 10%, 20% . . . 100%.
Score function: It represents the method that computes the score from the set of p-values of each bit. The functions mean, min, max, and the geometric mean are used here.
Internal Parameter: When the test requires an internal parameter, several values are considered for this parameter. For example, for the serial test the parameter is the block length. When it is applied to a sequence of 256 bits, the possible size of the blocks are from 2 to 6 bits.
5.3 Learning with AdaBoost
The boosting algorithm must be set with a parameter that is the number of clas-sifiers of the final classifier. This parameter must be well suited to the context to avoid overfitting the final classifier. This phenomenon occurs when the final classifier is too adapted to the data used for fitting, which leads to a poor recog-nition rate on other data. We have experimented with a number of classifiers from 1 to 50.
Two synthetic dumps are generated, one represents the learning set and the second the validation one. The boosting creates a final classifier bC from the learning dump and then this classifier is applied to the validation one. Then, varying the number of classifiers in bC on the learning dump, each obtained bC is applied to the validation one. The bC which leads to the best recognition rate on the validation dump is saved.
The final classifier obtained after learning with AdaBoost is composed of five tests with their parameters, described as following :
– Approximate Entropy on sequences of 192 bits by blocks of 2 bits and a shift of 19 bits, the score function is max.
– Longest runs on sequences of 256 bits by blocks of 8 bits and a shift of 25 bits, the score function is min.
– TBT on sequences of 256 bits by blocks of 4 bits and a shift of 76 bits, the score function is mean.
– Serial test on sequences of 256 bits by blocks of 3 bits and a shift of 76 bits, the score function is mean.
– Cumulative sum on sequences of 256 bits with a shift of 230 bits, the score function is max.
The recognition rate of these tests is 91.7% on the learning dump and 90.7% on the validation one.
The boosting algorithm selects the most pertinent statistical tests in relation to our context of short sequences belonging to memory dumps. Note that, slightly varying the learning data, the boosting algorithm returns other strong classifiers (with different statistical tests and parameters) providing similar recognition rate. Namely, generating three dumps D1, D2, and D3, then applying the
boost-ing to the scores obtained by the features on D1and D2creates two final classifier
CF1 and CF2. These two classifiers can consist in different statistical tests but
when they are applied to the dump D3 they provide similar recognition rate.
Using more statistical tests in the final classifier improves the recognition rate on the learning dump, we obtain 98.1% with 50 statistical tests, but the recog-nition rate on the validation one is 90.0%, it is a case of overfitting. Using only one statistical test in the final classifier leads to a recognition rate of 89.9% on the learning dump and a recognition rate of 87.7% on the validation one. One can notice that these statistical tests use more than 200 bits to take their de-cision, but they are able to detect the class of sequences that are shorter than 200 bits, because all bits are tested several times due to the shift between tested sequences.
Experiments have been done with our own python program using the AdaBoost-SAMME.R algorithm [11] from Scikit-learn [17]. Calculating the p-values array on a large dump of 100, 000 bits for our set of 10, 000 features took several hours. Calculations have been made on a 64-core processor (4 AMD Opteron 6282SE 2.6 GHz) with 512 GB of RAM available. Running the Ad-aBoost algorithm, on a single core, takes between a few minutes (when | bC| = 1) and two hours (when | bC| = 50).
5.4 Recognition on real dumps
In this subsection, the classifier trained on synthetic data is used to classify meaningful information and cryptographic materials on real dumps of memory. This set is applied to more than 30 EMV dumps [8], 2 VITALE dumps (the French health insurance card) and 7 Calypso dumps. In these cards, the mean-ing of an important part of the data is publicly known (EMV, VITALE) or a previous work of the authors allows to determine it, so, the ground truth (i.e.
theoretical classification of the data) is easily accomplished. It represents more than 600, 000 bits of data with 140, 000 cryptographic bits and 500, 000 bits of meaningful information. As result, we obtained a recognition rate of 92.1% for cryptographic bits and 98.6% for bits of meaningful information. When the final classifier is applied to Calypso cards, we get 100% of recognition. Note that there are only bits of meaningful information in our Calypso dumps. Applying the fi-nal classifier to these dumps, is almost instantaneous, for large dumps (40, 000 bits), it takes less than 2 seconds.
Some further analysis can improve the results, for example if a single cryp-tographic bit (resp. meaningful bit) is surrounded by a significant amount of meaningful bits (resp. cryptographic bits), then this bit is likely misclassified. Errors are often localised on the frontier between two fields, one containing cryp-tographic material and another one containing meaningful information.
Table 1: Detection of cryptographic bits and meaningful bits in EMV, VITALE, and Calypso dumps
Dump type Cryptographic bits Recognition rate Meaningful bits Recognition rate EMV 131, 384 92.3 % 379, 352 98.0 % VITALE 9, 168 90.0 % 126, 160 99.9 % Calypso 0 – 9, 681 100.0 %
5.5 Merging process on EMV cards
Table 1 shows that our method applied to a single dump already provides good results. We now still improve the results by analysing in parallel several dumps obtained from the same application. We call this improvement the merging pro-cess.
In the following experiments, 10 fields representing in total 3, 560 bits are selected, split as 3, 312 cryptographic bits and 248 bits of meaningful informa-tion. These fields are information about the holder, the card or cryptographic materials. Since they are repeated numerous time in each dump (cyclic records) and our database is composed of 34 EMV dumps, the merging process takes the decision of the classification of the fields using 21, 120 bits of meaningful in-formation and 124, 512 cryptographic bits. Applying the merging process to all these fields, we obtain a 100% recognition rate. Merging 3 to 5 dumps is usually enough to reach a 100% recognition rate.
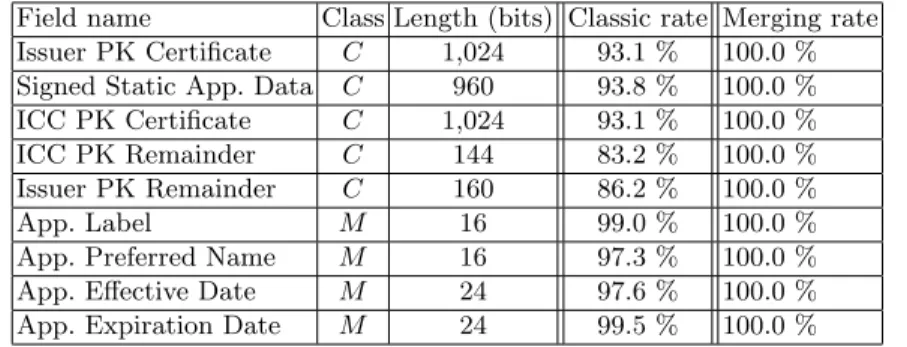
Table 2 provides the results of the merging process for each selected field from EMV cards, where the class is M for meaningful information and C for crypto-graphic material. The classic rate column is the mean of recognition rates of the analysis applied to each dump separately. The merging rate column represents the recognition rate when applying the merging process.
Note that the memory structure of the dumps of a given application is not always the same in practice: some records are possibly missing, or are not of
Table 2: Recognition rate of the merging process on several fields of EMV cards.
Field name Class Length (bits) Classic rate Merging rate Issuer PK Certificate C 1,024 93.1 % 100.0 % Signed Static App. Data C 960 93.8 % 100.0 % ICC PK Certificate C 1,024 93.1 % 100.0 % ICC PK Remainder C 144 83.2 % 100.0 % Issuer PK Remainder C 160 86.2 % 100.0 % App. Label M 16 99.0 % 100.0 % App. Preferred Name M 16 97.3 % 100.0 % App. Effective Date M 24 97.6 % 100.0 % App. Expiration Date M 24 99.5 % 100.0 %
the same length, the number of repetitions of cyclic records can vary or the data stored in a field is not always of the same length and the value of the non-used bits of the allocated space for the field is uncertain. For example, Mifare cards own always the same structure in their memory which is separated into several sectors of fixed length. Whereas EMV cards are made of files that contain records, and depending on the bank, these files and records can differ. They do not store necessarily the same number of transactions, do not contain all possible records of the EMV specification, the field of the name is padded with 0x20 when the name is shorter than the allocated space, etc. Consequently, a pre-processing phase is needed to identify the records in each dump of the application. In our dumps, all records are separated due to the data recovery technique. This pre-process aims to match the records between the dumps. This operation does not require the knowledge of the card specification, because it is performed by analysing the structure of the data of the dump and the data into the record. It includes the size and the location of the records in the dump, combined with the presence of runs of 0 or 1 separating fields in the record.
6
Conclusion and perspectives
This paper investigates memory carving techniques for embedded devices. Given that cryptographic material in memory dumps makes carving techniques ineffi-cient, we introduce a methodology to distinguish meaningful information from cryptographic material in memory dumps. We propose a technique to apply sta-tistical tests to memory dump from embedded devices. Our approach uses an adaptive boosting algorithm based on results of statistical tests for randomness. We obtained a recognition rate of about 95 % on real dumps from EMV, Vi-tale and Calypso cards. We also suggested to analyse several dumps in parallel, which increases the recognition rate up to 100.0% on EMV cards. Merging the classification of several dumps of the same application reaching a rate of 100.0 % with only 3 merged dumps for considered fields.
References
[1] Alcover, P.M., Guillam´on, A., Ruiz, M.d.C.: A new randomness test for bit se-quences. Informatica 24(3), 339–356 (2013)
[2] Avoine, G., Kalach, K., Quisquater, J.J.: epassport: Securing international con-tacts with contactless chips. In: Financial Cryptography and Data Security, pp. 141–155. Springer (2008)
[3] Burdach, M.: Physical memory forensics (2006), https://www.blackhat.com/ presentations/bh-usa-06/BH-US-06-Burdach.pdf
[4] Calypso CNA: Calypso, http://www.calypsostandard.net/
[5] Cohen, M.I.: Advanced carving techniques. Digital Investigation 4(3), 119–128 (2007)
[6] Coisel, I., Sanchez, I., Shaw, D.: Physical attacks against the lack of perfect for-ward secrecy in dect encrypted communications and possible countermeasures. In: International Wireless Communications and Mobile Computing Conference (IWCMC). pp. 594–599 (2015)
[7] Do˘ganaksoy, A., C¸ alık, C., Sulak, F., Turan, M.S.: New randomness tests using random walk. In: National Cryptology Symposium II (2006)
[8] EMVCo: EMV integrated circuit card specifications for payment systems (Jun 2008)
[9] Freund, Y., Schapire, R., Abe, N.: A short introduction to boosting. Journal of Japanese Society for Artificial Intelligence 14(5), 771–780 (1999)
[10] Friedman, W.F.: The index of coincidence and its applications in cryptanalysis. Aegean Park Press (1987)
[11] Hastie, T., Rosset, S., Zhu, J., Zou, H.: Multi-class adaboost. Statistics and Its Interface 2(3), 349–360 (2009)
[12] Kajdanowicz, T., Kazienko, P.: Boosting-based sequential output prediction. New Generation Computing 29(3), 293–307 (2011)
[13] Knuth, D.E.: The art of computer programming: Seminumerical Algorithms, vol. 2. Addison-Wesley (1997)
[14] Lanet, J.L., Bouffard, G., Lamrani, R., Chakra, R., Mestiri, A., Monsif, M., Fandi, A.: Memory forensics of a java card dump. In: Smart Card Research and Advanced Applications, pp. 3–17. Springer (2014)
[15] Laurie, A.: Rfidiot, http://rfidiot.org/
[16] Pannetrat, A.: Cardpeek, http://pannetrat.com/Cardpeek/
[17] Pedregosa, F., Varoquaux, G., Gramfort, A., Michel, V., Thirion, B., Grisel, O., Blondel, M., Prettenhofer, P., Weiss, R., Dubourg, V., et al.: Scikit-learn: Machine learning in python. The Journal of Machine Learning Research 12, 2825–2830 (2011)
[18] Poisel, R., Tjoa, S.: A comprehensive literature review of file carving. In: Avail-ability, Reliability and Security (ARES), 2013 Eighth International Conference on. pp. 475–484. IEEE (2013)
[19] Rukhin, A., Soto, J., Nechvatal, J., Smid, M., Barker, E., Leigh, S., Levenson, M., Vangel, M., Banks, D., Heckert, A., Dray, J., Vo, S.: A statistical test suite for random and pseudorandom number generators for cryptographic applications. Tech. rep., DTIC Document (Apr 2010)
[20] Shamir, A., Van Someren, N.: Playing hide and seekwith stored keys. In: Financial cryptography. pp. 118–124. Springer (1999)
[22] Su, J., Zhang, H.: A fast decision tree learning algorithm. In: AAAI. vol. 6, pp. 500–505 (2006)
[23] Sulak, F.: A new statistical randomness test: Saturation point test. International Journal of Information Security Science 2(3), 81–85 (2013)
[24] Sulak, F., Do˘ganaksoy, A., Ege, B., Ko¸cak, O.: Evaluation of randomness test results for short sequences. In: Sequences and Their Applications–SETA 2010, pp. 309–319. Springer (2010)
[25] Van Deursen, T., Mauw, S., Radomirovic, S.: mCarve: Carving attributed dump sets. In: USENIX Security Symposium. pp. 107–121 (2011)
[26] Yoo, B., Park, J., Lim, S., Bang, J., Lee, S.: A study on multimedia file carving method. Multimedia Tools and Applications 61(1), 243–261 (2012)