HAL Id: hal-01801103
https://hal.inria.fr/hal-01801103
Submitted on 28 May 2018
HAL is a multi-disciplinary open access
archive for the deposit and dissemination of
sci-entific research documents, whether they are
pub-lished or not. The documents may come from
teaching and research institutions in France or
abroad, or from public or private research centers.
L’archive ouverte pluridisciplinaire HAL, est
destinée au dépôt et à la diffusion de documents
scientifiques de niveau recherche, publiés ou non,
émanant des établissements d’enseignement et de
recherche français ou étrangers, des laboratoires
publics ou privés.
Code Domain Non Orthogonal Multiple Access versus
ALOHA: a simulation based study
Diane Duchemin, Jean-Marie Gorce, Claire Goursaud
To cite this version:
Diane Duchemin, Jean-Marie Gorce, Claire Goursaud. Code Domain Non Orthogonal Multiple Access
versus ALOHA: a simulation based study. ICT 2018 - 25th International Conference on
Telecommu-nications, Jun 2018, Saint-Malo, France. pp.445-450, �10.1109/ICT.2018.8464836�. �hal-01801103�
Code Domain Non Orthogonal Multiple Access
versus A
LOHA
: a simulation based study
Diane Duchemin, Jean-Marie Gorce, Claire Goursaud
CITI laboratoryUniv Lyon, Inria, INSA Lyon Lyon, France
Abstract—Non Orthogonal Multiple Access (NOMA) is expected to play an important role for IoT networks, allowing to reduce signaling overheads and to maximize the capacity of dense networks with multiple packets simultaneous transmission. In the uplink, NOMA can improve significantly the performance of an ALOHA random access if the receiver implements a multi-user detection algorithm. In this paper we compare the performance of a code domain NOMA with a classical ALOHAprotocol, through simulations. The code domain NOMA uses random Gaussian codes at the transmitters and exploits compressive sensing at the receiver to maximize users detection and to minimize symbol error rates.
Index Terms—Internet of Things, Random access, Non Orthog-onal Multiple Access, Compressive sensing, ALOHA.
I. INTRODUCTION
The context of this study is the transmission of short and independent information quantities from a dense population of nodes to a single base station (BS) under high reliability, low latency and low power consumption constraints. This transmission scenario is crucial for massive Internet of Things (IoT) Low Power Wide Area Network (LPWAN) [1] with Ultra Reliable and Low Latency Communications (URLLC) constraints [2].
In order to provide the nodes with quasi-instantaneous and on-demand communications, the hand-shake protocol has to be minimal and a direct random network access without primary connection is seducing. Indeed, on account of latency constraint and energy efficiency, high overhead and delay induced in classic resource allocation protocols prevent from using a connection-oriented mode in this context. This problem is one of the main target of the future 5G NB-IoT protocol, but the investigated solutions are based on a three-step handshake mechanism at the minimum (instead of five in usual 4G or 5G protocols).
The most classical protocol-free multiple access scheme is
ALOHA [3] but it suffers from poor performance when the
number of transmitters and the transmission probability grow simultaneously due to a high collision probability. At the protocol level, the collision probability can be kept low by
This work has been partly supported by the INSA Lyon - SPIE chair on the Internet of Things and by the French National Agency for Research (ANR) under grant n◦ANR-16-CE25-0002 - EPHYL
increasing the frequency bandwidth allocated to the random
ac-cess channel and multi-slotted ALOHA techniques, extensively
studied in the past [4], can be chosen.
An alternative, investigated at the Physical layer relies on the use of Non-Orthogonal Multiple Access (NOMA) techniques associated with a powerful multi-user detection algorithm at the receiver [5]. NOMA techniques can be designed in the power, code or time-frequency domains. Power-domain NOMA relies on a classic simultaneous multiple access (MA) using a Superposition Coding (SC) strategy in order to allow more users to access the same resource. On the receiver side, Succes-sive Interference Cancellation (SIC) is employed for recovering each communication. A perfect recovery is possible only if the transmission powers or the individual rates are tuned as a function of the channel states. Another category consists in multiplexing the competing users in the code domain by using user-specific spreading sequences, having a sparse, low-density and low inter-correlation properties. One of the advantages of such MA techniques is the grant-free access provided by the non-orthogonality feature, but at the cost of introducing users interference. This kind of technique can be seen as a step back to the Code Division Multiple Access (CDMA) technology extensively studied in the 90s. The most important difference relies in the fact that in the context of IoT, the receiver doesn’t know in advance the active codes and has to detect them and to estimate their data. The recent contribution in this field relies on the use of the sparsity assumption allowing to use algorithms based on compressive sensing (CS) [6]–[11]. Last but not least, we should mention that another popularized technique is the use of SCMA [12] which redefines modulation and code multiplexing as a whole.
In this paper, we focus on the Code domain NOMA follow-ing [9]–[11], where Gaussian random codes and CS are used. Following Xie et al. [11] we use their proposed algorithm for the decoding task.
Our work compares the performance of such approach with
the performance achievable with a standard ALOHA technique,
taken as a reference in terms of uncoordinated random access scheme. As Choi in [13], we show that NOMA allow a
per-formance improvement compared to a slotted ALOHA access.
While [13] is dedicated to Power domain NOMA with an
deals with Code domain NOMA in a single channel ALOHA
scheme. Based on the implementation of the proposition of [11], we evaluate the gains of NOMA with different metrics, covering both the users detection and the data estimation tasks. The rest of the paper is organised as follows: section II describes our model, with the two confronted access types. Section III details the metrics used for the performance com-parison. A theoretical analysis of detection performance in a simple scenario is realized in section IV while the actual detection and estimation are jointly retrieved and evaluated in section V under a more realistic scenario. Section VI concludes the paper.
II. MODELDESCRIPTION
A. Scenario
The scenario herein proposed follows [11]. The reference topology is a single cell in the uplink, with a base station (BS) made of a unique receiver equipped with multiple antennas. A very dense population of users (herein called nodes) is spread over the cell and generates random and bursty transmissions. The nodes set is referred to as N , whose size is N = card(N ). The BS emits a synchronization frame periodically, allowing the nodes to work in a slotted manner. It is assumed that
an unknown and small subset of nodes Na ⊂ N is active
simultaneously in a given time slot. Their number is noted Na.
Thus the medium is a single resource, shared among users. The wireless channel is modeled as follows. The pathloss is assumed to be known by the nodes which use power control to compensate it for. Therefore, the BS then receives all packets at the same power in average, but due to block fading the different signals are received at the BS with different powers. More precisely, the channel between each node and the BS, equipped with α antennas, is characterized by identically and independently distributed (i.i.d.) random variables. Note that all channel coefficients remain constant in a time slot. An Additive White Gaussian Noise (AWGN) is also considered.
The signal received at the BS can be expressed as follows:
Y =√ρ0
Na
X
n=1
hnxnT+ Z (1)
where Y ∈ Cα×m is the received signal, ρ0 is the Signal
to Noise Ratio (SNR). The vector hn denotes the channel
response of node n, whose each of the α elements is the fading coefficient for one of the BS antennas during the m channel
uses of the message xn. Z denotes the AWGN. [.]T is the
transpose operator. All elements of Z and hnfollow a standard
complex normal law. The specific expressions of xn for each
multiple access type are given hereunder.
B. ALOHA-type system
1) SlottedALOHAtransmissions scheme: For a fair
compar-ison, and as the assumptions in II-A hold for both NOMA and
ALOHA transmissions, we consider a slotted ALOHA scheme.
Our ALOHA-based system does not use any coding strategy.
The data stream is send as is, nevertheless, it is preambled by
its node unique identifier wn. A unique bit sequence is simply
mapped to a node, the length L of the identifier bit sequences is
related to the nodes set size: L = log2(N ) bits. This sequence
only requires a modulation before being preambled to the data:
wn is the modulated symbols vector of the node n identifier
bit sequence. Let sn ∈ Sd denote the modulated symbols of
data streams, where S ⊂ C is the set of modulated symbols. A message is thus obtained as follows:
xn= [wnTsnT]T (2)
An active node, i.e. willing to send a message, will transmit on the next time slot whose length is d + dL/M e where M is the chosen modulation’s rate, and d.e the ceiling function. Note that when the messages are dedicated to the nodes activity notification, only the identifiers are sent.
2) SIC decoder: The decoder of the slotted ALOHA-based
transmission scheme exploits Successive Interference Cancella-tion (SIC). We assume that the decoder have prior informaCancella-tion
about the channel response for each node, their identifiers wn
and the SNR. A predefined number of iterations K is set. During each iteration, a node is detected before its data are esti-mated. The detection criteria is the lowest distance between the node’s identifier sequence and its estimated symbols sequence (obtained with a hard decision on the result of a Least Square algorithm, given the channel response of the node, the SNR and the received signal Y ). The data estimation is performed on the data part of the received signal with a Least Square (LS) algorithm as well, considering the SNR and the channel response of the detected node. The estimated contribution of the detected node is then canceled and another iteration starts. C. NOMA-type system
The random code based approach proposed by Xie et al. in [11] is now described; the reader is refer to their paper for more details.
1) Code domain NOMA transmissions scheme: The use of
Gaussian codes comes from Compressive Sensing (CS) theory. In CS theory, an initial signal of dimension N is projected into a new signal composed of very few (k) non-zero components among N , referred to as a k-sparse signal (or having a sparsity level k). The set of indices of these k components constitutes the sparsity pattern. One then reconstructs this version of the signal from only m measurements obtained by a specific m∗N measurement matrix with m < N . This under-determined problem can be solved thanks to an algorithm which performs a l1-minimization or a sparse approximation. The dimension’s reduction of the observed signal (from N to m) gives the compressive characteristic to this sensing technique. In [9], the authors establish the parallel between users detection and the sparsity pattern detection in CS, and refer to the On-Off Random Access channel for modeling a communication scheme where the signal sent by the N users can be represented by a vector whose each entry corresponds to a user: if the user is active, its entry will be a non-zero value whereas an inactive user will be assigned a zero in the vector. The goal of the receiver is to detect the unknown active nodes rather than
retrieving the actual value of the signal vector. Xie et al. [11] introduced a framework dedicated to simultaneous detection-estimation.
Similarly, each node n is associated to a unique i.i.d. complex
Gaussian coding normalized vector cn or column-normalized
matrix Cn, which is used to encode the data sn. xn ∈ Cm
denotes an encoded message. For the general case:
xn= Cnsn, (3)
the received signal is then:
Y =√ρ0
Na
X
n=1
hn(Cnsn)T + Z . (4)
(For d = 1, the equation 3 reduces to xn= cnsn and sn can
be considered as an activity notification bit.)
2) NBOMP algorithm decoder: The Normalized Block
Or-thogonal Matching Pursuit is an iterative algorithm which, at each iteration, selects an additional potentially active node and jointly estimates the signals of previously selected nodes. Since it defines the number of detections, the iterations number K should be at least as large as the expected number of active nodes to be able to detect all of them. The detection and estimation are respectively realized by means of correlation and Least Square (LS) operations and require the codes, SNR and channels knowledge. The word ”block” in NBOMP refers to the block sparsity structure of the unknown signal and the block nodes signatures which appear when vectorizing equation 4:
y =√ρ0 Na X n=1 (Cn⊗ hn)sn+ z = √ ρ0 Na X n=1 Bnsn+ z (5)
where vec(Y ) = y, ⊗ denotes the Kronecker product, Bn
corresponds to the block signature matrix of node n.
For the detection task, at iteration i, a node n is detected
if its correlation coefficient cn,i is the largest of all remaining
(undetected) nodes. cn,i is defined as follows:
cn,i= BHn ∗ resi 2 ||hn|| 2 (6)
where [.]H denotes the hermitian operator and res
i is the
residual signal, i.e. the rest of the received signal y once the estimated symbols contributions (from the LS computation at
iteration i−1) are retrieved. When the max(cn,i) is selected, the
index n is added to the set of detected nodes λi. The estimation
is performed by a LS operation. Indeed, once the additional node is detected, the algorithm is intended to solve
˜
sλi = arg min
s0∈Sd.i
||y −√ρ0Bλ,is0||2 (7)
where ˜sλi is the concatenation of the estimated data streams
of the i detected nodes and Bλ,i denotes the concatenation
of the i signature matrices Bn with n ∈ λi. The
Moore-Penrose pseudo-inverse can be computed but, for the sake of complexity, our implementation of the NBOMP rather employs a QR factorization. A decision is taken afterward to map the
estimated values to the closest modulated symbols, as such, ˜sλi
is the solution to (7). The last iteration provides the data stream estimates for each detected node.
III. PERFORMANCE METRICS
A. Detection evaluation
1) Detection Error Rate: This metric is used for the first
approach focusing on user detection only. The number of message arrivals follows a Poisson law with parameter µm.
µ = µ0N where µ0 is the message arrival rate per node. Let
X denote the random variable of message arrivals number and
Pm(X = k) the probability of k message arrivals in a slot of
length m symbols. According to the Poisson law:
Pm(X = k) = e−µm
(µm)k
k! (8)
The Detection Error Rate (DER) depends on the expected messages error number, such as:
DER = P∞ k=κ+1(kPm(X = k)) P∞ k=0(kPm(X = k)) = P∞ k=κ+1(kPm(X = k)) E[X] (9) where E[X] is known to be equal to the parameter µm.
2) Detection Success Rate: In the second approach, the
detection efficiency is quantized by the Detection Success Rate
(DSR). Let λNa denote the detected set,
DSR = card(λNa)
Na
=card(λK∩ Na)
Na
(10)
3) Missed Detection and False Alarm: In order to have more
details about the detection performance, we use two additional metrics: the Missed Detection (MD) and False Alarm (FA)
ratios. Let λN
adenote the FA (also known as the False Positive)
set, MD and FA ratios are thus:
M D = card(Na∩ λNa) Na = 1 − DSR (11) F A = card(λNa) card(N ∩ Na) =K − card(λNa) N − Na (12) B. Estimation evaluation
1) Symbol Error Rate: The estimation performance is
evalu-ated by means of the classic Symbol Error Rate (SER) metric.
Errn denotes the erroneously estimated symbols of node n,
SER can be expressed by:
SER = d ∗ card(λN a) + P n∈λNa card(Errn) d ∗ Na (13) C. Latency evaluation
1) Latency: The latency can be defined as the sum of the
waiting time (the maximum channel use number that a node would have to wait before being allowed to send its message), the transmission time and the decoding time. However, the decoding time can be neglected since, in this work, we con-sider that the BS is not limited from computation and power resources viewpoints. Moreover, as the transmission time varies
according to the distance between the node and the BS, we will only take the static part, i.e. the message duration, into account. As a result, the latency should be approximately twice the message duration. As it is directly proportional to the message length, the latency of both access scheme can therefore be evaluated by the message length m.
IV. DETECTIONPERFORMANCE
We firstly focus on the detection performance evaluation. We consider an ideal scenario and a simple use case with no data transmission but where the nodes aim to notify of their activity. In this kind of application [9], the decoder only has to detect the active nodes. We simplify the model, assuming that the transmissions occur in a high SNR regime (noise is neglected). We also assume that both the transmitters and the receiver have one antenna and that the channel is not subject to fading. As such, only the presence of competing communications makes the transmissions succeed or fail, according to their number.
Especially, it is assumed that an ALOHA-based transmission is
correctly detected if no other communications occur within the same time slot, i.e. if no collision occurs. NOMA can handle a few simultaneous transmissions, according to the code length. Theorem 6 of [14] defines the length of measurement vectors (in relation to the sparsity level k of the signal, its dimension N and some positive constants δ and β) as the necessary length for a successful reconstruction of the signal via OMP using a predefined measurement matrix, with a probability of success above 1 − δ. The length m is defined as βk log(N/δ). Further,
the authors observe for a success probability Ps of 99%, that
m can be approximated by 2k log(N ). Moreover, [10] confirms this estimation by showing that m = 2k log(N −k) is sufficient for reconstruction under asymptotic conditions. The authors
clarify that, when k is unknown but between kmin and kmax,
having m = 2kmaxlog(N − kmin) measurements is sufficient.
We are therefore using the similar formula for the Gaussian
codes length with the assumption that kmin = 0, leading to
m = 2kmaxlog(N ). We assume that this code length allows
to detect up to kmax simultaneous transmissions with 99% of
success, according to the numerical model from [14]. Let κ denote the maximal detected message number in a time slot: κaloha= 1 and κnoma = kmax.
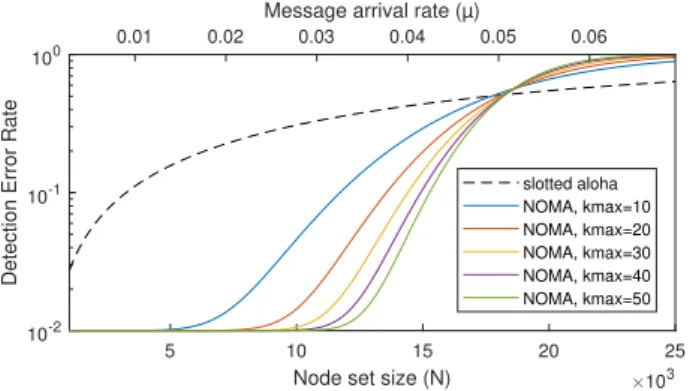
Recalling equation 9, the Detection Error Rates are: DERaloha= P∞ k=2(kPm(X = k)) E[X] = 1 − e−µ0N L/M (14) DERnoma = Ps P∞ k=kmax+1(kPm(X = k)) E[X] + 1 − Ps = 1 − Ps.e−2µ0N.kmaxlog(N ) Pkmax k=0 (k (2µ0N.kmaxlog(N ))k k! ) 2µ0N.kmaxlog(N ) (15) The DER of the two access schemes are shown in Fig. 1 for
a range of node set size from 1.103 to 25.103. The results are
given between 1 and 10−2 due to the upper bound
approxima-tion. The Poisson law parameter µ0is set to 1/3.6.105message
5 10 15 20 25
Node set size (N) 103 10-2
10-1 100
Detection Error Rate
slotted aloha NOMA, kmax=10 NOMA, kmax=20 NOMA, kmax=30 NOMA, kmax=40 NOMA, kmax=50 0.01 0.02 0.03 0.04 0.05 0.06
Message arrival rate (µ)
Fig. 1. Detection Error Rate of NOMA and ALOHAsystems according to the node set size N
per symbol time, which corresponds to a mean activity of one message per node per hour with a modulation rate of 100bps. The NOMA DER are bounded by the success probability
threshold Ps, related to the approximation of the sufficient
length from the observations of Tropp et al. and the curves
might be shaped by this 10−2 bound for low node set size or
message arrival rate. Nevertheless, we can observe that NOMA
outperforms the slotted ALOHA system up to N ≈ 17.103. For
larger N , the message length of NOMA becomes too large to
maintain a number of simultaneous active nodes below kmax
in a time slot with a high probability, thus the fast degradation
up to the point where the ALOHA system takes advantage of
shortest time slots even if only one active node is allowed for a successful detection.
Fig.1 shows the benefit of NOMA with Gaussian codes
compared to a slotted ALOHA for a range of large N . But
this analysis suffers from several weak points: the model is dedicated to a network-level performance evaluation, showing the effect of collisions on both access techniques. However, it does not consider channel distortions, neither fading nor noise. Secondly, it also relies on approximations. The real perfor-mance of decoding algorithms are not exploited. Furthermore, this analysis is not adapted to data transmission evaluation. Therefore, a more sophisticated model, taking physical layer aspects into account, is presented in the next section.
V. DETECTION ANDESTIMATIONPERFORMANCE
In order to evaluate node detection probability and data estimation error rates, we implemented code domain NOMA
and ALOHA-based systems with simulations under the more
realistic transmission scenario described in section II-A.
a) Comparison of NOMA to ALOHA transmissions
per-formance: Fig. 2 and 3 represent the detection and estimation
performance of the confronted systems. The results are drawn as function of the SNR in the range [−4; 20]dB, for different
active nodes numbers (from Na= 8 to 30). The nodes set size
is fixed to 80, and the packets are all made of d = 100 QPSK symbols. NOMA messages length m is 500 symbols, while
ALOHA messages are transmitted over 104 symbol time (or
-5 0 5 10 15 20 SNR 0.65 0.7 0.75 0.8 0.85 0.9 0.95 1
Success Detection Rate
ALOHA, Na=8 ALOHA, Na=16 ALOHA, Na=24 ALOHA, Na=28 ALOHA, Na=30 NOMA, Na=8 NOMA, Na=16 NOMA, Na=24 NOMA, Na=28 NOMA, Na=30
Fig. 2. ALOHAand NOMA Detection Success Rate
-5 0 5 10 15 20 SNR 10-3 10-2 10-1 100
Symbol Error Rate
ALOHA, Na=8 ALOHA, Na=16 ALOHA, Na=24 ALOHA, Na=28 ALOHA, Na=30 NOMA, Na=8 NOMA, Na=16 NOMA, Na=24 NOMA, Na=28 NOMA, Na=30
Fig. 3. ALOHAand NOMA Symbol Error Rate
the active nodes in ALOHA are uniformly associated to one
of the 5 available time slots of the observation frame (as d500/104e = 5, the equivalent frame lasts 520 channel use). The BS possesses α = 8 antennas and runs K = 30 iterations of either the SIC-based decoder for the Aloha system or the NBOMP decoder for the NOMA transmissions.
Fig. 2 shows that the DSR of NOMA is subject to little
variations w.r.t. Na and to the SNR while the detection
per-formance of ALOHA degrades when Na rises, and shows a
local maximum when SN R ≈ 4dB. For the whole range of represented SNR and active nodes number, NOMA outperforms
ALOHA in terms of DSR. Similarly, in Fig. 3, the performance
divergence of ALOHA and NOMA can be observed. Indeed,
the SER of NOMA remains quasi-insensitive to the active node
number whereas the impact of the worse detection with ALOHA
is clear. For SNR in [-4,4]dB, we take for granted that, for both access schemes, when the SNR increases, the SER decreases. For SNR values above 4dB, the degradation of the SER of
ALOHA is related to the decreasing DSR whereas the SER of
NOMA continues to improve beyond 10−2. Even though the
NOMA performance are better than the ALOHA as a general
rule, one can nevertheless notice the superiority of the data
estimation of the ALOHA system when Na= 8 for the lowest
SNR values, although the detection probability of ALOHA
is lower than that of NOMA. For larger Na, NOMA takes
advantage of the redundancy introduced in the coding scheme
despites of the collisions. However, if the Missed Detections are not taken into account, i.e. when the SER is restricted to the active nodes that have been detected, the SER of NOMA
and the worse SER of ALOHA even coincide for the range
of lowest SNR values. In this case, NOMA also outperforms Aloha for any active nodes number as soon as SNR>4dB.
Despites of the inter-dependence of the detection and the estimation tasks of the NBOMP or SIC-based algorithms, one can not state on a better efficiency of an access scheme com-pared to the other based on only one of the previous evaluation metrics. Indeed, the behaviors of the transmission techniques on the detection side don’t directly predict the performance on the estimation side therefore the two metrics must be considered as a whole. Moreover, the choice of parameters such as m or K can be beneficial to a particular metric while degrading the results of another performance metric, as pointed out in the following paragraphs.
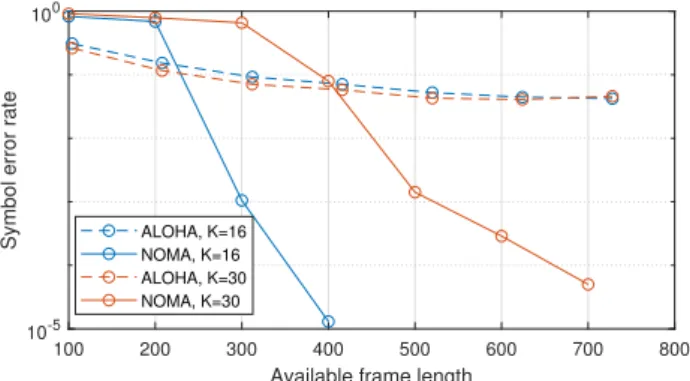
b) Latency versus SER: Let consider that a constant
number of active nodes has access to the channel within a frame length, or channel use number, in order to transmit the same amount of data. In Fig. 4, N a = 8 nodes among N = 80 transmit d = 100 data symbols. The messages with NOMA
occupy the full frame whereas for ALOHA, the nodes keep the
same time slot length (i.e. m = d + dL/M e) but their message arrivals number in a slot decreases with the increase of the available channel use number.
The results of the SER w.r.t. the available frame length
are shown at the 16th and the 30th iteration, with α=8,
SN R=10dB. Fig. 4 shows how NOMA SER drops sharply around 200 or 300 channel use (resp. for 16 and 30 iterations)
whereas the ALOHASER decreases slowly with the lengthening
of the frame. This illustrates how latency trades with reliability for each access scheme: a longer m in NOMA, allowing more redundancy, improves the estimation capability at the cost of an increase of the latency of the same order. On the opposite,
the ALOHA system benefits from a short latency, independent
of the frame length and allowing fewer concurrent accesses during a transmission, however not enough to compensate for the lower performance, dropped down by a low DSR. Another difference stems from the SER of NOMA that significantly
100 200 300 400 500 600 700 800
Available frame length
10-5 100
Symbol error rate ALOHA, K=16
NOMA, K=16 ALOHA, K=30 NOMA, K=30
degrades by an iteration number increase while ALOHA is subject to an almost negligible estimation improvement. Indeed,
at Na = 8, additional NBOMP iterations introduce FA. Since
the estimation of the K node signals is performed jointly, the estimated signals of active nodes are corrupted by the FA. The vertical gap between red and blue curves of NOMA is
representative of this SER degradation. On ALOHA side, the
slight difference is due to the loss in the DSR. Additional iterations allow to increase the detection probability thus the SER also improves.
c) Detection Error Trade-off: Fig. 5 represents the
Detec-tion Error Trade-off (DET) of NBOMP and ALOHASIC-based
decoder. The MD ratio is represented as a function of the FA
rate for N = 80, Na = 24, α = 8, SN R = −10dB, d = 100,
mN OM A = 500, mALOHA = 104 and K varying between
10 and 40 iterations. One can make two observations: firstly,
again NOMA has better MD and FA ratios than ALOHAfor the
same set of parameters. Moreover, one can note the efficient decrease of MD for NBOMP with a few iterations, but once
K reaches Na this tendency is inversed and the detection of
a few more active nodes costs much more False Alarms. This makes it clear that the choice of the iterations number for the decoding algorithm also has a great impact on the detection performance.
0 0.05 0.1 0.15 0.2 0.25 0.3 0.35 0.4 0.45
False Alarm rate
10-2 10-1 100
Missed Detection rate
ALOHA NOMA K=Na K=Na Fig. 5. MD vs FA ratios VI. CONCLUSION
The simulation studies performed in this paper highlight the performance gain that can be achieved thanks to a code domain NOMA random access. Despite longer packets resulting in a higher channel occupancy rate, the NOMA outperforms a
classical ALOHAscheme, thanks to a robust multi-user decoder
technique. Our future work will consist in optimizing the coding scheme to maximize the system performance, which may be measured by the nodes density that is achievable for a fixed bandwidth and under some error rate constraint.
It is worth mentioning that the multi-user receiver used in this paper implements a multi-user LS receiver which suffers
from a high complexity. Even if the algorithmic complexity at the BS can be considered negligible compared to the nodes complexity, this technique cannot directly scales for very dense networks with hundreds and even thousands nodes. Sub-optimal algorithms will be necessary.
REFERENCES
[1] X. Xiong, K. Zheng, R. Xu, W. Xiang, and P. Chatzimisios, “Low power wide area machine-to-machine networks: Key techniques and prototype,” IEEE Communications Magazine, vol. 53, no. 9, pp. 64–71, 2015. [2] P. Schulz, M. Matthe, H. Klessig, M. Simsek, G. Fettweis, J. Ansari,
S. A. Ashraf, B. Almeroth, J. Voigt, I. Riedel, A. Puschmann, A. Mitschele-Thiel, M. Muller, T. Elste, and M. Windisch, “Latency Critical IoT Applications in 5G: Perspective on the Design of Radio Interface and Network Architecture,” IEEE Communications Magazine, vol. 55, no. 2, pp. 70–78, feb 2017. [Online]. Available: http://ieeexplore.ieee.org/document/7842415/
[3] N. Abramson, “THE ALOHA SYSTEM: another alternative for computer communications,” in AFIPS ’70 (Fall): Proceedings of the November 17-19, 1970, fall joint computer conference. New York, New York, USA: ACM Press, 1970, pp. 281–285. [Online]. Available: http://portal.acm.org/citation.cfm?doid=1478462.1478502
[4] S. Ghez, S. Verdu, and S. Schwartz, “Stability properties of slotted Aloha with multipacket reception capability,” IEEE Transactions on Automatic Control, vol. 33, no. 7, pp. 640–649, jul 1988. [Online]. Available: http://ieeexplore.ieee.org/document/1272/
[5] M. Shirvanimoghaddam, M. Dohler, and S. J. Johnson, “Massive Non-Orthogonal Multiple Access for Cellular IoT: Potentials and Limitations,” IEEE Communications Magazine, 2017.
[6] E. J. Cand`es, J. Romberg, and T. Tao, “Robust uncertainty principles: Ex-act signal reconstruction from highly incomplete frequency information,” IEEE Transactions on Information Theory, 2006.
[7] S. Foucart and H. Rauhut, A Mathematical Introduction to Compressive Sensing, 1st ed. Birkh¨auser, New York, NY, 2013. [Online]. Available: http://link.springer.com/10.1007/978-0-8176-4948-7
[8] G. Wunder, C. Stefanovic, P. Popovski, and L. Thiele, “Compressive coded random access for massive MTC traffic in 5G systems,” in 2015 49th Asilomar Conference on Signals, Systems and Computers. IEEE, nov 2015, pp. 13–17. [Online]. Available: http://ieeexplore.ieee.org/document/7421050/
[9] A. K. Fletcher, S. Rangan, and V. K. Goyal, “On-off random access channels: A compressed sensing framework,” CoRR, vol. abs/0903.1022, 2009. [Online]. Available: http://arxiv.org/abs/0903.1022
[10] A. Fletcher and S. Rangan, “Orthogonal matching pur-suit from noisy measurements: A new analysis,” Proc. Neural Inf. Processing Syst. 22, pp. 1–9, 2009. [On-line]. Available: https://papers.nips.cc/paper/3784-orthogonal-matching-pursuit-from-noisy-random-measurements-a-new-analysis.pdf
[11] R. Xie, H. Yin, X. Chen, and Z. Wang, “Many Access for Small Packets Based on Precoding and Sparsity-Aware Recovery,” IEEE Transactions on Communications, vol. 64, no. 11, pp. 4680–4694, nov 2016. [Online]. Available: http://ieeexplore.ieee.org/document/7558184/
[12] H. Nikopour and H. Baligh, “Sparse code multiple access,” in IEEE International Symposium on Personal, Indoor and Mobile Radio Com-munications, PIMRC, 2013.
[13] J. Choi, “NOMA-Based Random Access With Multichannel ALOHA,” IEEE Journal on Selected Areas in Communications, vol. 35, no. 12, pp. 2736–2743, dec 2017. [Online]. Available: http://ieeexplore.ieee.org/document/8085106/
[14] J. A. Tropp and A. C. Gilbert, “Signal recovery from random measure-ments via orthogonal matching pursuit,” IEEE Transactions on Informa-tion Theory, vol. 53, no. 12, pp. 4655–4666, 2007.