Compulsory Voting Can Increase
Political Inequality: Evidence from Brazil
The MIT Faculty has made this article openly available.
Please share
how this access benefits you. Your story matters.
Citation
Cepaluni, Gabriel, and F. Daniel Hidalgo. “Compulsory Voting
Can Increase Political Inequality: Evidence from Brazil.” Political
Analysis 24.2 (2016): 273–280.
As Published
http://dx.doi.org/10.1093/pan/mpw004
Publisher
Oxford University Press
Version
Original manuscript
Citable link
http://hdl.handle.net/1721.1/106314
Terms of Use
Creative Commons Attribution-Noncommercial-Share Alike
Detailed Terms
http://creativecommons.org/licenses/by-nc-sa/4.0/
Compulsory Voting Can Increase Political Inequality:
Evidence From Brazil
Gabriel Cepaluni São Paulo State University
F. Daniel Hidalgo
Massachusetts Institute of Technology November 25, 2015
Abstract
One of the most robust findings on political institutions is that compulsory voting reduces the participation gap between poorer and wealthier voters. We present evidence that in Brazil, the largest country to use such a rule, compulsory voting increases inequality in turnout. We use individual-level data on 140 million Brazilian citizens and two age-based discontinuities to estimate the heterogeneous effects of compulsory voting by educational achievement, a strong proxy for socio-economic status. Evidence from both thresholds shows that the causal effect of compulsory voting on turnout among the more educated is at least twice the size of the effect among those with less education. To explain this result, which is the opposite of what is pre-dicted by the existing literature, we argue that non-monetary penalties for abstention primarily affect middle and upper class voters and thus increases their turnout disproportionately. Sur-vey evidence from a national sample provides evidence for the mechanism. Our results show that studies of compulsory voting should consider non-monetary sanctions, as their effects can reverse standard predictions.
1
Introduction
One of the most robust findings in the literature on political institutions is that compulsory voting (CV) compresses inequality in turnout (Lijphart,1997;Jackman,2001). Low income voters around the world tend to participate in elections at lower rates than wealthier voters, which can induce democracies to cater policy to their more well-off citizens (Fowler,2013;Bechtel, Hangartner and Schmid,2015). The typical account in the literature is that effective compulsory voting—usually enforced by monetary fines—mechanically eliminates inequality by reducing absenteeism to neg-ligible levels and thus eliminates the representational biases stemming from unequal rates of par-ticipation.
While fees are the primary means by which compulsory voting is enforced around the world, the existing literature frequently overlooks non-monetary sanctions for abstention.1 In countries as diverse as Greece (prior to 2001), Venezuela (prior to 1993), Bolivia, Peru, and Brazil, failure to turnout can deny citizens access to a range of privileges such as the ability to apply for state employment, carry out financial transactions in banks, travel abroad, and obtain official identifi-cation documents. What is notable about these non-monetary sanctions is that many, if not most, of the penalties affect activities that are primarily valued by middle and upper class voters. While abstaining voters can usually restore their access to state services by paying the fine, in most in-stances, it is simply easier to vote than deal with the bureaucratic hassle of fine payment.
The existence of these non-monetary sanctions complicates standard predictions about the distributional consequences of compulsory voting. This complication is especially important in contexts where fines for absenteeism are small or unenforced, leaving substantial room for non-compliance with the law.2 If the size of the monetary fee is low and the importance upper and middle class voters place on the non-monetary sanctions is high relative to poorer voters, com-pulsory voting may increase inequality in political participation. The logic is straightforward: the costs to abstaining poor voters of being denied access to state services is small when sanctioned state services are rarely used by low income voters, especially when the fine is low. For wealthier voters, lack of access to frequently used state services generates incentives to comply even when
1For an exception, seePower(2009).
2Even in contexts with relatively strong compulsory voting laws such as Australia, however, residual absenteeism
can still create small, but persistent, representational biases (McAllister,1986). The Australian case indicates that
the monetary sanction is trivial.
We provide evidence that CV increases turnout more among the comparatively well off in the largest country in the world to use compulsory voting: Brazil. To show this, we employ a regres-sion discontinuity design that uses two age-based thresholds in the electoral law which partitions the electorate into voters for whom voting is mandatory and those for whom it is voluntary. To assess how differential exposure to CV increases turnout among voters of distinct socio-economic groups, we employ a comprehensive voter registry that records turnout, education status, and precise date of birth for over 140 million Brazilian citizens. We find that across both thresholds CV increases inequality in turnout. In addition, we present survey evidence to show that the most likely mechanism is differential use of state services among the comparatively well-off. Because less well off voters tend not to use the state services affected by failure to comply with the law, compulsory voting has comparatively weaker effects among these voters. We conclude by dis-cussing limitations of the design and implications for future analyses of the effects of compulsory voting.
2
Compulsory Voting in Brazil
Compulsory voting is mandated in the 1988 Brazilian constitution and the sanctions for abstention are stipulated in the electoral code. Per the constitution, voting and registration is compulsory for literate individuals between the ages of 18 and 69, and voluntary for illiterates and for those aged 16 to 17 and older than 70. For citizens required to vote, abstention is only permitted after formally requesting an exemption due to travel or illness. Abstaining voters who fail to receive an exemption are required to visit a electoral judiciary office and pay a fee of 3 to 10% of the regional minimum wage (roughly $3.50 BRL or $1.60 USD). For citizens who fail to pay the fee, the electoral law3forbids participation in civil service exams or public bidding processes, working in the government, obtaining a passport, enrolling in a public university, or obtaining loans from state banks.4
Are the penalties for abstention sufficient to compel citizens to vote? For most Brazilians, the monetary penalty for abstaining is small. The average monthly wage in 2013 was about $500 USD,
3See Article 7.1 of Law 4.737.
Less than Primary Primary Secondary University 0.2 0.4 0.6 Mean Number of State Services Used
Education
Figure 1: Average Number of State Services Used by Education Status. Lines represent 95% confi-dence intervals.
so the fine amounts to less than 0.4% an average workers’ monthly income. The non-monetary penalties, however, can be more costly, but primarily to voters who use state services that are affected by non-compliance with the law. The services affected by failing to vote, such as obtaining a passport and taking a civil service exam, are primarily those accessed by the middle and upper class. To provide evidence on this point, we asked a national sample of Brazilian voters whether they used any of the state services in the last three years that are affected by failure to comply with the law.5 Only about 15% of the sample used any of the state services in the previous three
years, but this average masks considerable variation by education status, which we use as a proxy for class (see next section). Figure1plots the average number of state services used by education status and demonstrates that more educated Brazilians are more likely to use state services that would be affected by failure to vote on election day.
Given that the two types of penalties—a monetary fine and access to state services—affect voters of different socio-economic strata differentially, it is not immediately clear how compulsory voting will affect inequality in turnout. If poorer voters are highly sensitive to even a modest fee and wealthier voters do not particularly value access to state services, then the finding that compulsory voting compresses inequality in turnout should apply. If, however, wealthier voters
5The survey was conducted by the survey firm Instituto Análise in 2014 and total sample size is 1230 respondents. All
figures and uncertainty estimates presented in the paper take into account sample weights and the sampling procedure used in the survey. Details about the survey are found in Online Appendix B.
do value access to state services affected by abstention, then the standard hypothesis could be wrong and compulsory voting could increase political inequality rather than reduce it.
3
Research Design and Data
Our main dataset of over 140 million registered voters is drawn from the individual-level voter record maintained by the Brazilian Superior Electoral Court (Tribunal Superior Eleitoral or TSE). Our analysis is the first to use the full Brazilian individual voter file.6 Specifically, our data mea-sures whether every registered Brazilian voter turned out for the first round of the 2012 municipal elections for mayor and city councilor.
We use educational achievement to measure socio-economic status because education is strongly correlated with income (Lam and Levison, 1991). According to the 2010 census, for example, Brazilians who completed secondary or higher education earned, on average, twice as much as Brazilians with less education. In our data, education is only measured at the time of registration, which means that it will be mismeasured for voters who received further schooling after the date of registration. To avoid the measurement error induced by failure to update registration records, we coarsen the education variable into whether or not the voter completed primary education.7 By age 16—the earliest age at which citizens are eligible to register—completion of basic primary education should be accurately measured.
To estimate the effect of compulsory voting, we use two samples. For younger voters, we define the treatment variable Ti for voter i as 1 if the voter is 18 or older on election day and 0 otherwise. For older voters, Ti is 1 if the voter is 69 or younger on election day. For each sample, we define the forcing variable Xi as the number of days between voter i’s birthday and election day multiplied by -1 for those voters with Ti =0. In all estimation samples, we exclude illiterates as they are not affected by the law.
6We obtained the data after submitting a request to the Brazilian Superior Electoral Court (TSE) (Tribunal Superior
Eleitoral). While initially denied access to the data out of privacy concerns, an appeal to a judge at the court resulted in release of the data. Earlier data were not available.
7Specifically, we code voters who declare their highest education level as "illiterate", "read and write", and "primary
education incomplete" (Ensino Fundamental Incompleto) as having less than primary education. For the older sample, education should be less mismeasured as all voters were re-registered in 1986. In the Online Appendix K, we present separate results for all education levels among this older sample.
Specification and Inference
Our research design identifies the average treatment effect for Brazilian citizens born on October 7, 1994 and October 7, 1942. The age thresholds in the election law allow for the estimation of treat-ment effects using a regression discontinuity (RD) design under the assumption that the potential outcomes of voters are continuous at the threshold (Hahn, Todd and Van der Klaauw,2001). This assumption is plausible here because the timing of births are unlikely to be affected by the precise date of the election.8 Furthermore, covariates appear balanced at the cutoff (see Online Appendix
E) and estimates are generally close to 0 at placebo thresholds (Online Appendix J).
Because the finest resolution with which we observe time of birth is the day of birth, we col-lapse our individual-level data by aggregating turnout by birth-date (or birth-date by level of education) for all individuals born within one year of Xi = 0 (Lee and Card,2008). To estimate treatment effects, we follow conventional practice and use a local linear regression with triangle kernel weighting. In the main text, we present results using a sample-specific bandwidth—the range of data kept around Xi = 0—selected by the Calonico, Cattaneo and Titiunik(2014) algo-rithm. In addition, we estimate standard errors using their robust standard error estimator, as well as present their bias-corrected confidence intervals. Finally, to compute the standard error and confidence interval around the difference between subsamples (more vs less educated), we use the sum of the variances of each point estimate as an estimate of the variance of the difference. In Online Appendix G, we show that our conclusions are robust to an alternative approach that assumes local randomization in a 2 day bandwidth around the threshold.
For our 69–70 year old sample, we estimate treatment effects conditional on being registered. Conditioning on registration could risk the introduction of post-treatment bias because the deci-sion to register could be affected by eligibility for compulsory voting. For our sample of older voters, however, bias is not a concern due to the way that Brazilian electoral law regulates voter
8A potential threat to our inferences is other age-based discontinuities that occur at the 18th and 70th birthday.
Because we compare voters born within days of each other and the fact that the election occurs on a Sunday, bias from other discontinuities seems unlikely as most age based policies, unlike compulsory voting, do not immediately go into effect. Furthermore, the consistency of our results across both thresholds suggest that other age based discontinuities do not affect our overall conclusions. For example, citizens become eligible for a drivers license at age 18, but it is unlikely that individuals obtain their license immediately after their birthday, as passing the exam and processing of paper work would take several days, at a minimum. At the 70 years old threshold, public servants must retire, but because the election occurs on a Sunday, effects of retirement would not be immediate for the public servants in our sample.
registration. According to the law, a voter is removed from the voter rolls only when he or she fails to vote in three consecutive elections. Consequently, among voters turning 70, the absence of compulsory voting cannot cause their registration status to lapse in the first election after they are no longer obliged to vote. To check this empirically, we show in Online Appendix D that there is no discontinuity in the number of registered voters around the threshold.
Among voters turning 18, CV does have an effect on registration as it induces younger voters to register so as to comply with the law. This voter registration effect means we cannot condition on being in the voter registry for voters born in 1994. While the voter registration data gives us complete data on all voters who registered and their turnout decision, to compute the effect of CV, we also require data on the number of voters who failed to register, at least for the 17–18 year old sample. To our knowledge, no administrative data exists that measures the total number of citi-zens born on each day. Instead, we use four waves from the Brazilian National Household Sample Survey (Pesquisa Nacional por Amostra de Domicílios or PNAD) to estimate this quantity. PNAD is a large household survey of over 350,000 individuals and it records birth-date for members of each sampled household.
The raw PNAD survey estimates are noisy even with a large sample size, so we smooth the data using a semi-parametric smoother to provide stable estimates of the number of unregistered voters born on each day in a 1 year window around October 7, 1994. Specifically, to compute these quantities, we fit a flexible generalized additive model (Hastie and Tibshirani,1990) on the PNAD data. The model treats the number of people born on each day as smooth function of day of the year and includes day-of-the-week fixed effects. The number of unregistered voters with a given birth-date is simply the difference between the predicted value and the number of people registered according to the voter registry.9
4
Results
We begin by focusing on citizens born in 1942 because—for this sample—we need not account for the effect of compulsory voting on the decision to register, thus making analysis simpler. The overall result of the paper is summarized in Figure2, which shows the effect of compulsory
vot-9In Online Appendix H, we include specifications that incorporate the extra modeling uncertainty of this step via a
Voluntary Voting Compulsory Voting Voluntary Voting Compulsory Voting
Less Than Primary Education Primary Education or More
0.80 0.85 0.90
−100 −50 0 50 100 −100 −50 0 50 100
Days Until 70th Birthday
T
ur
nout
Figure 2: Effect of Compulsory Voting by Education Status. Dark points represent average turnout in 5 day bins, while gray points represent average turnout in 1 day bins. Blue lines are estimates from a loess model.
ing among voters with less than primary education (left plot) and those with primary education or more (right plot). Citizens past their 70th birthday on election day and for whom turnout is voluntary are plotted on the left of 0, while 69 year olds are on the right of each plot. Unsur-prisingly, compulsory voting increases turnout in both samples. Against the expectations of the existing literature, however, the effect is larger on voters who have completed primary education. Turnout levels under voluntary voting are similar across the two groups, but compulsory voting causes the average turnout level to increase more among the more educated.
Formal estimates of the pattern observed in Figure2 can be found in the top panel of Table
1. For these specifications, we show estimates from local linear regressions estimated separately on each side of the discontinuity in the full sample, the sample of voters with primary education or greater, and the sample of voters with less than primary education. These estimates can be interpreted as the proportion of each sample near the threshold that votes because of compulsory voting ("marginal voters" to use the terminology ofFowler(2015)).10 The RD effect averaged over
10To make this interpretation, one must make a monotonicity assumption that voters are not demobilized by
Age 69–70
All Educated Less Educated Difference
Estimate 0.044 0.067 0.034 0.034 Std. Error 0.004 0.005 0.005 0.007 95% CI [0.035, 0.050] [0.058, 0.076] [0.021, 0.042] [0.020, 0.048] Bandwidth 58 148 53 # of Individuals 237,721 175,553 154,260 Observations 117 297 107 Age 17–18
All Educated Less Educated Difference
Estimate 0.117 0.144 0.057 0.086 Std. Error 0.011 0.017 0.01 0.02 95% CI [0.096, 0.138] [0.113, 0.180] [0.033, 0.074] [0.047, 0.125] Bandwidth 92 89 46 # of Individuals 1,775,920 1,019,661 363,330 Observations 185 179 93
Table 1: Effect of Compulsory Voting on Turnout. Top and bottom panels show estimates for the Age 69–70 and Age 17–18 subsamples, respectively. Table reports coefficients from a triangle kernel weighted local linear regression on turnout rates by day of birth. MSE-optimal bandwidths and robust confidence intervals are estimated using the Calonico, Cattaneo and Titiunik(2014) procedure. The "Difference" column shows the estimated difference between the "Educated" and "Less Educated" samples.
all citizens, irrespective of education, is reported in the first column. We find that compulsory voting increases the probability of turning out by about 0.044.
As shown in the second column in Table1, the RD effect among voters with primary educa-tion or more is about 0.067, while the effect among less educated voters (third column) is about 0.034. In other words, the estimated effect among the more educated is almost two times the effect among those who never completed primary education. As indicated by the fourth column, this difference is statistically significant. These results imply that 13% of more educated voters near the threshold would still not vote under CV, while among less educated voters, 16% would not vote. The proportion of voters, however, who would vote in the absence of CV ("always voters") is 81% in the both strata. To characterize these results slightly differently, the proportion of citizens induced to vote by CV that are educated is 0.45, which is a substantially higher rate than the pro-portion of educated citizens among those who never vote (about 0.25) and those who always vote (about 0.29) irrespective of CV.11 In sum, when subject to voluntary voting, more educated and
11The proportion with primary education among "marginal voters", "always voters", and "never voters" was
vari-less educated voters at the threshold turnout at almost identical rates, but the CV effect is larger for the more educated and consequently increases inequality in turnout.
X
X
X
Full Sample Less than Primary Education Primary Education or More
0.000 0.025 0.050 0.075 100 200 300 100 200 300 100 200 300 Bandwidth Estimate
Figure 3: Robustness to alternative bandwidth choices for the 69–70 year old sample. This plot shows how coefficients vary by using bandwidths ranging from 15 days to 300 days for estimates using the full sample, citizens with primary education or more, or citizens with less than primary education. Points marked with an "X" are bandwidths selected using theCalonico, Cattaneo and Titiunik(2014) procedure. Dashed lines are 95% confidence intervals.
While we rely on theCalonico, Cattaneo and Titiunik(2014) algorithm for choosing the MSE-optimal bandwidth for our main estimates, our point estimates are somewhat sensitive to other bandwidth choices, especially for voters with less than primary education. In Figure3, we show how are estimates vary for all bandwidths between 15 and 300 days. As is evident in the first two panels, point estimates decrease with smaller bandwidths for the full sample and for voters with less than primary education. The difference in effects between more and less educated voters, however, remains consistently large across all bandwidths.
To show that this heterogeneity by education is not limited to those turning 70, we study the age-based discontinuity at 18. As discussed earlier, estimating the effect of compulsory voting among this population is more challenging because turning 18 affects both the propensity to reg-ister and to turnout. While we account for this issue by imputing the number of unregreg-istered
vot-ables analyses. For marginal voters, for example, we use the ratio between the turnout effect among educated voters
to the effect among the full population (with Xi=0) to estimate the relative prevalence of education among marginal
voters to the prevalence of education among all citizens. We then multiply this ratio by the estimated proportion of educated voters in the full population to obtain an estimate of the proportion of marginal voters who are educated. Estimates for always voters and never voters are calculated in a similar fashion.
ers using survey data, our inferences for 17–18 year olds are necessarily more model dependent than the earlier analysis. Furthermore, by not conditioning on registration, the causal estimand for citizens born in 1994 applies to a different population than estimates that only use registered voters.
The bottom panel of Table1shows our RD estimates for 17 and 18 year olds. The first column indicates that compulsory voting increases the overall probability of turning out by about 0.117. Furthermore, as indicated by the second through fourth columns, we again find evidence of sta-tistically significant heterogeneity by education. We find that the effect among the more educated (roughly 0.144) is about two times the size of the effect among the less educated.12 The results for this younger sample parallel the results for the older sample, which increases our confidence in the generalizability of these treatment effects.13
5
Conclusion
Compulsory voting is often recommended as a powerful means to reduce persistent inequalities in political participation that are commonplace in democracies around the world. While CV un-doubtedly reduces these inequalities in many settings, discussions of the effects of compulsory voting often gloss over variations in how CV is implemented in different societies. Just as other efforts to increase participation may inadvertently exacerbate inequality (Berinsky, 2005; Enos, Fowler and Vavreck,2014), evidence we present in this paper indicates that the types of sanctions used to incentivize voters can have negative implications for the distributional effects of CV. Yet to date, most studies of compulsory voting have understood variation in the effects of CV to mainly reflect differences in enforcement and fines. Future research should consider the full menu of sanc-tions that are employed to punish abstainers. If these punishments include restricsanc-tions in access to state services used by wealthier voters, CV may have unwelcome consequences with respect to political inequality.
With respect to the broader consequences of compulsory voting, it is important to stress that our results are conditional on the overall institutional framework already in place. It is possible
12In Online Appendix I, we show the robustness of this result to alternative bandwidths.
13In Online Appendix L, we rule out an alternative explanation that differences by education status reflect differences
that if compulsory voting were removed, the response of parties and other political actors would result in changes to voter mobilization that would exacerbate political inequality in political par-ticipation, rather than reduce it as our results might suggest. A dramatic change in overall turnout levels if compulsory voting were to be removed might lead political parties to disproportionately focus on mobilizing wealthier voters, thus undercutting the equality-promoting effects of remov-ing non-monetary sanctions that drive up turnout among the non-poor. Unfortunately, our design cannot provide firm evidence on these broader consequences without very strong assumptions. Future research on the consequences of compulsory voting with strong non-monetary sanctions that accounts for changes in the mobilizational strategies of political elites would provide valuable evidence for better understanding the institutional determinants of turnout.
References
Angrist, Joshua D and Jörn-Steffen Pischke. 2008. Mostly Harmless Econometrics: An Empiricist’s
Companion. Princeton University Press.
Bechtel, Michael M, Dominik Hangartner and Lukas Schmid. 2015. “Direct Democracy, Turnout, and the Public Policy Effects of Compulsory Voting.” American Jourbal of Political Science . Berinsky, Adam J. 2005. “The perverse consequences of electoral reform in the United States.”
American Politics Research 33(4):471–491.
Calonico, Sebastian, Matias D Cattaneo and Rocio Titiunik. 2014. “Robust Nonparametric Confi-dence Intervals for Regression-Discontinuity Designs.” Econometrica 82(6):2295–2326.
Cattaneo, Matias D, Brigham R Frandsen and Rocio Titiunik. 2015. “Randomization inference in the regression discontinuity design: An application to party advantages in the US Senate.”
Journal of Causal Inference 3(1):1–24.
Enos, Ryan D, Anthony Fowler and Lynn Vavreck. 2014. “Increasing inequality: the effect of GOTV mobilization on the composition of the electorate.” The Journal of Politics 76(01):273–288. Fowler, Anthony. 2013. “Electoral and policy consequences of voter turnout: Evidence from
com-pulsory voting in australia.” Quarterly Journal of Political Science 8(2):159–82.
Fowler, Anthony. 2015. “Regular Voters, Marginal Voters and the Electoral Effects of Turnout.”
Political Science Research and Methods 3(02):e1–e15.
Hahn, Jinyong, Petra Todd and Wilbert Van der Klaauw. 2001. “Identification and estimation of treatment effects with a regression-discontinuity design.” Econometrica 69(1):201–209.
Hastie, Trevor J and Robert J Tibshirani. 1990. Generalized additive models. Vol. 43 CRC Press. Jackman, Simon. 2001. “Compulsory voting.” International encyclopedia of the social and behavioral
sciences pp. 16314–18.
Lam, David and Deborah Levison. 1991. “Declining inequality in schooling in Brazil and its effects on inequality in earnings.” Journal of Development Economics 37(1):199–225.
Lee, David S and David Card. 2008. “Regression discontinuity inference with specification error.”
Journal of Econometrics 142(2):655–674.
Lijphart, Arend. 1997. “Unequal participation: Democracy’s unresolved dilemma presidential address, American Political Science Association, 1996.” American political science review 91(01):1– 14.
McAllister, Ian. 1986. “Compulsory voting, turnout and party advantage in Australia.” Politics 21(1):89–93.
Power, Timothy J. 2009. “Compulsory for whom? Mandatory voting and electoral participation in Brazil, 1986-2006.” Journal of Politics in Latin America 1(1):97–122.
Appendix
A
Laws on Compulsory Voting
1988 Brazilian Constitution
Paragraph 1. Electoral enrollment and voting are: I. mandatory for persons over eighteen years of age; II. optional for:
(a) the illiterate;
(b) those over seventy years of age;
(c) those over sixteen and under eighteen years of age.
Law No. 4737, JULY 15, 1965 (Electoral Code)
Article 7. Voters who fail to vote and who do not justify their absences to the electoral judge within thirty (30) days after the election will pay three (3) to ten (10) percent of the minimum wage in the region, imposed by the electoral judge and charged as provided in Article 367.
Paragraph 1. Without a voting proof, a paid fine or a proper justification in the last election, voters may not:
I. To compete in a test for public office (“concurso público") or to take over a public job;
II. To receive wages, payments, salaries or earnings from public jobs two months after the elec-tion;
III. To participate in a public bid;
IV. To get public loans from a public bank or from the State (in all its levels: Federal, State, municipality etc.);
VI. To renew its enrollment in a public education institution or any education institution super-vised by the government;
VII. To perform any act for which requires discharge from military service or income tax.
Paragraph 2. The Brazilian born or naturalized, over 18 years, may not take the actions listed in the previous paragraph without proof of being listed unless exempted in Articles 5 and 6, Para-graph 1.
Paragraph 3. It will be cancelled the registration of voters who have not voted for three (3) consecutive elections and who have not payed the fine or have not justified their absences within six (6) months from the date of the last election that they were supposed to vote.
Article 8. The Brazilian born who do not register up to 19 years of age or the naturalized Brazilian that do not enlist until a year after acquiring the Brazilian nationality will pay 3 (three) to ten (10) percent of the value of minimum wage in the region imposed by the electoral judge and charged at the time of the voter registration.
Sole Paragraph. The penalty does not apply to non-registered voters that registered to vote up to one hundredth days before the subsequent election up until their 19 years old birthdays.
Article 9. Those responsible for violations of the Articles 7 and 8 will pay one (1) to three (3) minimum wages prevailing in the electoral zone or disciplinary suspension within thirty (30) days.
Article 10. The electoral judge will provide a document of exemption of lawful sanctions to those who do not vote for a justified reason and not registered under Articles 5 and 6, Paragraph 1.
Article 11. Voters may pay the fine for not voting for the electoral judge in the electoral zone they are in if they are outside of their electoral zones and need a voting discharge document issued by the Electoral Court.
B
Survey Details
We hired the survey firm Instituto Análise in 2014 to explore whether penalties for individuals that fail to vote might unequally affect citizens of different social status. The firm interviewed 1230
individuals above 18 years old in face-to-face interviews.
Instituto Análise first selects a randomly stratified sample of municipalities. The stratification
takes into consideration the geographic location of the municipalities (regions and states), its size and its type (countryside, metropolitan region or capital city). In a second stage the firm selects a randomly stratified sample of a set of census blocks (setores censitários) inside of each of these municipalities. In this stage the firm takes into consideration several variables to conduct the stratified randomization, such as median income, literacy and family size. The Brazilian Institute of Geography and Statistics (Instituto Brasileiro de Geografia e Estatística—IBGE) provides statistical information on the municipalities and its census blocks to design the sample. Finally, the results of the survey are weighted to represent the Brazilian population. Calculations of standard errors and confidence intervals incorporates the two stage stratified sampling design.
C
Estimating the Voting Age Population
For the 17–18 year old sample, we estimate the number of living Brazilian citizens born on each day in our estimation window. To do so using the PNAD data, we model the number of people with a birth date on any given day as a smooth function of day of the year, as well a intercept shift by day of the week. Allowing the number of people born each day to vary smoothly by date accounts for seasonality in births, while including day-of-the-week fixed effects adjust for the fact that fewer births occur on weekends.
To show that this modeling strategy is necessary, in figure A.1 we present the per-day total number of births in our registration data for citizens born in a 1 year window around October 7, 1992. Because these individuals are 19 or 20 in 2012, they are all affected by the compulsory voting law and thus differential registration rates by date should be minimal. As is visible in the data, there are relatively more births in March and April than in October. Moreover, there are substantially fewer births, on average, on Saturdays and Sundays than weekdays.
To estimate the total number of eligible voters with birth dates on any given day, we rely on the National Household Survey (Pesquisa Nacional por Amostra de Domicílios or PNAD), a large scale survey administered by the Brazilian census bureau. The target population of the survey is all residents of Brazil and the annual sample size is over 350,000 individuals. Crucially, the PNAD
Sun Mon Tues Wed
Thurs Fri Sat
6000 7000 8000 9000 10000 6000 7000 8000 9000 10000 −200 0 200 −200 0 200 −200 0 200 Day of Birth Number of Registered V oters
Figure A.1: Per-day total number of births, by weekday, for citizens born in a 1 year window around October 7, 1992.
includes date of birth in their public microdata. Specifically, we sum the sampling weights of all respondents born on each day to generate an estimate of the voting age population with every birth-date in our estimation window.1 FigureA.2plots these estimates separately by each day of the week for respondents born in 1994 and 1995.
Figure A.2 shows that the per day estimates are fairly variable, suggesting a considerable amount of sampling error, especially when compared to the registration data plotted in figure
A.1. To generate more stable estimates, we assume that the average number of people with birth dates on each day varies smoothly by day, with an allowance for additive shifts by day of the week. To estimate smoothed day-specific population totals, we fit a generalized additive model (GAM) to a one year window around the target date of October 7, 1994 of the following form:
E[yi] =wi+ f(xi)
where yi is the total number of births on day i, wi is a day of the week fixed effect and xi is
1Because we aggregate data from the 2009, 2011, 2012, and 2013 PNAD, we divide each respondent’s sampling
Sun Mon Tues Wed
Thurs Fri Sat
5000 10000 15000 20000 5000 10000 15000 20000 −200 0 200 −200 0 200 −200 0 200 Day of Birth Estimate
Figure A.2: Estimated number of individuals by birth-date for individuals born in 1994 and 1995. Data has been faceted by day of the week. X axis has been centered at October 7, 1994. Black line is an estimate from a generalized additive model. Points are unsmoothed estimates from the 2009, 2011, 2012, and 2013 PNAD.
the day variable, centered around the threshold. To estimate the model, we use a penalized cubic regression spline with 30 knots evenly spaced across the support of the data. The penalty term is chosen to minimize the generalized cross validation criterion. For details see Wood(2006). The model estimates are represented by the thick black lines in figureA.2.
C.1 Estimating Strata-specific Voting Age Population
Because we report results for several subsamples, when estimating treatment effects for particular populations, we estimate the denominator for the target populations by restricting the PNAD survey samples to the relevant population. When estimating heterogeneous treatment effects by covariate strata, i.e. education, we construct the samples by estimating the GAM separately in each stratum and then aggregate the per-stratum estimates into a combined dataset.
For education, we use self-reported education according to the PNAD survey. While this data is self-reported and thus subject to response biases2, the education data in the voter registry is also
self-reported. If response biases are similar for the two sources, then self-reported education in the PNAD should be a good proxy for self-reported education in the voter registry. For the full voter registry, the proportion of voters without primary education is 50%. In the PNAD, the proportion of voters without a primary education is 53%. The similarity of these proportions across both datasets suggests that differential response bias is not a large concern.
D
Smoothness of the Forcing Variable
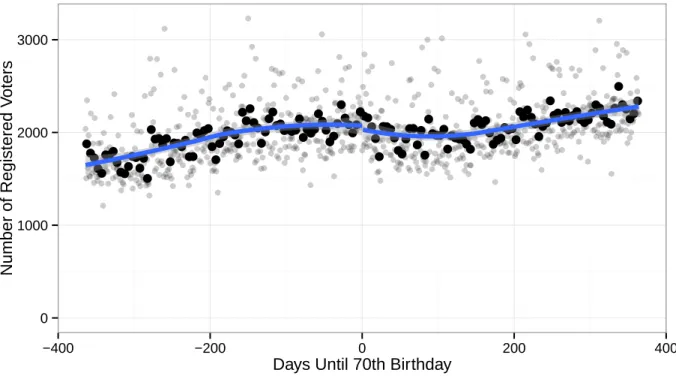
0 1000 2000 3000
−400 −200 0 200 400
Days Until 70th Birthday
Number of Registered V
oters
Figure A.3: Number of registered voters by birthdate for the 1942 sample. Dark points represent average turnout in 5 day bins, while gray points represent average turnout in 1 day bins. Blue lines are estimates from a loess model estimated separately around the threshold
As discussed in the main text, for voters born in 1942, we condition on registration status. To show that this does not induce post-treatment bias, we plot the number of registered voters by each birthdate in Figure A.3. As evidenced by the plot, there is no discontinuous jump at the threshold.
census reported that among residents between 20 and 24, 75% had completed primary education. According to the PNAD for the same age group, we obtained the exact same figure. Both however, are based on self-reported education.
E
Covariate Balance
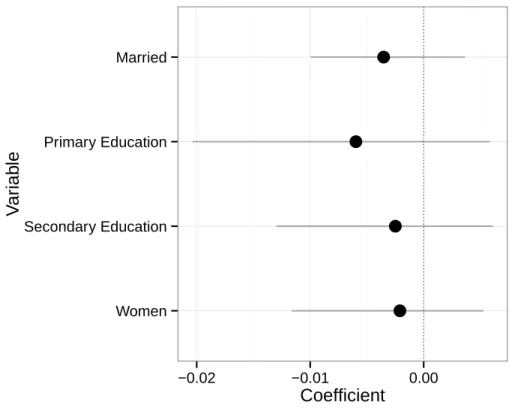
Women Secondary Education Primary Education Married −0.02 −0.01 0.00Coefficient
V
ar
iab
le
Figure A.4: Covariate Balance for 1942 Sample. Dots represent point estimates from a local linear regression and and lines are 95% robust confidence intervals proposed byCalonico, Cattaneo and Titiunik(2014).
While covariates included in the voter registry are few, we checked for smoothness in these pre-treatment variables for voters born in 1942. As evidenced by the point estimates from local linear regressions plotted in FigureA.4, imbalances are small and statistically insignificant.
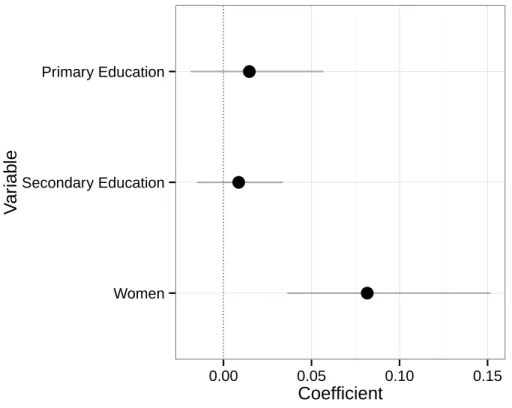
For voters born in 1994, we check balance on the same variables using the PNAD data, as the survey measures variables of interest for the target population. As evidenced by the point estimates from local linear regressions plotted in FigureA.5, imbalances are small for the educa-tion variables.3 For gender, there is some evidence of imbalance. Conditioning on this variable, however, barely changes the point estimate: the effect of compulsory voting on turnout in the full sample after controlling for gender is 0.119, which is virtually identical to the estimate reported in the main text.
Women Secondary Education Primary Education 0.00 0.05 0.10 0.15
Coefficient
V
ar
iab
le
Figure A.5: Covariate Balance for the 1994 Sample. Dots represent point estimates from a local linear regression and lines are 95% robust confidence intervals proposed byCalonico, Cattaneo and Titiunik(2014).
F
Discontinuity Plot for 17–18 Year Old Sample
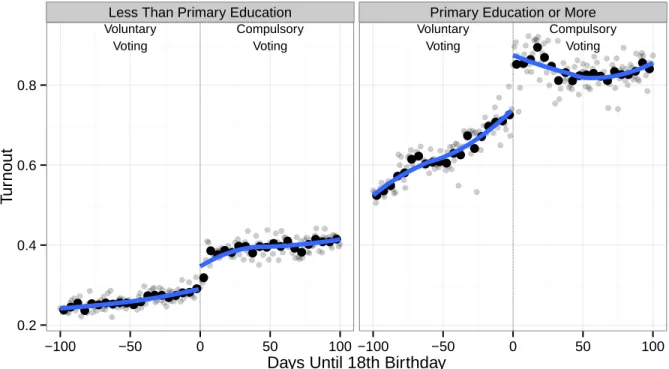
FigureA.6shows discontinuities in turnout by education status for 17 and 18 year olds.
G
Alternative Results Under a Local Randomization Assumption
In this paper, we follow the advice of Lee and Card (2008) and aggregate our data to the day-of-birth-level, which is the finest level of resolution of our forcing variable. This approach is conservative because it increases standard errors relative to standard approaches that treat all respondent observations as IID. As argued by Lee and Card (2008), regression discontinuities with discrete forcing variables may be inconsistent with the standard theoretical results (Hahn, Todd and Van der Klaauw, 2001) because the discrete nature of the forcing variable no longer allows for the computation of averages within arbitrarily small neighborhoods of the threshold.
Voluntary Voting Compulsory Voting Voluntary Voting Compulsory Voting
Less Than Primary Education Primary Education or More
0.2 0.4 0.6 0.8
−100 −50 0 50 100 −100 −50 0 50 100
Days Until 18th Birthday
T
ur
nout
Figure A.6: Effect of Compulsory Voting by Education Status for the 17–18 Year Old Sample. Dark points represent average turnout in 5 day bins, while gray points represent average turnout in 1 day bins. Blue lines are estimates from a loess model.
to model the true underlying regression function and they recommend that analysts adjust their uncertainty estimates to reflect this potential source of error. In their framework, mis-specification error is modeled as a random shock that occurs at the level of the forcing variable unit (i.e. day) and thus this error is correlated for all units with the same value of the forcing variable. This correlation leads to solutions such as clustering standard errors or aggregating to the level of the forcing variable. We follow their latter suggestion and collapse the data to the finest level of resolution of the forcing variable. Additionally, the discretization from exact time-of-birth to day-of-birth is minor relative to similar papers which use year or quarter of birth as the forcing variable and employ the solution proposed byLee and Card(2008).4
One may sidestep this issue by using an alternative identification assumption: local random-ization. In the main text of the paper, we estimate the effect of compulsory voting using a "con-tinuity" approach (Hahn, Todd and Van der Klaauw,2001), which assumes that the conditional
4In practice, using the aggregated or individual level data makes almost no difference to the size of our standard
errors. The standard errors for our aggregated 69–70 year old sample (reported in the main text) are 0.004, 0.005, and 0.005 for the full sample, the more educated sample, and the less educated sample, respectively. For comparison, the standard errors estimated using the individual level data (same bandwidths) are 0.005, 0.006, and 0.006.
Age 69–70
All Educated Less Educated Difference
Estimate 0.031 0.068 0.017 0.051
Std. Error 0.009 0.015 0.011 0.019
95% CI [0.013, 0.048] [0.037, 0.098] [-0.004, 0.038] [0.014, 0.087]
Bandwidth 2 2 2
# of Individuals 8,610 2,439 6,171
Table A.1: Effect of Compulsory Voting on Turnout Under a Local Randomization Assumption. Table reports difference in average turnout between voters born within 2 days after and before the threshold. The "Difference" column shows the estimated difference between the "Educated" and "Less Educated" samples. Standard errors are heteroskedasticity consistent.
expectation of potential outcomes is continuous at the threshold. An alternative framework for an-alyzing regression discontinuities is the "local randomization" approach (Cattaneo, Frandsen and Titiunik,2015), which treats assignment to treatment "as if" randomly assigned near the threshold. Under this assumption, one can analyze the data within the chosen bandwidth as a randomized experiment. Given the arbitrary nature of the threshold and the lack of an obvious mechanism that would make voters born immediately before October 7, 1942 systematically different from those born immediately after, we analyze our data under this alternative assumption. We restrict our analysis to 69–70 year-old sample to avoid the differential registration problem in the 17–18 year old sample.
To estimate treatment effects, we use the difference-in-mean estimator on voters born either 2 days before or after the threshold. In other words, our treatment group is composed of voters born on the October 7 and 8, while the control group is composed of those born in the two days preceding that date. First, we check if the number of voters in treatment and control are consistent with random assignment with probability 1/2. A simple binomial test reports a p-value of 0.87, which is consistent with "as if" random assignment. Treatment effects can be found in TableA.1. These estimates are similar to our local linear estimates and the same basic pattern is evident: compulsory voting has much stronger effects on more educated voters than less educated voters.
Dependent variable: DV: Turnout (1) (2) Compulsory Voting 0.117∗ 0.074∗ (0.053) (0.013) Primary Education 0.436∗ (0.018)
Compulsory Voting x Primary Education 0.069∗
(0.021) Intercept 0.544∗ 0.287∗ (0.034) (0.008) Bandwidth (Days) 92 92 Number of Individuals 1,775,920 1,775,920 Observations 370 370
Note: Bootstrapped standard errors in parentheses.∗p<0.05
Table A.2: Results for 17–18 year-old sample incorporating sampling uncertainty from PNAD survey. Table reports coefficients from a local linear regression on turnout rates by day of birth and education status. Coefficients on forcing variable have been omitted. Data weighted by the number of registered voters in each birth-date-education cell.
H
Incorporating Sampling Uncertainty for the 17–18 Year-Old Sample
As discussed in the text, we impute the number of 17- and 18-year-old citizens born on each day from the PNAD surveys administered by the Brazilian government. In our main text we report robust standard errors and confidence intervals that ignores the sampling uncertainty from these surveys. To incorporate the sampling uncertainty from the PNAD, we use a two stage procedure where we first resample respondents and primary sampling units within the strata used by the Brazilian census agency and construct turnout-by-day estimation dataset based on this bootstrap sample. We then sample with replacement from this estimation dataset and use this bootstrap sample to compute point estimates. The standard errors we report in TableA.2are the standard deviation of 1000 bootstrapped point estimates. All conclusions remain unchanged. We used the same bandwidth that was selected for the full 17–18 year old sample in Table 1.
X
X
X
Full Sample Less than Primary Education Primary Education or More
0.00 0.05 0.10 0.15 0.20 100 200 300 100 200 300 100 200 300 Bandwidth Estimate
Figure A.7: Robustness to alternative bandwidth choices for the 17–18 year old sample. This plot shows how coefficients vary by using bandwidths ranging from 15 days to 300 days for estimates using the full sample, citizens with primary education or more, or citizens with less than primary education. Points marked with an "X" are bandwidths selected using theCalonico, Cattaneo and Titiunik(2014) procedure. Dashed lines are 95% confidence intervals.
I
Robustness to Alternative Bandwidth Choices
For the 17-18 year-old sample, we evaluate robustness of our point estimates to different band-width choices. In FigureA.7, we show how point estimates vary for bandwidths ranging from 15 days to 300 days. In all cases, we use the local linear estimator with triangle kernel weighting. Dashed lines are conventional 95% confidence intervals. While point estimates tend to diminish as bandwidth decreases (especially for voters with less than primary education), the gap between estimates for more and less educated voters remains for all bandwidths.
J
Placebo Thresholds
As an indirect test of the continuity assumption, we estimate treatment effects at placebo thresh-olds in both our sample. As shown in FiguresA.8andA.9, estimates at placebo cutoffs are gener-ally close to 0.
−0.02 0.00 0.02 0.04 −200 0 200 Threshold Estimate
Figure A.8: Placebo Thresholds (69–70 Year Old Sample). Each dot represents a point estimate from a local linear regression using different thresholds of the forcing variable. With the exception of the threshold at 0, all other cutoffs are "placebo" thresholds. Bandwidths selected using the
Calonico, Cattaneo and Titiunik(2014) procedure.
K
Heterogeneity by All Levels of Education.
In the main text, we aggregate our education variable into having completed primary education or not. Aggregating the data in this way is especially important for the 17–18 year-old sample because voters may go onto receive more education after registering and this would not be re-flected in our data. For the 69–70 year-old sample, this is less of a concern because all voters were re-registered in 1986 and thus the data will reflect their education level when they were 43 or 44 (or later) years old. Generally, education data is only updated when a voter re-registers due to a change in residence and they wish to change their assigned polling location.
In FigureA.10, we report our estimates by the most disaggregated education data available. As evident by the plot, effect estimates increase monotonically from "read and write" (i.e. no formal education) through "secondary education incomplete". From "Secondary Education Completed" through "College Completed", however, there is no clear trend. In all cases, however, estimates for "Primary Completed" or above are larger than the estimates for "Primary Incomplete" and "Read
−0.05 0.00 0.05 0.10 −200 0 200 Threshold Estimate
Figure A.9: Placebo Thresholds (17–18 Year Old Sample). Each dot represents a point estimate from a local linear regression using different thresholds of the forcing variable. With the exception of the threshold at 0, all other cutoffs are "placebo" thresholds. Bandwidths selected using the
Calonico, Cattaneo and Titiunik(2014) procedure.
and Write". The number of voters who fall into the more educated categories is small relative to those with less education, which make the estimates more variable (as reflected in the wider confidence intervals).
L
Lack of Information as an Alternative Mechanism
An alternative hypothesis that might explain the observed heterogeneity in treatment effects is a correlation between information about the compulsory voting law and education. Some voters might not know that voting is voluntary starting at 70, for example, and continue to vote be-cause they erroneously believe they will be sanctioned if they abstain. If this lack of information is correlated with education, then the larger effect of compulsory voting on the more educated might simply be a function of greater information. To test for this possibility, we asked survey respondents the age at which voting becomes compulsory (i.e. 18) and the age at which it be-comes voluntary once again (i.e. 70). If the proportion of respondents answering correctly to these
Read and Write Primary Incomplete Primary Completed Secondary Education Incomplete Secondary Education Completed College Incomplete College Completed
0.00 0.05 0.10 0.15 Coefficient
Education
Figure A.10: Effects of Compulsory Voting by All Education Levels. Plot reports coefficients from a triangle kernel weighted local linear regression on turnout rates by day of birth. MSE-optimal bandwidths and robust confidence intervals are estimated using theCalonico, Cattaneo and Titiu-nik(2014) procedure.
questions is correlated with education, then this alternative explanation becomes more plausible. In FigureA.11, we plot the proportion of respondents who know the correct ages as a function of educational attainment. In addition to plotting the estimates from the full sample, we also present estimates from voters over 60 and voters under 30.
In the case of the 18 year old threshold in the full sample, there is a positive correlation be-tween knowing the correct answer and education. This correlation is driven by the difference between voters who completed less than primary education and voters with secondary or higher educational attainment. Knowledge about the threshold at age 70 in the full sample, however, exhibits a negative, albeit modest, correlation with education status. While the correlation between education and knowledge is consistent with the alternative explanation in the case of the thresh-old at 18, knowledge about the 70 year thresh-old threshthresh-old does not fit the alternative theory. Given the consistent pattern of effect heterogeneity by education across both thresholds, the information hypothesis does not account for our results in the full sample. In the subsamples, standard er-rors are larger, which makes our inferences less certain. Nevertheless, we do not find consistent differences across education levels and knowledge, which further supports our hypothesis.
Correctly Stated Age 18 Correctly Stated Age 70 Less than Primary Primary Secondary University Less than Primary Primary Secondary University Less than Primary Primary Secondary University Full Sample Ov er 60 Under 30 0.3 0.6 0.9 0.3 0.6 0.9 Proportion Correct
Figure A.11: Proportion Correctly Stating CV Thresholds by Education Status and Age Group. Estimates taken from a survey asking respondents to provide age at which voting is compulsory (left panel) or voluntary (right panel). Lines represent 95% confidence intervals.


![[PDF] Debuter avec JavaScript document de formation complet | Cours javascript](data:image/gif;base64,R0lGODlhAQABAIAAAP///wAAACH5BAEAAAAALAAAAAABAAEAAAICRAEAOw==)