HAL Id: hal-02651074
https://hal.inrae.fr/hal-02651074
Submitted on 29 May 2020
HAL is a multi-disciplinary open access
archive for the deposit and dissemination of
sci-entific research documents, whether they are
pub-lished or not. The documents may come from
teaching and research institutions in France or
abroad, or from public or private research centers.
L’archive ouverte pluridisciplinaire HAL, est
destinée au dépôt et à la diffusion de documents
scientifiques de niveau recherche, publiés ou non,
émanant des établissements d’enseignement et de
recherche français ou étrangers, des laboratoires
publics ou privés.
Distributed under a Creative Commons Attribution| 4.0 International License
decrease of the inflammatory response in the pig
Julie Seeboth, Romain Solinhac, Isabelle P. Oswald, Laurence Guzylack-Piriou
To cite this version:
Julie Seeboth, Romain Solinhac, Isabelle P. Oswald, Laurence Guzylack-Piriou. The fungal T-2 toxin
alters the activation of primary macrophages induced by TLR-agonists resulting in a decrease of
the inflammatory response in the pig. Veterinary Research, BioMed Central, 2012, 43 (1), pp.35.
�10.1186/1297-9716-43-35�. �hal-02651074�
R E S E A R C H
Open Access
The fungal T-2 toxin alters the activation of
primary macrophages induced by TLR-agonists
resulting in a decrease of the inflammatory
response in the pig
Julie Seeboth, Romain Solinhac, Isabelle P Oswald
*and Laurence Guzylack-Piriou
*Abstract
T-2 toxin is known to be one of the most toxic trichothecene mycotoxins. Exposure to T-2 toxin induces many hematologic and immunotoxic disorders and is involved in immuno-modulation of the innate immune response. The objective of this work was to evaluate the effects of T-2 toxin on the activation of macrophages by different agonists of Toll-like receptors (TLR) using an in vitro model of primary porcine alveolar macrophages (PAM). Cytotoxic effects of T-2 toxin on PAM were first evaluated. An IC50of 19.47 ± 0.9753 nM was determined for the
cytotoxicity of T-2 toxin. A working concentration of 3 nM of T-2 toxin was chosen to test the effect of T-2 toxin on TLR activation; this dose was not cytotoxic and did not induce apoptosis as demonstrated by Annexin/PI staining. A pre-exposure of macrophages to 3 nM of T-2 toxin decreased the production of inflammatory mediators (IL-1 beta, TNF-alpha, nitric oxide) in response to LPS and FSL1, TLR4 and TLR2/6 agonists respectively. The decrease of the pro-inflammatory response is associated with a decrease of TLR mRNA expression. By contrast, the activation of TLR7 by ssRNA was not modulated by T-2 toxin pre-treatment. In conclusion, our results suggest that ingestion of low concentrations of T-2 toxin affects the TLR activation by decreasing pattern recognition of pathogens and thus interferes with initiation of inflammatory immune response against bacteria and viruses. Consequently, mycotoxins could increase the susceptibility of humans and animals to infectious diseases.
Introduction
The Food and Agricultural Organization (FAO) estimates that mycotoxins, secondary metabolites produced by fungi, contaminate 25% of the world’s agricultural commodities. The presence of mycotoxins alters the quality of agricultural products resulting in economical losses estimated in billions dollars annually worldwide [1,2]. The consumption of food and feed contaminated by mycotoxins is a potential health hazard for both humans and animals [3,4]. Among mycotoxins, T-2 toxin is the most common trichothecene mycotoxin belonging to type A and is produced predominantly by Fusarium sporotrichioïdes and F. langsethiae [4,5]. This toxin is known to be the most cytotoxic of the trichothecene family [6]. An exposure of T-2 toxin is associated with
leucopenia and cell depletion in lymphoid organs and inhibition of erythropoiesis in bone marrow and the spleen [7]. Furthermore, T-2 toxin reduces lymphocyte proliferative response [8,9] and disturbs the maturation process of dendritic cells [10] suggesting its immunosup-pressant potency [7,11]. Indeed, it was previously shown that exposure to T-2 suppresses immune response to systemic infections by bacterial infection such as Salmonella typhimurium [12], Listeria monocytogenes [13], Mycobacterium bovis [13], Babesia microti [14]. Respiratory immune defences are also compromised by T-2 exposure. Indeed Li et al. [15] showed that systemic T-2 exposure increases the severity of respiratory reovirus infection with marked exacerbation of broncho-pneumonia and modulation of cytokine responses in mice alveolar macrophages.
Among other species, swine react most sensitively to the exposure to trichothecenes [16]. Pigs are particularly
* Correspondence:[email protected];laurence.guzylack@
toulouse.inra.fr
Institut National de Recherche Agronomique, Toxalim– UMR 1331, 180,
chemin de Tournefeuille, Toulouse Cedex 931027, France
© 2012 Julie et al.; licensee BioMed Central Ltd. This is an Open Access article distributed under the terms of the Creative Commons Attribution License (http://creativecommons.org/licenses/by/2.0), which permits unrestricted use, distribution, and reproduction in any medium, provided the original work is properly cited.
interesting as a target species for mycotoxin due to their diet rich in cereals and because the pig shares strong similarities with the human immune system [17]. Moreover, swine are the target of several pathogenic agents responsible for many respiratory diseases such as Influenza virus, porcine reproductive and respiratory syndromes (SPRD), or bacteria as Haemophilus parasuis. Then, mycotoxins, especially T-2 toxin, could play a determining role in lowering the immune response of pigs to these bacterial and viral infections.
Macrophages play a key role in the immune response being the first cells to be exposed to microorganisms. These cells are considered as sentinel cells against infec-tious pathogens and involved in phagocytosis, antigen presentation, production of antimicrobial effector molecules and release of cytokines and chemokines that in turn contribute to immune cell recruitment and activation [18-20]. The recognition of microorganisms by macrophages occurs through a major receptor family expressed in distinct cell subsets and tissues called the Toll-Like Receptors (TLR) [21-23]. They are able to bind to a wide range of motifs derived from bacteria (lipopoly-saccharide (LPS), peptidoglycan), parasites, fungi and viruses (ssRNA, dsRNA, CpG DNA) [21,24]. Interaction of TLR with its specific ligands leads to the induction of various inflammatory cytokines such as IL-1β and TNF-α [25] and reactive nitrogen species [26]. This pro-inflammatory response is the first line of defence against infections.
Since macrophages are privileged targets of T-2 toxin [10,27,28], it is important to better understand how this toxin can impair their function. In the current study, we investigated the effect of T-2 toxin on macrophage activation. We especially measured the ability of T-2 toxin to inhibit the production of inflammation media-tors upon TLR activation as well as the effect of this toxin on TLR gene expression.
Materials and methods
Isolation, phenotype and culture of macrophages
Porcine alveolar macrophages (PAM) from 6- to 8-week-old pigs were isolated by three time bronchoal-veolar lavages using cold PBS (Invitrogen, Auckland, NZ). Bronchoalveolar fluids were centrifuged at 400 g for 15 min at 4°C and cell viability was assessed using Trypan blue exclusion. Next, the cells were frozen in li-quid nitrogen in 90% FBS and 10% DMSO. After thaw-ing, the cells were adjusted to a cell concentration of 2 × 10⁶ cells/mL in RPMI (Invitrogen) supplemented with 10% FBS, 1% penicillin-streptomycin (Invitrogen), 1% non essential amino acid (Sigma Aldrich, Ayshire, UK) and 1% L-glutamin (Eurobio, Courtaboeuf, France).
The phenotypic identification of PAM was realized by analyzing the expression of differentiation or maturation
markers: SWC1, SWC3, CD14, CD16, CD163, MHCII and DC-sign. Anti-SWC1 IgM 11-305-44 and rabbit-DC-sign antibodies were a kind gift from Dr A. Saalmüller (Veterinary University Vienna, Austria) and Dr M. Meng (College of veterinary medicine, Virginia, USA). Respectively, anti-rabbit-FITC antibody was obtained by Invitrogen. Anti-SWC3 antibodies (clones 74-22-15A and 74-22-15), CD14 (CAM36A), CD16 (G7) and MHCII (MSA3) were commercialised by VMRD (Pullman, USA). CD163 antibody (clone EDHu-1) was purchased from AbD Serotec (Oxford, UK). CD206 (clone 122D2.08) was commercialized by dendritics (Lyon, France). Reaction of all mAbs was revealed using isotype specific FITC, phycoerythrin, or biotinylated IgG F(ab)’2 fragments. Biotinylated conjugates were detected with streptavidin-Cy5-phycoerythrin. All conjugates were purchased from Southern Biotechnology Associates (Birmingham, USA). A negative control containing only conjugated-antibodies was used to visualise a non specific labelling.
PAM were incubated with different doses of T-2 toxin (Sigma Aldrich) for 1 h at 39°C in a humidified atmos-phere with 5% CO2 and were activated by different
specific TLR-agonists during 16 h at 39°C. Indeed, 39°C is the physiological temperature for pigs. Preliminary experiments indicate an optimal production of cytokines by PAM after 16 h of culture in contact with TLR-agonists. TLR-agonists were used with the following concentrations: TLR2-L (HKLM) [10 μg/mL], TLR4-L (LPS) [10 μg/mL], TLR2/6-L (FSL1) [1 μg/mL] and TLR7-L (Imiquimod) [10 μg/mL] (Invivogen, Toulouse, France). The negative control was a dilution of DMSO solution (vehicle of T-2 toxin) used at the higher concen-tration of T-2 toxin tested in the experiments. As a posi-tive control of PAM activation, cells were stimulated with a combination of LPS [5 μg/mL] (Sigma Aldrich) and IFN-γ [1 ng/mL] (Biosource International, Camarillo, USA). After 4 h of activation, cells were isolated to inves-tigate mRNA expression by quantitative real-time PCR analysis. After 16 h of activation, cells were harvested to evaluate the nitric oxide production and culture super-natant were also collected for pro-inflammatory cytokine analysis.
Cytotoxicity, mitochondrial transmembrane potential and apoptosis assays
Cytotoxicity of T-2 toxin on PAM was measured by Cell-Titer-Glo luminescent cell viability assay (Promega, Madison, USA). This test is based on the quantification of the ATP assumed to be produced by metabolically active viable cells. It was used according to the manufac-turer’s protocol. PAM were treated during 16 h at 39°C with different concentrations of T-2 toxin: 0.3; 1; 3; 10; 30 and 100 nM. A negative control using cells without T-2 toxin treatment was in correspondence to 100% of
cell viability. All experiments were performed in tripli-cate and repeats on cells came from three different pig-lets. IC50 was determined with SigmaPlot software for
windows version 11.0 (Systat software Inc., Chicago, USA).
For mitochondrial transmembrane potential (ΔΨm)
measurement, cells were treated for 16 h with the same range of T-2 toxin concentrations as previously described. DIOC6probe obtained by Invitrogen was added to 100μL
of cell suspension and was incubated at 39°C for 20 min. ΔΨm was analyzed by flow cytometry with excitation at
488 nm. A negative control without T-2 toxin and a posi-tive control, FCCP (Carbonyl cyanid 4-trifluoromethoxy-phenylhydrasone, Enzo Life Sciences,Villeurbanne, France) at 40 mM were used to determine fluctuation ofΔΨm.
Apoptosis was determined by AlexaFluor488-AnnexinV/ Death cell apoptosis kit (Invitrogen). The cells were col-lected, and 2 × 10⁶cells per mL were resuspended in PBS-1X (pH 7.4) and incubated with AlexaFluor488annexin-V and propidium iodide (PI). The staining was realized according to the manufacturer’s recommendation.
Flow cytometric acquisition was performed on a flow cytometer (FACS Calibur, Becton Dickinson, Franklin Lakes, NJ, USA) using CellQuest software (Becton Dickinson) and FlowJo software for analysis (Ashland, USA).
IL-1β and TNF-α cytokine assays
Concentrations of IL-1β and TNF-α were measured by enzyme linked immuno-absorbent assays (ELISA) using kits specific for porcine IL-1β and TNF-α (R&D Systems, Minneapolis, MN, USA). The plates were washed with PBS/Tw20 and then blocked with PBS containing 1% BSA (w/v) for 1 h at RT. The test supernatants were added to the ELISA plate in duplicate and incubated for 2 h at RT. After washing, the wells were incubated with the biotinylated detection anti-porcine TNF-α/TNFSF1A and anti-porcine IL-1β/IL-1 F2 (R&D Systems) anti-bodies for 2 h at RT. Then, streptavidin-HRP-conjugated antibody (Thermo Fisher Scientific, Courtaboeuf, France) was added for 30 min at RT. Positive reactions were revealed by TMB, a colour substrate (Thermo Fisher Scientific) and reactions were stopped with H2SO4 2 N.
The OD was read at 450 nm. A negative control was in correspondence to non-activated TLR-agonist cells and as a positive control, cells were stimulated with a combination of LPS [5 μg/mL] and IFN-γ [1 ng/mL]. Concentrations obtained in negative control wells were subtracted from the values in treated samples.
Nitric oxide assay
Nitric oxide measurement was performed by DAF-FM diacetate (4-amino-5-methylamino-2′,7′-difluorofluores-cein diacetate) probe. The probe used a non-fluorescent
reactive base able to react to low doses of nitric oxide forming a fluorescent compound which is detectable by flow cytometry. DAF-FM was used at 10 μM according to the manufacturer’s protocol (Invitrogen). After DAF-FM addition, PAM were incubated at 39°C for 30 min then washed twice with PBS. Cells were incubated another time during 15 min at 39°C to allow a complete esterification of intracellular diacetate and the cell fluorescence emission producing nitric oxide were analyzed by flow cytometry. A negative control was in correspondence to non-activated TLR-agonist cells and as a positive control cells were sti-mulated with a combination of LPS [5μg/mL] and IFN-γ [1 ng/mL]. Concentrations obtained in the negative con-trol, including no T-2 toxin and no stimulation with any TLR agonist treatments were subtracted from the values obtained with treated cells.
RNA extraction and quantitative real-time polymerase chain reaction (PCR) analysis
Quantitative real-time PCR was performed to determine the relative TLR −2, -4, -2/6, -7 and iNOS (inducible Nitric Oxide Synthase) mRNA expression levels. Total RNA from 2 × 10⁶ cells/mL unstimulated cells and 2 × 10⁶ cells/mL ligand-stimulated cells in the presence or absence of T-2 toxin was extracted with TRIzol Reagent (Extract all, Eurobio). Concentrations, integrity and quality of RNA were determined spectrophotomet-rically (O.D.260) using Nanodrop ND1000 (Labtech
International, Paris, France). Then, 300 ng of RNA was reverse transcribed and the reverse transcription and real-time PCR steps were performed as previously described [29]. Non-reverse transcribed RNA was used as the non-template control for verification of a no genomic DNA amplification signal. Specificity of PCR products was assessed at the end of the reaction by analyzing the curve of dissociation. Primers were purchased from Invitrogen. Primers used for real time quantitative polymerase chain reaction are described in Table 1 [30-34]. Amplification efficiency and initial fluor-escence were determined by the DART-PCR method, then the values obtained were normalized with house-keeping genes, ribosomal protein L32 (RPL32) and beta2-microglobulin. Finally, relative gene expression was expressed in comparison to the control culture corresponding to unstimulated cells.
Statistics
A Fisher’s test was realized followed by the Student’s t-test to compare values between multiple groups. The statistical analysis of the data was carried out with Statview software (Statistical Analysis System; SAS for Windows 98; SAS Institute Inc., Cary, NC, USA). A P value of less than 0.05 was considered to be statistically significant.
Results
Phenotypic characterization of primary porcine alveolar macrophage cells (PAM)
The specific staining with different markers confirmed that more than 95% of the cultured cells were PAM displaying the following phenotypes: SWC3high, SWC1+, CD163high, CD14-, CD16+, MHCII+ and DC-sign+ (Additional file 1: Figure S1).
Cytotoxicity effects of T-2 treatment on PAM
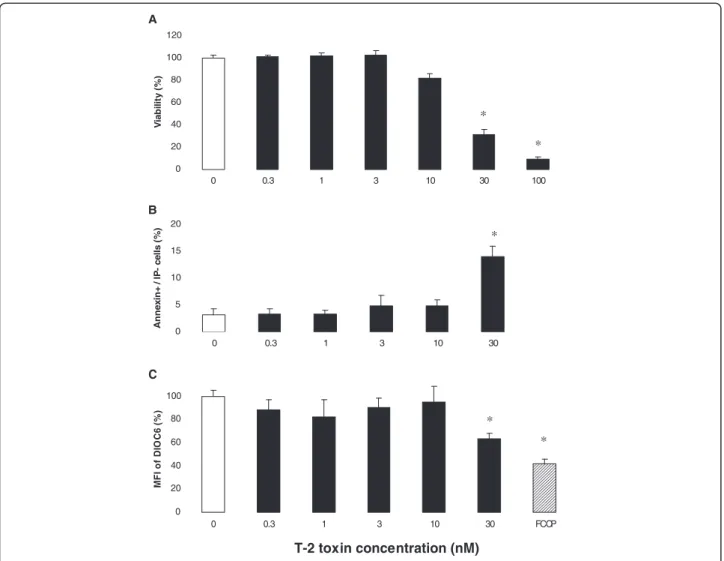
A dose-dependent effect of T-2 toxin on cell viability was demonstrated by measuring the cellular ATP level after ex-posing PAM to increasing concentrations of the toxin (Fig-ure 1a). T-2 toxin did not induce a cytotoxic effect on PAM from 0.3 to 3 nM while exposure to 10 nM of T-2 toxin reduced the ATP level to 82% compared to the untreated cells. At 30 nM, T-2 toxin induced a dramatic drop of cell viability leading to only 31.4% of ATP level compared to the control. IC50value deducted from the dose–response curve
was estimated at 19.47 nM +/− 0.9753 nM.
To determine if the loss of cell viability is a consequence of an apoptotic process, the identification of early apoptotic cells was measured using FITC-annexinV reagent in conjunction with a vital dye, propidium iodide (PI). T-2 toxin (<10 nM) did not induce apoptosis (Figure 1b). Only concentrations over 30 nM produced a significant increase of Annexin+/PI -cells (14%), revealing apoptosis of macrophages.
Apoptosis is associated with a loss of mitochondrial membrane potential (Δψm). To confirm the loss of via-bility induced by T-2 toxin (Figure 1a and b), a DIOC6 staining which is a mitochondrial-specific and voltage-dependent dye was carried out (Figure 1c). As expected, treatment by FCCP, a potent reversible inhibitor of mito-chondrial oxidative phosphorylation, used as a positive control, induced a significant decrease of 41.6% of the DIOC6 signal. From 0.3 to 10 nM, T-2 toxin did not affect Δψm, while 30 nM of T-2 toxin significantly
reduced Δψm of PAM (63.6% of MFI compared to the control). Thus, DIOC6 staining results confirmed the in-duction of the apoptosis by high dose of T-2 toxin and demonstrated the similar dose–response regarding ATP level and mitochondrial membrane potential. Based on these results, a concentration of 3 nM was chosen for the following studies.
Alteration of macrophage activation by T-2 toxin
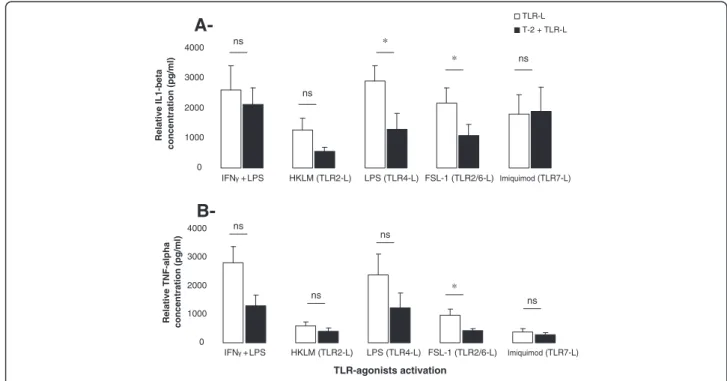
To investigate the effects of T-2 toxin on macrophage activation, the cells were exposed for 1 h to 3 nM of T-2 toxin before being treated with different TLR-agonists during 16 h (TLR2, TLR4, TLR2/6 and TLR7 agonists). Two cytokines involved in the inflammation process were measured to determine the macrophage activation status: IL-1β and TNF-α. The positive control (combin-ation of LPS and IFN-γ) led to high production of both IL-1β and TNF-α, at levels similar to those found with TLR4 agonist (Figure 2a and b). Basal levels of both IL-1β and TNF-α concentrations obtained in the nega-tive control including neither T-2 toxin nor stimulation with TLR-agonists were set off. However, cytokine levels were different depending on the nature of TLR-agonists, demonstrating a specific ability of each TLR-agonist to induce a particular level of cytokine responses in PAM. In particular, TLR2, TLR2/6 and TLR7 agonists seem to induce lower production of TNF-α compared to TLR4 and IFN-γ/LPS (Figure 2b).
Pre-exposure to 3 nM of T-2 toxin significantly decreased both IL-1β and TNF-α induced by TLR2/6 agonist (50.4% and 55.9% reduction of production respectively) and only a significant decrease of IL-1β induced by TLR4 agonist (55.6%). Interestingly, pre-treatment with T-2 toxin did not affect the production of IL-1β and TNF-α cytokines in response to TLR7-agonist activation (Figure 2a and b).
Table 1 Primers used for real time quantitative polymerase chain reaction. List of gene sequences and primers (For: Forward; Rev: Reverse) used for real-time qPCR of immune-related genes
Oligo Names Medline mRNA Sequence Sequence 5′ ! 3′ Reference
β2-microglobuline For
β2-microglobuline Rev MN_213978 TTCTACCTTCTGGTCCACACTGATCATCCAACCCAGATGCA
[34] RPL32 For RPL32 Rev MN_001001636 TGCTCTCAGACCCCTTGTGAAG TTTCCGCCAGTTCCGCTTA [32] iNOS For iNOS Rev
EST BI344008 GAGAGGCAGAGGCTTGAGAC
TGGAGGAGCTGATGGAGTAG [30] TLR2 For TLR2 Rev AB085935 TCACTTGTCTAACTTATCATCCTCTTG TCAGCGAAGGTGTCATTATTGC [33] TLR4 For TLR4 Rev AB188301 GCCATCGCTGCTAACATCATC TCAGCGAAGGTGTCATTATTGC [33] TLR6 For TLR6 Rev AB085936 AACCTACTGTCATAAGCCTTCATTC GTCTACCACAAATTCACTTTCTTCAG [33] TLR7 For TLR7 Rev AB258453 CAGAAGTCCAAGTTTTTCCAGCTT GGTGAGCCTGTGGATTTGTTG [31]
Alteration of iNOS gene expression and nitric oxide production induced by macrophage activation after T-2 toxin treatment
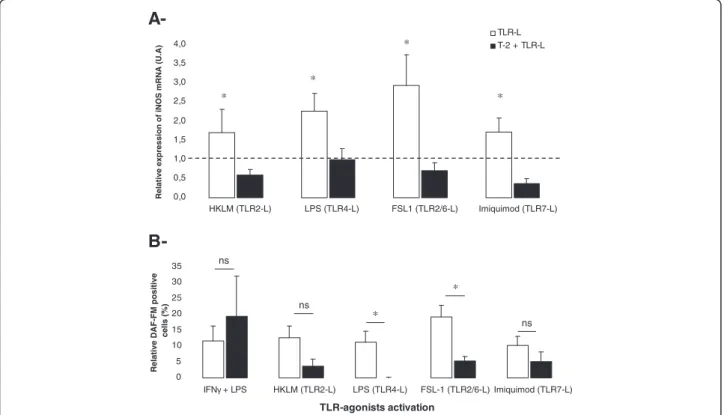
Nitric oxide (NO) production plays an important role in the protection against intracellular microbiostasis. NO, produced by macrophages in response to specific stimuli is catalyzed by inducible Nitric Oxide Synthase (iNOS). Relative gene ex-pression of iNOS was assessed by quantitative real time PCR (Figure 3a). As expected, TLR-agonists induced a significant increase of iNOS expression. By contrast, pre-treatment with T-2 toxin abrogated expression of iNOS induced by all TLR-agonists used. Relative gene expression of iNOS was closer than the expression of negative controls. To confirm
these results,the inhibition of NO production in activated PAM by a T-2 toxin pre-treatment was investigated. The production of NO was measured by flow cytometry, using the DAF-FM probe (Figure 3b). As observed for pro-inflammatory cytokines, IFN-γ/LPS combination as well as TLR-agonist stimulation led to NO production by macrophages, thereby confirming the activation process. However, T-2 pre-treatment did not seem to affect production of NO by IFN-γ/LPS co-stimulation. In addition, T-2 toxin pre-treatment significantly decreased to 100 and 72.5% the NO production after activation by TLR4 and TLR2/6 agonists respectively. T-2 toxin pre-ex-posure has also non-significantly decreased (p = 0.06 and
A 0 20 40 60 80 100 120 V ia b ilit y ( % ) * * B 0 5 10 15 20 A n n e xi n + / I P - ce ll s ( % ) * C 0 20 40 60 80 100 0 0.3 1 3 10 30 100 0 0.3 1 3 10 30 0 0.3 1 3 10 30 FCCP T-2 toxin concentration (nM) MF I o f D IO C 6 ( % ) * *
Figure 1 Cell viability and apoptosis induced by T-2 toxin in porcine alveolar macrophages (PAM). A-Decrease of cell viability in PAM
treated with different T-2 toxin concentrations. PAM cultures were exposed to 0.3–100 nM of T-2 toxin for 16 h. Cell viability was assessed by
measurement of ATP release. B- Increase of apoptosis in PAM as a function of different T-2 toxin concentrations. PAM cultures were exposed to 0.3 to 30 nM of T-2 toxin. Apoptotic cells were analyzed by flow cytometry using a double staining AnnexinV/IP. C- Decrease of mitochondrial
membrane potential (Δψm) in PAM treated with T-2 increasing toxin concentrations. PAM cultures were exposed to 0.3 to 30 nM of T-2 toxin,
followed by flow cytometry analysis of DIOC6 probe. A positive control, FCCP (Carbonyl cyanide 4-(trifluoromethoxylphenylhydrazone)) was used to
establish a loss of mitochondrial membrane potential (Δψm). All data were reported to the negative control including only the vehicle (0-DMSO),
used as 100% of cell viability. Data are shown as mean +/− SEM with PAM from three different piglets are shown and were performed in triplicate.
p= 0.32) the production of NO initiated by the ligands of both TLR2 and−7 (69.8 and 49.0% reduction of produc-tion). These data suggest that T-2 treatment alters the im-plementation of pro-inflammatory response which is initiated by TLR-agonists. Transcriptomic data of iNOS gene expression could partially explain the decrease of NO production by porcine alveolar macrophages observed with DAF-FM staining.
Effects of T-2 toxin on mRNA expression of TLR
To understand the decrease of the pro-inflammatory response, the effect of T-2 toxin on the mRNA expression of specific TLR was evaluated. As expected, treatment of PAM by specific TLR-agonists, led to significant increase in relative mRNA expression of specific TLR (Table 2). It is worth men-tioning that T-2 pre-exposure did not lead to a complete in-hibition of the mRNA expression. However, a pre-incubation with 3 nM of T-2 toxin before activation induced a significant decrease of 60.1%, 64.3% and 68.8% of relative expression of TLR2, TLR4 and TLR2/6 mRNA expression respectively (Table 2). Remarkably, T-2 toxin did not significantly reduce mRNA expression of TLR7.
Effects of T-2 toxin on the expression of cell surface receptors of macrophages
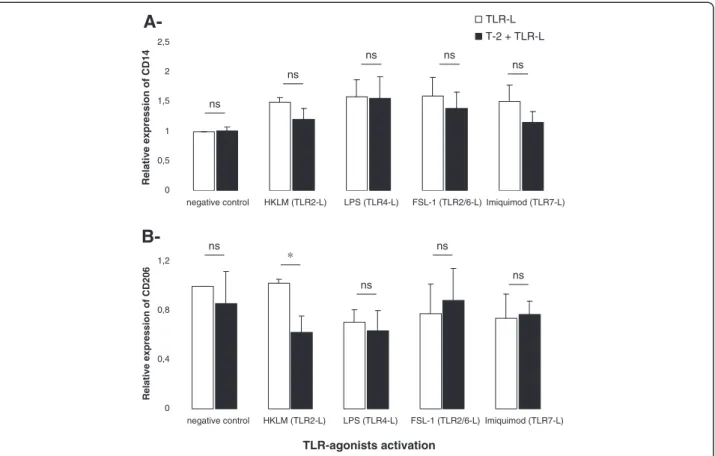
In order to examine the specificity of action of T-2 toxin on cell surface receptors, we analyzed the expression
by flow cytometry of two receptors, namely CD14 (co-re-ceptor with the TLR4 for the detection of bacterial LPS) and CD206 (macrophage mannose receptor) present on the cell surface, after treatment with T-2 toxin (Figure 4). Sur-prisingly and in contrast to the T-2 toxin action observed on TLR expression, the expression level of both receptors was not affected by the presence of T-2 toxin (Figure 4). Moreover, TLR-agonist stimulation did not induce an in-crease of expression of these two cell surface markers.
Discussion
Pigs are preferential targets of many respiratory diseases caused by bacteria such as Pasteurella multocida [35]. Different swine respiratory viruses such as African swine fever virus (ASFV) [36] or porcine reproductive and re-spiratory syndrome virus (PRRSV) [37] also target alveolar macrophages for their replication. It is well established that when incorporated in feed or given in daily doses, T-2 toxin decreases resistance against viral or bacterial infections [12,15]. Moreover, Ziprin et al. [13] showed that the T-2 toxin effect on the course of in vivo bacterial infection depends on the nature of the infectious agent. Based on these different data, the present study is of further interest to address whether T-2 toxin can similarly reduce immune resistance depending on the nature and composition of microbial pathogens, using TLR4 and TLR6-agonists, struc-turally conserved molecules derived from these pathogens.
B-0 1000 2000 3000 4000 IFN TLR-agonists activation Relative TNF-alpha concentration (pg/ml) ns ns * ns ns
A-0 1000 2000 3000 4000 IFN + LPS HKLM (TLR2-L) LPS (TLR4-L) FSL-1 (TLR2/6-L) Imiquimod (TLR7-L) + LPS HKLM (TLR2-L) LPS (TLR4-L) FSL-1 (TLR2/6-L) Imiquimod (TLR7-L) Relative IL1-beta concentration (pg/ml) TLR-L T-2 + TLR-L ns ns * * ns
Figure 2 Concentration of IL-1β and TNF-α in supernatants of PAM pre-incubated with T-2 toxin. Cells were cultured for 1 h in the presence
(black bars) or absence (white bars) of 3 nM of T-2 toxin before their activation with different TLR-agonists: TLR2-agonist (HKLM = 10μg/mL); TLR4-agonist
(LPS = 10μg/mL); TLR2/6-agonist (FSL1 = 1 μg/mL) and TLR7-agonist (Imiquimod = 10 μg/mL) for 16 h. IL-1β (A) and TNF-α (B) concentrations were
determined by ELISA in PAM culture supernatants. Concentrations obtained in negative controls (vehicle) were subtracted from concentration values in
The current study indicates that the immune response implemented by alveolar macrophages is impaired by T-2 toxin. T-T-2 toxin is known to be cytotoxic and to induce apoptosis on immune cells like human monocytes, human dendritic cells and human and rat macrophages
[10,28,38,39]. We observed that after 16 h exposure to T-2 toxin, the cell viability of PAM is affected by 10 nM of T-2 toxin and the IC50 value was evaluated near 20
nM. This concentration was in accordance with other studies on immune cells [10,40]. Cell death may be due
A-
0,0 0,5 1,0 1,5 2,0 2,5 3,0 3,5 4,0Relative expression of iNOS mRNA (U.A)
TLR-L T-2 + TLR-L * * * *
B-0 5 10 15 20 25 30 35 IFN HKLM (TLR2-L) LPS (TLR4-L) FSL1 (TLR2/6-L) Imiquimod (TLR7-L) + LPS HKLM (TLR2-L) LPS (TLR4-L) FSL-1 (TLR2/6-L) Imiquimod (TLR7-L) TLR-agonists activation
Relative DAF-FM positive
cells (%) * ns ns ns *
Figure 3 Analysis of relative expression of iNOS mRNA (A) and nitric oxide (NO) production (B) in PAM pre-treated with T-2 toxin. A- T-2 toxin affects iNOS mRNA expression: Relative mRNA expression of iNOS in PAM treated or not by 3 nM of T-2 toxin for 1 h before their activation with each specific TLR-agonist during 4 h. Data were analyzed with DART-PCR software and iNOS expression was
normalized by the mean of two housekeeping genes (β2-microglobuline and RPL32). Gene expression of iNOS was reported to
unstimulated PAM whose expression is visualized by the line level at 1. Significant differences (P< 0.05) between unstimulated PAM
(negative control) and cells treated (with TLR-agonists in the absence or presence of T-2) are marked with an asterisk. B- T-2 toxin affects NO production: the cells were cultured for 1 h in the presence (black bars) or absence (white bars) of 3 nM of T-2 toxin before their activation with different TLR-agonists: TLR2-agonist (HKLM); TLR4-agonist (LPS); TLR2/6-agonist (FSL1) and TLR7-agonist (Imiquimod) for 16 h. An incubation of both cells and DAF-FM probe was used to determine the production of NO. Mean Fluorescence Intensity (MFI) of
DAF-FM +/− SEM was determined by flow cytometry analysis and then normalized with the negative control. Mean (+/− SEM) of values
obtained with PAM from five different piglets are shown. * indicates a P value< 0.05.
Table 2 Relative mRNA expression of TLR (−2, -4, -2/6 and −7) after T-2 toxin treatment in PAM
negative control TLR-L T-2 + TLR-L
HKLM (TLR2-L) 1 +/− 0.14 76.92 +/− 16.67* 29.08 +/− 8.16 (*), (t)
LPS (TLR4-L) 1 +/− 0.11 17.69 +/− 4.80* 6.32 +/− 1.46 (*), (t)
FSL1 (TLR2/6-L) 1 +/− 0.22 259.90 +/− 75.91* 81.07 +/− 15.62 (*), (t)
Imiquimod (TLR7-L) 1 +/− 0.20 13.66 +/− 3.92* 7.03 +/− 1.66 (*)
Primary porcine cells (2 × 10⁶cells per mL) were exposed or not with 3 nM of T-2 toxin for 1 h before activation during 4 h at 39°C by different TLR-agonists: TLR2-agonist (HKLM); TLR4-agonist (LPS); TLR2/6-agonist (FSL1) and TLR7-agonist (Imiquimod). Relative expression of TLR genes was evaluated by
quantitative real time PCR. Data were analyzed by DART-PCR software and gene expression was normalized by the mean of two housekeeping genes (RPL32 andβ2-microglobuline). TLR gene expression was reported to unstimulated PAM. After checking for the normal distribution of data carried out with one-way ANOVA test, Student test was conducted to determine the differences among groups. The mean (+/− SEM) of the values obtained with PAM from five different piglets are shown. Significant differences (P< 0.05) between unstimulated cells (negative control) and cells treated by each TLR-L are marked with an asterisk (*). Significant differences (P< 0.05) between TLR-L-activated cells in the presence or not of T-2 toxin treatment are marked with (t).
to necrosis or apoptosis. The T-2 toxin is known to induce the apoptosis pathway at varying concentrations depending on the targeted cells [38,39,41,42]. For example, in primary culture cells of hematopoietic progenitors, T-2 toxin induces apoptosis after 3 h of in-cubation with 10 nM of the toxin and a maximum reached at 12 h [43] while in macrophage cell lines (RAW 267.7), T-2 toxin induces less than 5% of apop-totic cells after 6 h of incubation with 5 nM of T-2 toxin [44]. The latter results are comparable to our data. A significant induction of apoptosis was shown with the exposure of 30 nM of T-2 toxin on PAM after 16 h of treatment. In order to avoid possible adverse effects due to cytotoxic and apoptotic process, a non cytotoxic and non apoptotic concentration of 3 nM of T-2 toxin was used for PAM activation studies. Moreover, the dose of 3 nM of T-2 toxin was relevant as a low dose and close to the provisional tolerable daily intake (TDI) of 100 ng / Kg bw / d [4].
Activated macrophages are the primary source of pro-inflammatory cytokines, including IL-1β and TNF-α
[27,45]. Production of these two cytokines, in response to TLR-agonists and notably LPS, could be observed in the present study. Interestingly, after pre-treatment with low doses of T-2 toxin, a reduction of pro-inflammatory cytokine concentrations appeared dependent on the nature of the TLR-agonists. The IL-1β production was reduced after activation by the TLR2-agonist and significantly decreased after TLR4- and TLR6-agonist activation. By contrast, we did not observe a reduction of IL-1β production after activation of Pathogen Associated Molecular Patterns (PAM) by the TLR7-agonist. Similar results were observed regarding TNF-α response.
TLR expressed on antigen presenting cells (APC) such as macrophages, are critical for recognition of the PAMP on microorganisms and their abilities to induce appro-priate immune responses. Extensive research on TLR has been performed in humans and rodents while only a few studies on porcine TLR have been completed. However, most of the studies on swine TLR have clearly demon-strated a correlation between the expression levels of TLR2 and TLR9 expressed in several tissues (lung, heart,
A-0 0,5 1 1,5 2 2,5 Relative expression of CD14 TLR-L T-2 + TLR-L ns ns ns ns ns
B-0 0,4 0,8 1,2
negative control HKLM (TLR2-L) LPS (TLR4-L) FSL-1 (TLR2/6-L) Imiquimod (TLR7-L)
negative control HKLM (TLR2-L) LPS (TLR4-L) FSL-1 (TLR2/6-L) Imiquimod (TLR7-L)
TLR-agonists activation Relative expression of CD206 ns * ns ns ns
Figure 4 Effects of T-2 toxin on the expression of both cell surface receptor on macrophage: TLR4 co-receptor (CD14) and mannose receptor (CD206). Cells were cultured or not for 1 h in the presence (black bars) or absence (white bars) of 3 nM of T-2 toxin before their activation with different TLR-agonists: TLR2-agonist (HKLM); TLR4-agonist (LPS); TLR2/6-agonist (FSL1) and TLR7-agonist (Imiquimod) for 16 h at 39°
C, 5% CO2. Cells were collected and CD14 (A) and CD206 (B) staining were analyzed by flow cytometry. The mean of fluorescence intensity of
both of these two markers was normalized to the negative control. Mean (+/− SEM) of values obtained with PAM from five different piglets are
spleen, small intestine, mesenteric lymph nodes. . .) at the first stages of life and the capacity for newborn piglets to have an early efficient immune function [46,47]. Moreover, similar distribution of TLR on human and swine cells, unlike rodents, has been previously described [48]. Human alveolar macrophages have low TLR2 expression leading to a low production of TNF-α and IL-6 cytokines [49]. Similarly, the TLR2 expression level measured in human bronchoalveolar cells by Juarez et al. [49] could explain the low TNF-α protein concen-tration obtained in response to the TLR2-agonist in this study.
It is known that activation of macrophages by agonists, such as LPS, triggers the enhancement of expression of iNOS leading to NO production [26]. In the present investigation, a T-2 toxin pre-treatment induced a signifi-cant decrease of NO production in PAM activated by TLR4 and TLR2/6 agonists. However, this toxin did not affect NO production after activation of macrophages by either IFN-γ/LPS or TLR2 and −7 agonists. DON and nivalenol also affect the immune response by inhibiting NO production in mice macrophage cell lines in vitro (RAW264) [50]. In addition, this study demonstrated that there is a parallel between the decreasing of NO production and the decreasing of iNOS mRNA gene expression which could partially explain the effect of T-2 toxin on NO production.
Taken together, these results demonstrate the complexity of mycotoxin action depending on the cell activation status and mycotoxin doses. The TLR agonist-sensitized macrophage responds to subsequent toxin challenge with a robust and potentiated cytokine response. By contrast, our study showed that T-2 toxin pre-exposure inhibited naive macrophage to initiate an inflammatory response to TLR-ligands. This inhibition could be attributed to a defect of pathogen pattern rec-ognition due to a T-2 toxin effect on TLR2, -4 and−2/6 expression. Due to a lack of commercially available antibodies for pigs, we could not verify the cell surface expression of these TLR. However, the present study showed that the importance of this inhibition seems to depend on the nature of the TLR. Indeed, the expression of TLR7 mRNA seemed less affected by the toxin. These results were consistent with the less inhibitory effect of T-2 toxin on the inflammatory response when PAM were activated by TLR7-agonist. This one is specifically located on the endosomal membrane and could explain that a T-2 toxin pre-exposure did not appear to disrupt the pro-inflammatory response.
The alteration of TLR expression could possibly influence the functions and efficacy of alveolar macro-phages in terms of antigen processing and release of cytokines. It is tempting to speculate that the sensitized macrophage phenotype depends on both appropriate
surface TLR expressions enabling the recognition of pathogen motifs and the appropriate induction of the cytokine signaling pathway. However, the effects of T-2 toxin seem to be TLR-receptor specific since neither co-receptor CD14 nor mannose co-receptor (CD206) were affected by the toxin. Our group has already shown in a previous study that DON can also inhibit cell surface expression of activation markers of human macrophages such as CD14, CD54, CD119 and HLA-DR [51].
Trichothecenes have the ability to modulate immune function by disrupting intracellular signaling pathways within leukocytes responsible for driving both altered immune-regulatory gene expression as well as apoptosis [52]. A review by Pestka et al. [53] demonstrated the preferential targeting of DON on the activation of mitogen-activated protein kinases (MAPK), thereby leading to the modulation of immune responses and apoptosis [53]. In addition to specific intracellular localization of TLR7, the absence of T-2 toxin action on immune responses after TLR7 agonists activation can be explained by focusing on the specificity of TLR7-signaling pathways. In contrast to other TLR which involved both MAPK and canonical IKK complex for the transcription of inflammatory cytokine genes, TLR7 agonist activates only the IKKα signaling path-way to induce inflammatory cytokines [21].
Based on our finding that the T-2 toxin down-regulated the activation of TLR, it could be hypothesized that expos-ure to low concentrations of T-2 toxin may increase the susceptibility of humans and animals to opportunistic infections. The present study sheds new light on the potential of mycotoxins to interfere with the immune system by decreasing the expression pattern recognition of pathogens, and thus the initiation of immune responses against bacterial and viral infections. These results may help to explain the immunosuppressive effect of T-2 toxin observed in vivo during viral respiratory infection such as reovirus [15].
Given that food and feed are sometimes contaminated by T-2 and other trichothecenes, serious questions remain regarding risks from chronic ingestion of these toxins. Understanding the molecular mode of action of a mycotoxin can assist in predicting potential adverse human and animal health effects.
Additional file
Additional file 1: Figure S1. Morphologic and phenotypic characterization of PAM by flow cytometry using SWC3, SWC1, CD163, CD14, CD16, MHCII and DC-sign staining. This figure is a representative of three independent experiments.
Abbreviations
APC: Antigen presenting cells; ATP: Adenosine-5′-triphosphate; CD: Cluster of
differentiation; DAF-FM diacetate: 4-amino-5-methylamino-2
′,7′-difluorofluorescein diacetate; DON: Deoxynivalenol; FCCP: Carbonyl cyanid
IL-1β: Interleukine 1 beta; iNOS: Induce nitric oxide synthase; LBP: LPS-binding protein; LPS: Lipopolysaccharide; MAPK: Mitogen-activated protein kinases; mRNA: Messenger ribonucleic acid; MyD88: Myeloïd differentiation primary response gene (88); NIV: Nivalenol; NO: Nitric oxide; PAM: Porcine alveolar macrophages; PAMP: Pathogen-associated molecular patterns;
PCR: Polymerase chain reaction; PI: Propidium iodide; PRRs: Pattern recognizing receptors; RNA: Ribonucleic acid; SPRD: Porcine reproductive and
respiratory syndrome; ssRNA: Single strand RNA; TNF-α: Tumor necrosis factor
alpha; TLRs: Toll-like receptors; TLR-L: Toll-like receptors ligand or agonist.
Competing interests
The authors declare that they have no competing interests.
Acknowledgements
JS and RS are grateful to the French Ministry for National Education and Research for providing a financial assistance to this study. The authors gratefully acknowledge Dr Glen Almond working for the pig health and production at the department of Population Health & Pathobiology (North Carolina State University) for valuable discussions of the manuscript and the linguistic correction of English and Dr Thierry Gauthier for the precious help in acquisition data about apoptosis and his implication in the final discussion. The authors are also grateful to Philippe Pinton and Anne-Marie Cossalter for their excellent technical assistance with piglets.
Authors’ contributions
JS contributed to the acquisition, the analysis, the interpretation of cytotoxicity, transcriptomic and proteomic data and prepared the manuscript draft. RS has to take part in the design of this research and he carried out the statistical analysis. IPO contributed to the design but also took part in the drafting of the article and the critical revision of the important intellectual contents. LGP contributed to the acquisition, the analysis and the interpretation of flow cytometry, transcriptomic and proteomic data as well as coordination of the study and preparation of the manuscript. All authors read and approved the final manuscript.
Received: 13 December 2011 Accepted: 24 April 2012 Published: 24 April 2012
References
1. CAST: Concil for Agricultural Science and Technology, Mycotoxins - Risks in
plant, animal and human systems. Ames, (IA): Cast Task Force Report No.
139. 2003, 1–191.
2. Binder E, Tan L, Chin L, Handl J, Richard J: Worldwide occurrence of
mycotoxins in commodities, feeds and feed ingredients. Anim Feed Sci
Technol 2007, 137:265–282.
3. Oswald IP, Comera C: Immunotoxicity of mycotoxins. Revue Méd Vét 1998,
149:585–590.
4. EFSA: Scientific opinion on the risks for animal and public health related
to the presence of T-2 and HT-2 toxin in food and feed. EFSA J 2011, 9:2481.
5. Kokkonen M, Ojala L, Parikka P, Jestoi M: Mycotoxin production of selected
Fusarium species at different culture conditions. Int J Food Microbiol 2010,
143:17–25.
6. Van der Fels-Klerx HJ, Stratakou I: T-2 toxin and HT-2 toxin in grain and
grain-based commodities in Europe: occurence, factors affecting occurence, co-occurence and toxicological effects. World Mycotoxin J
2010, 3:349–367.
7. Nagata T, Suzuki H, Ishigami N, Shinozuka J, Uetsuka K, Nakayama H, Doi K:
Development of apoptosis and changes in lymphocyte subsets in
thymus, mesenteric lymph nodes and Peyer’s patches of mice orally
inoculated with T-2 toxin. Exp Toxicol Pathol 2001, 53:309–315.
8. Rafai P, Tuboly S, Bata A, Tilly P, Vanyi A, Papp Z, Jakab L, Tury E: Effect of
various levels of T-2 toxin in the immune system of growing pigs. Vet Rec
1995, 136:511–514.
9. Rafai P, Bata A, Vanyi A, Papp Z, Brydl E, Jakab L, Tuboly S, Tury E: Effect of
various levels of T-2 toxin on the clinical status, performance and
metabolism of growing pigs. Vet Rec 1995, 136:485–489.
10. Hymery N, Leon K, Carpentier FG, Jung JL, Parent-Massin D: T-2 toxin
inhibits the differentiation of human monocytes into dendritic cells and
macrophages. Toxicol In Vitro 2009, 23:509–519.
11. Meissonnier GM, Laffitte J, Raymond I, Benoit E, Cossalter AM, Pinton P,
Bertin G, Oswald IP, Galtier P: Subclinical doses of T-2 toxin impair acquired immune response and liver cytochrome P450 in pigs. Toxicology
2008, 247:46–54.
12. Tai JH, Pestka JJ: T-2 toxin impairment of murine response to Salmonella
typhimurium: a histopathologic assessment. Mycopathologia 1990,
109:149–155.
13. Ziprin RL, McMurray DN: Differential effect of T-2 toxin on murine host
resistance to three facultative intracellular bacterial pathogens: Listeria monocytogenes, Salmonella typhimurium, and Mycobacterium bovis. Am J
Vet Res 1988, 49:1188–1192.
14. Corrier DE, Wagner GG: Comparison of the effect of T-2 toxin with that of
dexamethasone or cyclophosphamide on resistance to Babesia microti
infection in mice. Am J Vet Res 1988, 49:2000–2003.
15. Li M, Harkema JR, Islam Z, Cuff CF, Pestka JJ: T-2 toxin impairs murine
immune response to respiratory reovirus and exacerbates viral
bronchiolitis. Toxicol Appl Pharmacol 2006, 217:76–85.
16. Pinton P, Guzylack-Piriou L, Kolf-Clauw M, Oswald IP: Effects of some fungal
toxins, the trichothecenes, on the epithelial intestinal barrier. Curr Immunol Rev, in press.
17. Bailey M: The mucosal immune system: recent developments and future
directions in the pig. Dev Comp Immunol 2009, 33:375–383.
18. Laskin DL, Weinberger B, Laskin JD: Functional heterogeneity in liver and
lung macrophages. J Leukoc Biol 2001, 70:163–170.
19. Benoit M, Desnues B, Mege JL: Macrophage polarization in bacterial
infections. J Immunol 2008, 181:3733–3739.
20. Laskin DL, Sunil VR, Fakhrzadeh L, Groves A, Gow AJ, Laskin JD:
Macrophages, reactive nitrogen species, and lung injury. Ann N Y Acad Sci
2010, 1203:60–65.
21. Kumar H, Kawai T, Akira S: Toll-like receptors and innate immunity.
Biochem Biophys Res Commun 2009, 388:621–625.
22. Kawai T, Akira S: The roles of TLRs, RLRs and NLRs in pathogen
recognition. Int Immunol 2009, 21:317–337.
23. Creagh EM, O’Neill LA: TLRs, NLRs and RLRs: a trinity of pathogen
sensors that co-operate in innate immunity. Trends Immunol 2006,
27:352–357.
24. Uematsu S, Akira S: Innate immune recognition of viral infection. Uirusu
2006, 56:1–8.
25. Manicassamy S, Pulendran B: Modulation of adaptive immunity with
Toll-like receptors. Semin Immunol 2009, 21:185–193.
26. Shimomura-Shimizu M, Sugiyama K, Muroi M, Tanamoto K: Alachlor and
carbaryl suppress lipopolysaccharide-induced iNOS expression by differentially inhibiting NF-kappaB activation. Biochem Biophys Res
Commun 2005, 332:793–799.
27. Kankkunen P, Rintahaka J, Aalto A, Leino M, Majuri ML, Alenius H, Wolff H,
Matikainen S: Trichothecene mycotoxins activate inflammatory response
in human macrophages. J Immunol 2009, 182:6418–6425.
28. Sorenson WG, Gerberick GF, Lewis DM, Castranova V: Toxicity of
mycotoxins for the rat pulmonary macrophage in vitro. Environ Health
Perspect 1986, 66:45–53.
29. Meissonnier GM, Pinton P, Laffitte J, Cossalter AM, Gong YY, Wild CP, Bertin
G, Galtier P, Oswald IP: Immunotoxicity of aflatoxin B1: impairment of the cell-mediated response to vaccine antigen and modulation of cytokine
expression. Toxicol Appl Pharmacol 2008, 231:142–149.
30. Meurens F, Girard-Misguich F, Melo S, Grave A, Salmon H, Guillen N: Broad
early immune response of porcine epithelial jejunal IPI-2I cells to
Entamoeba histolytica. Mol Immunol 2009, 46:927–936.
31. Alves MP, Neuhaus V, Guzylack-Piriou L, Ruggli N, McCullough KC,
Summerfield A: Toll-like receptor 7 and MyD88 knockdown by lentivirus-mediated RNA interference to porcine dendritic cell subsets. Gene Ther
2007, 14:836–844.
32. Pinton P, Braicu C, Nougayrede JP, Laffitte J, Taranu I, Oswald IP:
Deoxynivalenol impairs porcine intestinal barrier function and decreases the protein expression of claudin-4 through a mitogen-activated protein
kinase-dependent mechanism. J Nutr 2010, 140:1956–1962.
33. Arce C, Ramirez-Boo M, Lucena C, Garrido JJ: Innate immune activation of
swine intestinal epithelial cell lines (IPEC-J2 and IPI-2I) in response to LPS from Salmonella typhimurium. Comp Immunol Microbiol Infect Dis 2008,
33:161–174.
34. Devriendt B, Gallois M, Verdonck F, Wache Y, Bimczok D, Oswald IP,
Goddeeris BM, Cox E: The food contaminant fumonisin B(1) reduces the maturation of porcine CD11R1(+) intestinal antigen presenting cells and
antigen-specific immune responses, leading to a prolonged intestinal ETEC infection. Vet Res 2009, 40:40.
35. Halloy DJ, Kirschvink NA, Mainil J, Gustin PG: Synergistic action of E. coli
endotoxin and Pasteurella multocida type A for the induction of
bronchopneumonia in pigs. Vet J 2005, 169:417–426.
36. Basta S, Gerber H, Schaub A, Summerfield A, McCullough KC: Cellular
processes essential for African swine fever virus to infect and replicate in
primary macrophages. Vet Microbiol 2010, 140:9–17.
37. Nauwynck HJ, Duan X, Favoreel HW, Van Oostveldt P, Pensaert MB: Entry of
porcine reproductive and respiratory syndrome virus into porcine alveolar macrophages via receptor-mediated endocytosis. J Gen Virol
1999, 80:297–305.
38. Ueno Y, Umemori K, Niimi E, Tanuma S, Nagata S, Sugamata M, Ihara T,
Sekijima M, Kawai K, Ueno I, Tashiro F: Induction of apoptosis by T-2 toxin and other natural toxins in HL-60 human promyelotic leukemia cells. Nat
Toxins 1995, 3:129–137.
39. Sugamata M, Hattori T, Ihara T, Okumura H, Yoshino N, Ueno Y: Fine
structural changes and apoptotic cell death by T-2 mycotoxin. J Toxicol
Sci 1998, 23(Suppl 2):148–154.
40. Huang P, Akagawa K, Yokoyama Y, Nohara K, Kano K, Morimoto K: T-2 toxin
initially activates caspase-2 and induces apoptosis in U937 cells. Toxicol
Lett 2007, 170:1–10.
41. Islam Z, Nagase M, Yoshizawa T, Yamauchi K, Sakato N: T-2 toxin induces
thymic apoptosis in vivo in mice. Toxicol Appl Pharmacol 1998, 148:205–214.
42. Schuhmacher-Wolz U, Heine K, Schneider K: Scientific report submitted to
EFSA. Report on toxicity data on trichothecene mycotoxins HT-2 and T-2 toxin. [http://www.efsa.europa.eu/en/scdocs/doc/65e.pdf.]
43. Le Drean G, Auffret M, Batina P, Arnold F, Sibiril Y, Arzur D, Parent-Massin D:
Myelotoxicity of trichothecenes and apoptosis: an in vitro study on human cord blood CD34+ hematopoietic progenitor. Toxicol In Vitro 2005,
19:1015–1024.
44. Yang GH, Jarvis BB, Chung YJ, Pestka JJ: Apoptosis induction by the
satratoxins and other trichothecene mycotoxins: relationship to ERK, p38
MAPK, and SAPK/JNK activation. Toxicol Appl Pharmacol 2000, 164:149–160.
45. Doll S, Schrickx JA, Danicke S, Fink-Gremmels J: Deoxynivalenol-induced
cytotoxicity, cytokines and related genes in unstimulated or
lipopolysaccharide stimulated primary porcine macrophages. Toxicol Lett
2009, 184:97–106.
46. Shimosato T, Tohno M, Kitazawa H, Katoh S, Watanabe K, Kawai Y, Aso H,
Yamaguchi T, Saito T: Toll-like receptor 9 is expressed on
follicle-associated epithelia containing M cells in swine Peyer’s patches. Immunol
Lett 2005, 98:83–89.
47. Tohno M, Shimosato T, Moue M, Aso H, Watanabe K, Kawai Y, Yamaguchi T,
Saito T, Kitazawa H: Toll-like receptor 2 and 9 are expressed and functional in gut-associated lymphoid tissues of presuckling newborn
swine. Vet Res 2006, 37:791–812.
48. Guzylack-Piriou L, Balmelli C, McCullough KC, Summerfield A: Type-A CpG
oligonucleotides activate exclusively porcine natural interferon-producing cells to secrete interferon-alpha, tumour necrosis factor-alpha
and interleukin-12. Immunology 2004, 112:28–37.
49. Juarez E, Nunez C, Sada E, Ellner JJ, Schwander SK, Torres M: Differential
expression of Toll-like receptors on human alveolar macrophages and autologous peripheral monocytes. Respir Res 2010, 11:2.
50. Sugiyama K, Muroi M, Tanamoto K, Nishijima M, Sugita-Konishi Y:
Deoxynivalenol and nivalenol inhibit lipopolysaccharide-induced nitric oxide
production by mouse macrophage cells. Toxicol Lett 2010, 192:150–154.
51. Wache YJ, Hbabi-Haddioui L, Guzylack-Piriou L, Belkhelfa H, Roques C,
Oswald IP: The mycotoxin deoxynivalenol inhibits the cell surface expression of activation markers in human macrophages. Toxicology 2009,
262:239–244.
52. Pestka JJ, Zhou HR, Moon Y, Chung YJ: Cellular and molecular mechanisms
for immune modulation by deoxynivalenol and other trichothecenes:
unraveling a paradox. Toxicol Lett 2004, 153:61–73.
53. Pestka JJ: Mechanisms of deoxynivalenol-induced gene expression and
apoptosis. Food Addit Contam Part A Chem Anal Control Expo Risk Assess
2008, 25:1128–1140.
doi:10.1186/1297-9716-43-35
Cite this article as: Seeboth et al.: The fungal T-2 toxin alters the activation of primary macrophages induced by TLR-agonists resulting in a decrease of the inflammatory response in the pig. Veterinary Research 2012 43:35.
Submit your next manuscript to BioMed Central and take full advantage of:
• Convenient online submission
• Thorough peer review
• No space constraints or color figure charges
• Immediate publication on acceptance
• Inclusion in PubMed, CAS, Scopus and Google Scholar
• Research which is freely available for redistribution
Submit your manuscript at www.biomedcentral.com/submit