HAL Id: hal-02518543
https://hal.archives-ouvertes.fr/hal-02518543
Submitted on 7 Apr 2020HAL is a multi-disciplinary open access archive for the deposit and dissemination of sci-entific research documents, whether they are pub-lished or not. The documents may come from teaching and research institutions in France or abroad, or from public or private research centers.
L’archive ouverte pluridisciplinaire HAL, est destinée au dépôt et à la diffusion de documents scientifiques de niveau recherche, publiés ou non, émanant des établissements d’enseignement et de recherche français ou étrangers, des laboratoires publics ou privés.
ECT2 associated to PRICKLE1 are poor-prognosis
markers in triple-negative breast cancer
Avais Daulat, Pascal Finetti, Diego Revinski, Mônica Silveira Wagner, Luc
Camoin, Stéphane Audebert, Daniel Birnbaum, Laurent Kodjabachian,
Jean-Paul Borg, François Bertucci
To cite this version:
Avais Daulat, Pascal Finetti, Diego Revinski, Mônica Silveira Wagner, Luc Camoin, et al.. ECT2 as-sociated to PRICKLE1 are poor-prognosis markers in triple-negative breast cancer. British Journal of Cancer, Cancer Research UK, 2019, 120 (9), pp.931-940. �10.1038/s41416-019-0448-z�. �hal-02518543�
1 ECT2 associated to PRICKLE1 are poor-prognosis markers in triple-negative breast 1
cancer 2
Avais M. Daulat1,*, Pascal Finetti2, Diego Revinski1,4, Mônica Silveira Wagner1, Luc 3
Camoin3, Stéphane Audebert3, Daniel Birnbaum2, Laurent Kodjabachian4, Jean-Paul
4
Borg1,3,#,*, and François Bertucci2,#
5
6
7
8
9
1 Centre de Recherche en Cancérologie de Marseille, Equipe labellisée ‘Cell polarity, cell
10
signaling and cancer’ Ligue 2018, Aix Marseille Université, Inserm, CNRS, Institut Paoli 11
Calmettes, 13009 Marseille, France 12
2 Centre de Recherche en Cancérologie de Marseille, Equipe labellisée ‘Predictive oncology’
13
Ligue 2018, Aix Marseille Université, Inserm, CNRS, Institut Paoli Calmettes, 13009 14
Marseille, France 15
3 Centre de Recherche en Cancérologie de Marseille, Marseille Proteomics, Aix Marseille
16
Université, Inserm, CNRS, Institut Paoli Calmettes, 13009 Marseille, France 17
4 Aix Marseille Univ, CNRS, IBDM, Marseille, France
18
19
* To whom correspondence should be addressed: avais.daulat@inserm.fr/
jean-20
paul.borg@inserm.fr/ Phone 33-4-8697-7201, Fax 33-4-8697-7499 21 # Co-lead authors 22 23 24 25
2 Abstract
26
Background: Triple-negative breast cancers (TNBC) are poor-prognosis tumors candidate to 27
chemotherapy as only systemic treatment. We previously found that PRICKLE1, a 28
prometastatic protein involved in planar cell polarity, is upregulated in TNBC. We 29
investigated the protein complex associated to PRICKLE1 in TNBC to identify proteins 30
possibly involved in metastatic dissemination, which might provide new prognostic and/or 31
therapeutic targets. 32
33
Methods: We used a proteomic approach to identify protein complexes associated with 34
PRICKLE1. The mRNA expression levels of the corresponding genes were assessed in 8,982 35
patients with invasive primary breast cancer. We then characterized the molecular interaction 36
between PRICKLE1 and the guanine nucleotide exchange factor ECT2. Finally, experiments 37
in Xenopus were carried out to determine their evolutionarily conserved interaction. 38
39
Results: Among the PRICKLE1 proteins network, we identified several small G-protein 40
regulators. Combined analysis of the expression of PRICKLE1 and small G-protein regulators 41
had a strong prognostic value in TNBC. Notably, the combined expression of ECT2 and 42
PRICKLE1 provided a worst prognosis than PRICKLE1 expression alone in TNBC. 43
PRICKLE1 regulated ECT2 activity and this interaction was evolutionary conserved. 44
45
Conclusions: This work supports the idea that an evolutionarily conserved signaling pathway 46
required for embryogenesis and activated in cancer may represent a suitable therapeutic 47
target. 48
49
Keywords: PRICKLE1, ECT2, signaling, therapeutic targets, Triple Negative Breast Cancer 50
3 51
52
Introduction 53
Triple-negative breast cancer is the most aggressive molecular subtype of breast cancer1. In
54
contrast with mammary cancers of other subtypes (hormone receptor-positive HR+/HER2-, 55
and HER2+), TNBCs do not express hormone receptors nor the HER2 oncogene and thus are 56
not candidates for hormone and anti-HER2 therapy1. Chemotherapy is the only systemic
57
therapy currently approved for this subtype. However, TNBC is highly invasive with strong 58
metastatic propensity1. We recently identified PRICKLE1 as a poor-prognosis marker in 59
breast cancer2. PRICKLE1 is a member of a conserved group of proteins involved in planar 60
cell polarity (PCP) pathway3. This pathway is well characterized in epithelial tissue 61
morphogenesis during embryonic development of invertebrates and vertebrates. The 62
organization of PCP relies on the spatial distribution of proteins at the plasma membrane such 63
as Wnts, Frizzled, Vang Gogh, Flamingo, Dishevelled, Diego, and Prickle. In vertebrates, 64
homologous genes are involved in the regulation of convergent-extension during the early 65
stages of gastrulation which leads to the organization of cells to generate the head-to-tail axis3, 66
4. Prickle1 plays a pivotal role to regulate PCP in Drosophila5, as well as
convergent-67
extension in Zebrafish6 and Xenopus7. PRICKLE1 is an evolutionary conserved cytoplasmic 68
protein. It contains a PET domain at the N-terminus followed by three LIM domains and a C-69
terminal farnesylation site8. Recently, we and others have demonstrated the prominent role of 70
PRICKLE1 during cancer progression2, 9-11. PRICKLE1 is a prometastatic protein and 71
regulates oriented cell migration in various cell lines including the MDA-MB-231 prototype 72
TNBC cell line2, 10. At the molecular level, PRICKLE1 regulates the subcellular localization
73
of associated proteins such as VANGL28, 12, RICTOR2, ARHGAP22/2410, and LL5β11 to
74
coordinate oriented cellular migration. 75
4 Here, we identify the proteome associated to PRICKLE1 in MDA-MB-231 cells. Among the 76
proteins associated to PRICKLE1, our attention was drawn to a large subset of small G-77
protein regulators. We first show that PRICKLE1 and its associated proteins are 78
overexpressed in TNBC, and that their up-regulation is associated with poor prognosis in this 79
molecular subtype. To further explore the protein complex associated to PRICKLE1, we 80
focused our attention on the Rho-guanylyl exchange factor (GEF) called epithelial cell 81
transforming sequence 2 (ECT2). In non-transformed cells, ECT2 regulates cytokinesis by 82
regulating Rac1 activity13-16. ECT2 is frequently up-regulated in various cancers such as 83
ovarian14, lung17, and breast cancers18. ECT2 promotes Rac1 activity and increases cell 84
growth, invasion and tumorigenicity13, 16. Here, we show that PRICKLE1 is associated to 85
ECT2 to regulate Rac1 activity and that Prickle1 and Ect2 act synergistically during 86
embryonic development. Altogether, these data demonstrate the importance of Prickle1 and 87
its associated protein complex as poor-prognosis markers in TNBC and provide evidence that 88
PRICKLE1 may be a suitable therapeutic target for treatment of this aggressive subtype of 89
breast cancer. 90
91
Materials and Methods 92
93
Rac1 activity assay 94
Cells were lysed with ice cold lysis buffer (50 mM Tris, pH7.6, 150mM NaCl, 0.1% Triton X-95
100, 20mM MgCl2 supplemented with protease inhibitor (Sigma)). The supernatant was
96
collected after 10 min of centrifugation at 10,000xg at 4°C. Protein concentration was 97
measured from the solubilized fraction and adjusted to 2mg/mL. 10% of the lysates are 98
conserved as loading controls. 100µg of GST-CRIB were added to 2mg of lysate and 99
incubated with rotation during 30 min at 4°C. Beads were washed with 10 volumes of lysis 100
5 buffer. Rac-GTP forms were eluted from the beads using 2x Laemmli buffer. 30% of the 101
sample were ran on 15%SDS-PAGE gel and transferred to PVDF, then blotted with the 102
indicated antibody. 103
104
Breast cancer samples and gene expression profiling 105
Our institutional series included 353 tumor samples from pre-treatment invasive primary 106
mammary carcinomas either surgically removed or biopsied.19 The study was approved by our 107
institutional review board. Each patient had provided written informed consent. Samples were 108
profiled using Affymetrix U133 Plus 2.0 human microarrays (Santa Clara, CA, USA). The 109
resulting data were pooled with 35 public breast cancer data sets comprising both gene 110
expression profiles generated using DNA microarrays and RNA-Seq and clinicopathological 111
annotations. These sets were collected from the National Center for Biotechnology 112
Information (NCBI)/Genbank GEO, ArrayExpress, European Genome-Phenome Archive, 113
The Cancer Genome Atlas portal (TCGA) databases, and authors’ website (Supplementary 114
Table 1). The final pooled data set included 8,982 redundant metastatic, non-115
inflammatory, primary, invasive breast cancers. 116
117
Gene expression data analysis 118
Before analysis, several steps of data processing were applied. The first step was the 119
normalization of each set separately. It was done in R using Bioconductor and associated 120
packages; we used quantile normalization for the available processed data from non-121
Affymetrix-based sets (Agilent, SweGene, and Illumina), and Robust Multichip Average 122
(RMA) with the non-parametric quantile algorithm for the raw data from the Affymetrix-123
based sets. In the second step, we mapped the hybridization probes across the different 124
technological platforms represented as previously reported.20 When multiple probes mapped 125
6 to the same GeneID, we retained the most variant probe in a particular dataset. We log2-126
transformed the available TCGA RNA-Seq data that were already normalized. In order to 127
avoid biases related to trans-institutional IHC analyses and thanks to the bimodal distribution 128
of respective mRNA expression levels, the ER, progesterone receptor (PR), and HER2 129
statutes (negative/positive) were defined on transcriptional data of ESR1, PGR, and HER2 130
respectively, as previously described.21 The molecular subtypes of tumors were defined as
131
HR+/HER2- for ER-positive and/or PR-positive and HER2-negative tumors, HER2+ for 132
positive tumors, and triple-negative (TN) for ER-negative, PR-negative and HER2-133
negative tumors. Next, expression levels of PRICKLE1 and 10 genes of interest from the 134
protein complex associated to Prickle1 (namely, ARHGAP21, ARGHAP22, ARHGAP23, 135
ARHGEF2, ARHGEF40, BCR, ECT2, IQGAP3, MYO9B, and STARD13) were extracted from 136
each of the 36 normalized data sets. Before analysis, gene expression levels were standardized 137
within each data set using the PAM50 luminal A population as reference. This allowed to 138
exclude biases due to laboratory-specific variations and to population heterogeneity and to 139
make data comparable across all sets. PRICKLE1 and ECT2 upregulation in a tumor was 140
defined by an expression level above median expression, the other cases being defined as 141
downregulation. GEF/GAP activity was based on metagene approach and computed on the 142
mean of the 10 related genes standardized. GEF/GAP activity “up” was defined by a 143
metagene score value above the global median of the metagene, while a value below the 144
global median was defined as “down”. 145
146
Statistical analysis 147
Correlations between tumor classes and clinicopathological variables were analyzed using the 148
one-way analysis of variance (ANOVA) or the Fisher’s exact test when appropriate. 149
Metastasis-free survival (MFS) was calculated from the date of diagnosis until the date of 150
7 distant relapse. Follow-up was measured from the date of diagnosis to the date of last news 151
for event-free patients. Survivals were calculated using the Kaplan-Meier method and curves 152
were compared with the log-rank test. The likelihood ratio (LR) tests were used to assess the 153
prognostic information provided beyond that of PRICKLE1 model, GEF/GAP metagene or 154
ECT2 model, assuming a X2 distribution. Changes in the LR values (LR-ΔX2) measured
155
quantitatively the relative amount of information of one model compared with another. All 156
statistical tests were two-sided at the 5% level of significance. Statistical analysis was done 157
using the survival package (version 2.30) in the R software (version 2.15.2; 158
http://www.cran.r-project.org/). We followed the reporting REcommendations for tumor 159
MARKer prognostic studies (REMARK criteria)22. 160
161
Xenopus embryo injections, plasmids, RNAs, and Mos 162
Eggs obtained from NASCO females were fertilized in vitro, dejellied and cultured as 163
described previously23. Wild-type embryos were obtained using standard methods24 from
164
adult animals and staged according to Nieuwkoop and Faber (1994) 25. Ect2 riboprobe was
165
generated from Xenopus laevis full-length Ect2 cDNA, obtained from DharmacomTM
166
(Plasmid XGC ect2 cDNA, Clone ID: 5083828; pCMV-SPORT6.ccdb). The cDNA was 167
subcloned in pBS-SK vector. For the Ect2 sense probe, the plasmid was linearized by NotI 168
and transcribed with T7 RNA polymerase. For the Ect2 antisense probe, the plasmid was 169
linearized by EcoRV and transcribed with T3 RNA polymerase. Synthetic capped mRFP 170
mRNA was produced using Ambion mMESSAGE mMACHINE Kit. pCS2-mRFP was 171
linearized with NotI and mRNA was synthesized with Sp6 polymerase. 0,5ng of mRFP 172
capped mRNA was used as injection control and tracer. 173
Morpholino antisense oligonucleotides (MO) were obtained from Genetools with the 174
following: Prickle1 (Pk1) 5’-CCTTCTGATCCATTTCCAAAGGCAT-3’ 26; ECT2 5’-175
8 TACTGGGAGAGCCATGTTTGATTT-3’. Embryos at the 2-cell stage were injected in each 176
blastomere with various doses of MOs. Embryos were cultured in modified Barth’s solution 177
until stage 28, when they were photographed. 178
179
Extended material methods including chapter about: -Plasmid constructs and reagents, tissue 180
culture and transfection, -Immunopurification, -Affinity purification, -immunoprecipitation 181
and western blot, -Mass spectrometry analysis. -Protein identification, -In situ hybridization 182
(ISH) are available in supplementary material and methods. 183
184
Results 185
Mass spectrometry analysis of the PRICKLE1 complex shows that PRICKLE1 is 186
associated with small G-protein regulators 187
We and others have shown that PRICKLE1 contribute to cancer cell dissemination in various 188
cancers2, 9-11. To investigate the molecular mechanisms underlying the role of PRICKLE1 in 189
tumorigenicity, and notably cell motility and dissemination, we generated a stable cell line 190
expressing GFP-PRICKLE1 in the highly invasive MDA-MB-231 TNBC cell line. To 191
identify protein complexes associated to PRICKLE1 in these cells, we performed anti-GFP 192
immunoprecipitation followed by mass spectrometry analysis. We identified previously 193
known PRICKLE1 interactors such as VANGL1, MINK1, RICTOR, LL5β, PLK1, and 194
USP9x, validating our approach (Fig. 1A). Cell migration is a complex and dynamic process 195
that involves continuous remodeling of the cellular architecture and relies on spatiotemporal 196
modulation of signaling networks including Rho-family GTPases. Our attention was drawn to 197
the large number of regulators of Rho-family GTPases such as Rac1, Rho and Cdc42 (Fig. 198
1B), known to be involved in the regulation of cell motility, and considered as interesting 199
drug targets to prevent cancer dissemination. 200
9 201
Prognostic value of PRICKLE1-interacting small G-protein regulators in TNBC 202
Based on these proteomic data describing the protein complex associated to PRICKLE1, we 203
focused our attention on the 10 regulators of small G-proteins (i.e. Rho-GEF and Rho-GAP) 204
that were identified, including ARHGAP21, ARGHAP22, ARHGAP23, ARHGEF2, 205
ARHGEF40, BCR, ECT2, IQGAP3, MYO9B, and STARD13. We assessed the mRNA 206
expression level of the corresponding genes in a retrospective series of 8,982 clinically 207
annotated patients with invasive primary breast cancer collected from several public data 208
bases (Table S1). Within these 10 genes, ECT2, IQGAP3 and MYO9B were the most 209
overexpressed in tumors compared to normal breast tissues (Fig. 2A), whereas ARHGEF40 210
and STARD13 showed the lowest expression levels. We built a metagene including these 10 211
genes (GEF/GAP metagene) and compared its expression level in three molecular subtypes of 212
breast cancer (HR+/HER2-, HER2+, and TN). The metagene was significantly up-regulated 213
in the TN subtype compared to the two others subtypes (p<1.0 x 10-250, ANOVA) (Fig. 2B). 214
We then searched for correlations between the GEF/GAP metagene expression (as a binary 215
variable) and the clinicopathological features of samples, including metastasis-free survival 216
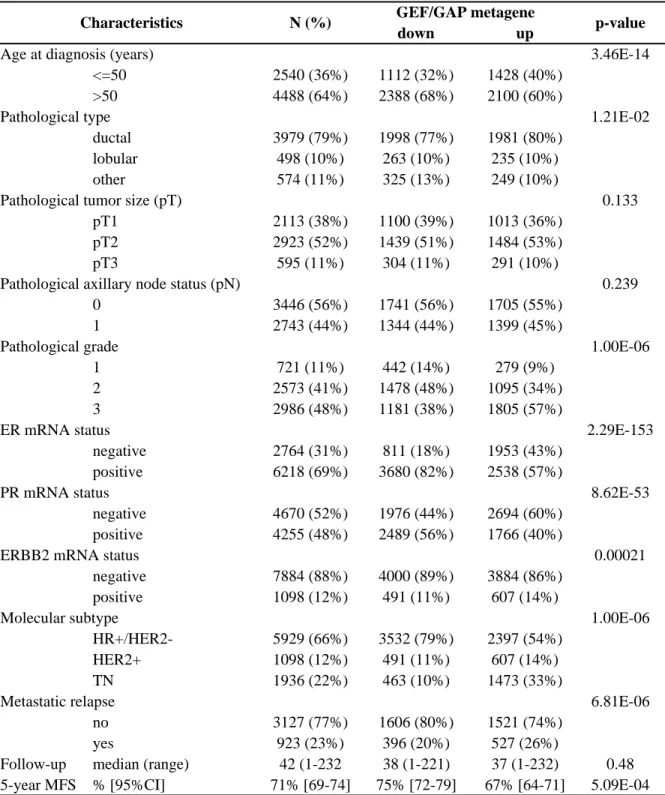
(MFS). Within the 8,982 breast cancer samples analyzed, 4,491 tumors (50%) showed 217
metagene upregulation when compared with normal breast (ratio T/NB ≥ 2; ‘‘metagene-up’’ 218
group), and 4.491 (50%) showed metagene downregulation (ratio <2; ‘‘metagene-down’’ 219
group) (Table 1). We found significant correlations between the metagene status and patients’ 220
age (p<0.001), grade (p<0.001), ER (p<0.001), PR (p<0.001), and HER2 (p=0.012) statutes 221
and with molecular subtypes of breast cancer. MFS data were available for 2,030 patients: the 222
5-year MFS was 75% (95 Cl, 72-79) in the “metagene-down” group versus 67% (95Cl, 63-223
71) in the “metagene-up” group (p=0.00023, log-rank test; Fig. 2C). In fact, this prognostic 224
correlation was only observed in TNBC patients, and not in the non-TNBC ones (p=0.461, 225
10 log rank test; Fig. 2D). In TNBC patients, the 5-year MFS was 77% (95 Cl, 66-90) in the 226
“metagene-down” group versus 60% (95Cl, 54-66) in the “metagene-up” group (p=0.029, 227
log-rank test; Fig. 2E). 228
229
Cooperation between PRICKLE1 and ECT2 as poor-prognosis markers in TNBC 230
We have previously shown that PRICKLE1 upregulation is associated with poor MFS in basal 231
breast cancer2, a molecular subtype mainly composed of TNBC. In the present series of
232
TNBC, we confirmed that PRICKLE1 upregulation was associated with shorter MFS, with 233
70% 5-year MFS (95Cl, 61-79) versus 55% (95Cl, 48-63) in the PRICKLE1-down group and 234
the PRICKLE1-up group, respectively (p=0.0147, log-rank test) (Fig. 2F). Since PRICKLE1 235
and the 10 genes of the metagene interact together, we tested whether their interaction had 236
any prognostic value. First, we analyzed the combination of the metagene expression and 237
PRICKLE1 expression. Interestingly, patients with upregulation of both markers displayed 238
shorter 5-year MFS (53%, 95Cl, 46-62) than patients without upregulation of both markers 239
(72%, 95Cl 60-88; p=0.017, log-rank test), whereas patients with intermediate status 240
(upregulation and downregulation, and vice-versa) showed intermediate 5-year MFS not 241
significantly different from the same patients (p=0.757, and p=0.495 respectively, log-rank 242
test; Fig. 2G). This data suggest that metagene expression and PRICKLE1 expression might 243
provide complementary prognostic value. This complementarity between the two prognostic 244
variables was tested in TNBC patients using the likelihood ratio (LR) test. As shown in Table 245
2A, the metagene added prognostic information to that provided by PRICKLE1 expression 246
(LR-ΔX2=2.75, p=0.097). 247
Second, because ECT2 was one of the most prominent hit identified by mass spectrometry 248
analysis (Fig. 1B) and the gene most overexpressed in TNBCs among members of the 249
metagene (Fig. 2A), we investigated whether ECT2 expression alone (without the nine other 250
11 genes of the metagene) would be sufficient to improve the prognostic value of PRICKLE1 251
expression in TNBC patients. As shown in Figure 2H, patients with ECT2 upregulation 252
displayed shorter 5-year MFS (56%, 95Cl 50-64) than patients without upregulation (70%, 253
95Cl 60-81; p=0.0243, log-rank test). More interestingly, ECT2 expression status increased 254
the prognostic value of PRICKLE1 expression when combined. Patients with upregulation of 255
both genes displayed 50% 5-year MFS (95Cl, 46-62) versus 67% for patients with 256
intermediate status (up and down, and vice-versa) versus 76% (95Cl, 64-90) for patients 257
without upregulation of both markers (p=0.0134, log-rank test; Fig. 2I). The model 258
comparison (Table 2B) showed that such ECT2 prognostic information added to that of 259
PRICKLE1 expression was statistically significant (LR-ΔX2=4.74, p=0.029), indicating that 260
ECT2 expression improved the prognostic value of PRICKLE1 expression in TNBC. 261
262
PRICKLE1 binds to ECT2 through its PET domain and modulates Rac1 activity 263
We then investigated the molecular mechanisms potentially associated to this cooperation of 264
PRICKLE1 and ECT2 expressions to confer poor prognosis. ECT2 is a Rho-GEF and acts by 265
exchanging GDP to GTP on the small GTPases, RhoA, Rac1 and Cdc4227. To confirm our
266
mass spectrometry analysis, we immunoprecipitated GFP-PRICKLE1 stably expressed in 267
MDA-MB-231 cells using GFP-targeted antibody and assessed the presence of ECT2 268
associated to PRICKLE1 by western blot analysis complex (Fig. 3A). We confirmed that 269
ECT2 is associated with PRICKLE1 in MDA-MB-231 cells. We further showed that ECT2 270
colocalizes in actin-enriched structures of lamellipodia along with PRICKLE1 using MDA-271
MB-231 stably expressing GFP-PRICKLE1 (Fig. 3B). We next mapped the domain of 272
interaction between PRICKLE1 and ECT2. We thus generated deleted versions of PRICKLE1 273
that lack the PET and/or the LIM domains and a construct encompassing the PRICKLE1 C-274
terminal region. We co-transfected HEK293T cells with the indicated FLAG tagged 275
12 PRICKLE1 mutants with mCherry-ECT2. After FLAG immunoprecipitation, we assessed the 276
presence of mCherry-ECT2 by western blot analysis. We observed that the PET domain of 277
PRICKLE1 was required for the formation of the PRICKLE1-ECT2 protein complex (Fig. 278
3C). 279
We further assessed PRICKLE1 contribution to Rac activity. We used previously 280
characterized siRNAs2 to specifically downregulate PRICKLE1 expression in MDA-MB-231
281
cells. We observed that PRICKLE1 modulated Rac1 activity, suggesting a prominent role of 282
PRICKLE1 in the regulation of Rho-GEF and Rho-GAP (Fig. 3D). We next set up an assay to 283
monitor the role of PRICKLE1 on ECT2 Rho GEF activity. We expressed mCherry-ECT2 in 284
HEK293T cells and observed an increase of active Rac1 (lane 2). However, when FLAG-285
PRICKLE1 was co-expressed with mCherry-ECT2, we observed an inhibitory effect of 286
PRICKLE1 (lane 3). This observation was confirmed by the co-expression of a PRICKLE1 287
mutant lacking the PET and LIM1 domains which was unable to bind ECT2 and did not affect 288
the gain of activity of ECT2 in our system (Fig. 3E, lane 4). Altogether, our data suggest that 289
PRICKLE1 is associated with ECT2 in actin-rich structures within the lamellipodia of the 290
cells in order to modulate the activity of ECT2 on Rac1. 291
292
Prickle1 and Ect2 functionally interact in Xenopus during embryonic development 293
PRICKLE1 is an evolutionarily conserved protein and plays a pivotal role during gastrulation 294
to modulate convergent-extension movements (CE), which are crucial to shape the body plan7, 295
29. To test whether Ect2 is required for the previously characterized function of Prickle1
296
during CE, we first compared and analyzed the RNA-seq profile of prickle1 and ect2 reported 297
on the public XenBase repository30 (data not shown). We noticed a sharp peak of zygotic ect2
298
expression at stage 9, which decreases abruptly at stage 10, just before gastrulation and CE 299
movements take place. Zygotic prickle1 expression also begins to increase at stage 9, reaching 300
13 a maximum at stage 12 (mid gastrula), and gradually decreasing until the end of neurulation. 301
We next performed in situ hybridization and detected expression of ect2 RNA in the animal 302
hemisphere up until stage 9 (Fig. 4A). Thus, ect2 transcription appears to terminate when 303
prickle1 transcription starts. However, inspection of genome-wide proteomic data31 indicated 304
that Ect2 protein levels were maintained during gastrulation, suggesting that Ect2 could 305
cooperate with Prickle1 to regulate morphogenetic movements. To test this hypothesis, we 306
performed Prickle1 and Ect2 knockdown through antisense morpholinos (MO) injections, and 307
assessed CE problems (Fig. 4B). Injection of 40ng Prickle1 MOs led to CE defects in 73% of 308
embryos, in comparison to non-injected embryos (98%) or embryos injected with RFP as 309
control (83%). This data is consistent with previously published results7, 12. We then injected 310
20ng of MO targeting Ect2 and we observed CE problems at a rate of 71%, phenocopying the 311
effect observed with Prickle1 MOs with narrower and shorter embryos at tailbud stage 28. We 312
then defined subthreshold doses of individual Mo-Prickle1 (</=10ng) and Mo-Ect2 (</=10ng) 313
that yielded moderate CE defects in this assay when injected separately into two blastomeres 314
at 2-cell stage (18% and 12% CE defects, respectively). In contrast, co-injecting both MOs at 315
subthreshold doses caused strong disruption of CE movements (67%), suggesting that 316
Prickle1 and Ect2 functionally interact during Xenopus embryonic development. 317
318
Discussion 319
We and others have previously demonstrated the prominent role of PRICKLE1 during cancer 320
progression2, 9-11. In this study, we identified the protein complex associated to PRICKLE1 321
and we evaluated the impact of PRICKLE1 and its associated protein complex in TNBC. Our 322
results show that PRICKLE1 acts as a scaffold protein due to the large number of associated 323
proteins with enzymatic activity. Among the PRICKLE1-associated proteins, we focused our 324
attention on small G-protein regulators since their impact on cell motility and cancer cell 325
14 dissemination has been well characterized32-34. Exploiting our transcriptomic breast cancer 326
database, we showed that this subset of genes is up-regulated in TNBC. Among this group of 327
genes, we identified ECT2 as the most prominent contributor to PRICKLE1 prognostic value. 328
Indeed, TNBC patient with up-regulated expression of both PRICKLE1 and ECT2 expression 329
had a shorter MFS than other patients. We further characterized the PRICKLE1 and ECT2 330
interaction and showed that PRICKLE1 controls ECT2 function on Rac1 activation. We 331
finally defined that Prickle1 and Ect2 interaction was evolutionary conserved, since both 332
proteins contribute to Xenopus embryonic development and are involved in convergent-333
extension movements. 334
Among breast cancers, TNBC are considered the most aggressive form and no targeted 335
therapy is currently available due to a lack of specific targets1. Here, we show that PRICKLE1 336
is overexpressed in TNBC and is a poor-prognosis marker. PRICKLE1 is a protein highly 337
regulated by post-translational modifications, particularly through 338
ubiquitination/deubiquitination. PRICKLE1 is indeed the target of SMURF1, an ubiquitin 339
ligase, which allows its rapid degradation35, but is also protected from degradation by USP9x 340
which de-ubiquitinates the protein36. Interestingly USP9x is also up-regulated in several 341
cancers and is considered as a poor-prognosis marker37. PRICKLE1 is also regulated through 342
phosphorylation by the serine/threonine kinase called MINK1, which promotes its function, 343
its membrane localization and association with signaling molecules12. Together, this shows 344
that PRICKLE1 is a pivotal protein in cancer cell dissemination and a candidate target for 345
setting up novel therapeutic strategies. 346
During developmental processes and cancer progression, PRICKLE1 is required for oriented 347
cell migration2, 9, 11, 38. At the molecular level, we and others have shown that PRICKLE1
348
functions to localize VANGL at the plasma membrane8, 12, LL5β at the +ends of the
349
microtubules11, and to restrict localization of Rho-GAP at the edge of the migrating cancer
15 cells10. PRICKLE1 also regulates spatial localization of several active proteins such as 351
mTORC2 to allow local activation of Akt at the leading edge of migrating cells2, PHLDB2 to 352
disassemble focal adhesions11 and to restrict RhoA activity by regulating subcellular 353
localization of Rho-GAP10. Together the contribution of PRICKLE1 to localization of its
354
interacting partners allows the cells to coordinate cellular movements and promote directed 355
cell migration. Here we show that PRICKLE1 also contributes to regulating the activity of 356
ECT2, a GEF for Rac1, which is essential for cell motility. 357
ECT2 is a Rho-GEF controlling Rac1 activity13. Although ECT2 has been extensively studied 358
for its role in the nucleus and during cytokinesis, reports have shown that ECT2 can also be 359
localized in the cytoplasm of cancerous cells16. We observed that ECT2 is localized in actin-360
rich structures within the lamellipodia. As described for other PRICKLE1 interactors, 361
PRICKLE1 might contribute to ECT2 spatial localization in order to modulate its Rac 362
activity. Moreover, our data show that overexpression of ECT2 in HEK293T cells contributes 363
to an increase of Rac activity, and that PRICKLE1 overexpression leads to a decrease of this 364
gain of function, suggesting an inhibitory role of PRICKLE1 on ECT2 activity. Altogether, 365
this depicts PRICKLE1 as a master regulator of localized expression and regulation of 366
signaling events in migratory cancer cells. 367
Our data also identified a role for the PET domain of PRICKLE1, as ECT2 is to date the only 368
protein identified to be associated with this domain. At the molecular level, it has been shown 369
that PRICKLE1 exists in an open and closed conformation39. It has been suggested that in the 370
closed conformation, the three LIM domains of PRICKLE1 mask the PRICKLE1 PET 371
domain. In an open conformation, the PET domain is unmasked, thus activating PRICKLE1. 372
We can speculate that the interaction between PRICKLE1 and ECT2 can be modulated by 373
switching between these two conformations as a molecular mechanism for PRICKLE1 374
activation. 375
16 Finally, our study identified that ECT2 is required for Xenopus embryonic development. 376
Prickle1 has been extensively characterized for its contribution during convergent-extension6, 377
7 movements and has been shown to be asymmetrically distributed within the cells in order to
378
organize their movement40, 41. A previous study indicated that Prickle1 mRNA accumulates
379
within the blastopore lip from the onset of gastrulation42. Here, we show that ect2 mRNA and
380
presumably Ect2 protein are expressed prior to and in a broader pattern than Prickle142.
381
Knockdown experiments strongly suggest that Prickle1 and Ect2 act together to allow 382
convergence-extension movements during gastrulation. Altogether, our data support the view 383
that Ect2 might represent a permissive factor for Prickle1 activity. This study demonstrates 384
the importance of the evolutionarily conserved interaction between Prickle1 and Ect2, which 385
appears to be reactivated during tumorigenesis to promote cancer cell dissemination and 386 metastasis. 387 388 List of abbreviations 389
TNBC: Triple-negative breast cancers; PCP: planar cell polarity; GEF: Guanylyl Exchange 390
Factor ; ECT2: Epithelial cell transforming sequence 2; GEF: Guanylyl Exchange Factor; TN: 391
triple-negative; MO: Morpholino antisense oligonucleotides; MFS: metastasis free survival; 392
CE: convergent-extension movements. 393
394
Additional Information 395
Ethics approval and consent to participate
396
Not applicable 397
Consent for publication
398
Not applicable 399
Availability of data and materials
17 The mass spectrometry proteomics data, including search results, will be deposited to the 401
ProteomeXchange Consortium (www.proteomexchange.org)43 via the PRIDE partner 402
repository with the dataset identifier PXD011253. 403
Conflict of Interest
404
The authors declare no potential conflicts of interest. 405
Funding
406
This work was funded by La Ligue Nationale Contre le Cancer (Labels Ligue JPB and DB, 407
and fellowship to AMD), Fondation de France (fellowship to AMD), Fondation ARC pour la 408
Recherche sur le Cancer (grant to JPB), INCA PLBIO INCa 9474 (fellowship to DR) and 409
SIRIC (INCa-DGOS-Inserm 6038, fellowship to AMD). M.S.W. was a recipient of the 410
Science without Borders PhD program from Brazil Coordenação de Aperfeiçoamento de 411
Pessoal de Nível Superior (CAPES). The Marseille Proteomics (IBiSA) is supported by 412
Institut Paoli-Calmettes (IPC) and Canceropôle PACA. Samples of human origin and 413
associated data were obtained from the IPC/CRCM Tumor Bank that operates under 414
authorization # AC-2013-1905 granted by the French Ministry of Research. Prior to scientific 415
use of samples and data, patients were appropriately informed and asked to express their 416
consent in writing, in compliance with French and European regulations. The project was 417
approved by the IPC Institutional Review Board. Jean-Paul Borg is a scholar of Institut 418
Universitaire de France. 419
Authors' contributions 420
AMD, JPB and FB designed the study and wrote the manuscript. AMD conducted the 421
research and performed biochemistry experiments. MSW, LC and SA performed the protein 422
complex purification and mass spectrometry analysis. PF and FB analyzed transcriptomic data 423
base. DR and LK contribute to the Xenopus experiments. DB contributed with key insights. 424
Acknowledgements 425
18 The authors wish to thank Valérie Ferrier for critical review of the manuscript and Emilie 426
Baudelet for technical assistance to process protein samples for mass spectrometry analysis. 427
428
Supplementary informations are available at the British Journal of Cancer’s website 429
430
References 431
1. Tong CWS, Wu M, Cho WCS, To KKW. Recent Advances in the Treatment of Breast 432
Cancer. Front Oncol 2018;8: 227. 433
2. Daulat AM, Bertucci F, Audebert S, et al. PRICKLE1 Contributes to Cancer Cell 434
Dissemination through Its Interaction with mTORC2. Dev Cell 2016;37(4): 311-25. 435
3. Butler MT, Wallingford JB. Planar cell polarity in development and disease. Nat Rev Mol 436
Cell Biol 2017;18(6): 375-88. 437
4. Sokol SY. Spatial and temporal aspects of Wnt signaling and planar cell polarity during 438
vertebrate embryonic development. Semin Cell Dev Biol 2015;42: 78-85. 439
5. Gubb D, Garcia-Bellido A. A genetic analysis of the determination of cuticular polarity 440
during development in Drosophila melanogaster. J Embryol Exp Morphol 1982;68: 37-57. 441
6. Veeman MT, Slusarski DC, Kaykas A, Louie SH, Moon RT. Zebrafish prickle, a modulator 442
of noncanonical Wnt/Fz signaling, regulates gastrulation movements. Curr Biol 2003;13(8): 443
680-5. 444
7. Takeuchi M, Nakabayashi J, Sakaguchi T, et al. The prickle-related gene in vertebrates is 445
essential for gastrulation cell movements. Curr Biol 2003;13(8): 674-9. 446
8. Jenny A, Darken RS, Wilson PA, Mlodzik M. Prickle and Strabismus form a functional 447
complex to generate a correct axis during planar cell polarity signaling. EMBO J 2003;22(17): 448
4409-20. 449
19 9. Luga V, Zhang L, Viloria-Petit AM, et al. Exosomes mediate stromal mobilization of 450
autocrine Wnt-PCP signaling in breast cancer cell migration. Cell 2012;151(7): 1542-56. 451
10. Zhang L, Luga V, Armitage SK, et al. A lateral signalling pathway coordinates shape 452
volatility during cell migration. Nat Commun 2016;7: 11714. 453
11. Lim BC, Matsumoto S, Yamamoto H, et al. Prickle1 promotes focal adhesion disassembly 454
in cooperation with the CLASP-LL5beta complex in migrating cells. J Cell Sci 2016;129(16): 455
3115-29. 456
12. Daulat AM, Luu O, Sing A, et al. Mink1 regulates beta-catenin-independent Wnt 457
signaling via Prickle phosphorylation. Mol Cell Biol 2012;32(1): 173-85. 458
13. Justilien V, Fields AP. Ect2 links the PKCiota-Par6alpha complex to Rac1 activation and 459
cellular transformation. Oncogene 2009;28(41): 3597-607. 460
14. Huff LP, Decristo MJ, Trembath D, et al. The Role of Ect2 Nuclear RhoGEF Activity in 461
Ovarian Cancer Cell Transformation. Genes Cancer 2013;4(11-12): 460-75. 462
15. Justilien V, Ali SA, Jamieson L, et al. Ect2-Dependent rRNA Synthesis Is Required for 463
KRAS-TRP53-Driven Lung Adenocarcinoma. Cancer Cell 2017;31(2): 256-69. 464
16. Justilien V, Jameison L, Der CJ, Rossman KL, Fields AP. Oncogenic activity of Ect2 is 465
regulated through protein kinase C iota-mediated phosphorylation. J Biol Chem 466
2011;286(10): 8149-57. 467
17. Zhou S, Wang P, Su X, et al. High ECT2 expression is an independent prognostic factor 468
for poor overall survival and recurrence-free survival in non-small cell lung adenocarcinoma. 469
PLoS One 2017;12(10): e0187356. 470
18. Wang HK, Liang JF, Zheng HX, Xiao H. Expression and prognostic significance of ECT2 471
in invasive breast cancer. J Clin Pathol 2018;71(5): 442-45. 472
19. Sabatier R, Finetti P, Adelaide J, et al. Down-regulation of ECRG4, a candidate tumor 473
suppressor gene, in human breast cancer. PLoS ONE 2011;6(11): e27656. 474
20 20. Bertucci F, Finetti P, Viens P, Birnbaum D. EndoPredict predicts for the response to 475
neoadjuvant chemotherapy in ER-positive, HER2-negative breast cancer. Cancer Lett 476
2014;355(1): 70-5. 477
21. Lehmann BD, Bauer JA, Chen X, et al. Identification of human triple-negative breast 478
cancer subtypes and preclinical models for selection of targeted therapies. J Clin Invest 479
2011;121(7): 2750-67. 480
22. McShane LM, Altman DG, Sauerbrei W, et al. REporting recommendations for tumour 481
MARKer prognostic studies (REMARK). Br J Cancer 2005;93(4): 387-91. 482
23. Marchal L, Luxardi G, Thome V, Kodjabachian L. BMP inhibition initiates neural 483
induction via FGF signaling and Zic genes. Proc Natl Acad Sci U S A 2009;106(41): 17437-484
42. 485
24. Franco PG, Paganelli AR, Lopez SL, Carrasco AE. Functional association of retinoic acid 486
and hedgehog signaling in Xenopus primary neurogenesis. Development 1999;126(19): 4257-487
65. 488
25. Nieuwkoop PD, Faber J. Normal table of Xenopus laevis (Daudin) : a systematical and 489
chronological survey of the development from the fertilized egg till the end of 490
metamorphosis. New York: Garland Pub., 1994. 491
26. Dingwell KS, Smith JC. Tes regulates neural crest migration and axial elongation in 492
Xenopus. Dev Biol 2006;293(1): 252-67. 493
27. Basant A, Glotzer M. Spatiotemporal Regulation of RhoA during Cytokinesis. Curr Biol 494
2018;28(9): R570-R80. 495
28. Jin Y, Yu Y, Shao Q, et al. Up-regulation of ECT2 is associated with poor prognosis in 496
gastric cancer patients. Int J Clin Exp Pathol 2014;7(12): 8724-31. 497
29. Wallingford JB, Fraser SE, Harland RM. Convergent extension: the molecular control of 498
polarized cell movement during embryonic development. Dev Cell 2002;2(6): 695-706. 499
21 30. Session AM, Uno Y, Kwon T, et al. Genome evolution in the allotetraploid frog Xenopus 500
laevis. Nature 2016;538(7625): 336-43. 501
31. Peshkin L, Wuhr M, Pearl E, et al. On the Relationship of Protein and mRNA Dynamics 502
in Vertebrate Embryonic Development. Dev Cell 2015;35(3): 383-94. 503
32. Abreu-Blanco MT, Verboon JM, Parkhurst SM. Coordination of Rho family GTPase 504
activities to orchestrate cytoskeleton responses during cell wound repair. Curr Biol 505
2014;24(2): 144-55. 506
33. Machacek M, Hodgson L, Welch C, et al. Coordination of Rho GTPase activities during 507
cell protrusion. Nature 2009;461(7260): 99-103. 508
34. Cook DR, Rossman KL, Der CJ. Rho guanine nucleotide exchange factors: regulators of 509
Rho GTPase activity in development and disease. Oncogene 2014;33(31): 4021-35. 510
35. Narimatsu M, Bose R, Pye M, et al. Regulation of planar cell polarity by Smurf ubiquitin 511
ligases. Cell 2009;137(2): 295-307. 512
36. Paemka L, Mahajan VB, Ehaideb SN, et al. Seizures are regulated by ubiquitin-specific 513
peptidase 9 X-linked (USP9X), a de-ubiquitinase. PLoS Genet 2015;11(3): e1005022. 514
37. Murtaza M, Jolly LA, Gecz J, Wood SA. La FAM fatale: USP9X in development and 515
disease. Cell Mol Life Sci 2015;72(11): 2075-89. 516
38. Chiapparo G, Lin X, Lescroart F, et al. Mesp1 controls the speed, polarity, and 517
directionality of cardiovascular progenitor migration. J Cell Biol 2016;213(4): 463-77. 518
39. Sweede M, Ankem G, Chutvirasakul B, et al. Structural and membrane binding properties 519
of the prickle PET domain. Biochemistry 2008;47(51): 13524-36. 520
40. Ciruna B, Jenny A, Lee D, Mlodzik M, Schier AF. Planar cell polarity signalling couples 521
cell division and morphogenesis during neurulation. Nature 2006;439(7073): 220-4. 522
22 41. Yin C, Kiskowski M, Pouille PA, Farge E, Solnica-Krezel L. Cooperation of polarized 523
cell intercalations drives convergence and extension of presomitic mesoderm during zebrafish 524
gastrulation. J Cell Biol 2008;180(1): 221-32. 525
42. Wallingford JB, Goto T, Keller R, Harland RM. Cloning and expression of Xenopus 526
Prickle, an orthologue of a Drosophila planar cell polarity gene. Mech Dev 2002;116(1-2): 527
183-6. 528
43. Vizcaino JA, Deutsch EW, Wang R, et al. ProteomeXchange provides globally 529
coordinated proteomics data submission and dissemination. Nat Biotechnol. 2014;32(3): 223-530 26. 531 532 Figure legends: 533
Figure 1: Mass spectrometry analysis of the PRICKLE1 protein complex from a TNBC 534
cell line. 535
A) Schematic representation of the proteins associated to PRICKLE1 identified by mass 536
spectrometry analysis from MDA-MB-231 cell extracts. Proteins have been classified 537
following their function in several groups: Small G-proteins regulators, cytoskeleton-538
associated, Kinases, Membrane proteins, proteins involved in Ubiquitination, Scaffold 539
proteins and others. B) Volcano plot showing the significance two-sample t-test (-Log p-540
value) versus fold-change (Log2 (GFP-PRICKLE1 versus GFP as control)) on the y and x 541
axes, respectively. The full line is indicative of protein hits obtained at a permutation false 542
discovery rate of 1% (pFDR). Data results from two different experiments processed three 543
times. PRICKLE1 (the bait) is represented in red and ECT2, one of the most abundant 544
PRICKLE1-associated partners, is represented in green. 545
23 Figure 2: Prognostic value of PRICKLE1-interacting small G-protein regulators in 547
TNBC and cooperation between PRICKLE1 and ECT2 as poor-prognosis markers. 548
A) Boxplot of GEF/GAP regulators expression across breast cancers. B) Boxplot of 549
GEF/GAP regulators expression across triple negative (TN) versus HR+/HER2- or HER2+ 550
breast cancers. C) Kaplan-Meier curves of metastasis-free survival among breast cancers 551
patients according to overexpression (Up) versus underexpression (Down) of GEF/GAP 552
metagene mRNA. D) Kaplan-Meier curves of metastasis-free survival among non-TNBC 553
patients for GEF/GAP metagene mRNA expression. E) Kaplan-Meier curves of metastasis-554
free survival among TNBC patients for GEF/GAP metagene mRNA expression. F) Kaplan-555
Meier curves of metastasis-free survival among TNBC patients for PRICKLE1 mRNA 556
expression. G) Kaplan-Meier curves of metastasis-free survival among TNBC patients for 557
PRICKLE1 mRNA and GEF/GAP metagene expression. H) Kaplan-Meier curves of 558
metastasis-free survival among TNBC patients for ECT2 mRNA expression. I) Kaplan-Meier 559
curves of metastasis-free survival among TNBC patients for PRICKLE1 and ECT2 mRNA 560
expression. 561
562
Figure 3: PRICKLE1 is associated to the Rho-GEF ECT2 and controls its activity. 563
A) Immunopurification of GFP-PRICKLE1 from MDA-MB-231 cell lysate using GFP 564
nanobodies coupled to sepharose beads allows the identification of ECT2 associated to 565
PRICKLE1. B) Immunofluorescence of MDA-MB-231 cells stably expressing GFP-566
PRICKLE1 shows that ECT2 (endogenous) is colocalized with PRICKLE1 and enriched in 567
actin structures within the lamellipodia. C) Mapping of the PRICKLE1 domain needed for 568
interaction with ECT2. HEK293T cells were co-transfected with the indicated forms of 569
PRICKLE1 (see on the left for topology details) and mCherry-ECT2. After FLAG 570
immunopurification, presence of ECT2 is detected using anti-mCherry antibody. D) 571
24 Downregulation of PRICKLE1 expression using siRNA targeting PRICKLE1 shows an 572
increase of Rac activity in MDA-MB-231 cells. E) PRICKLE1 modulates ECT2 activity. 573
Using HEK293T cells, we expressed or co-expressed ECT2 with full length or a deleted 574
version of PRICKLE1 lacking its domain of interaction with ECT2. Overexpression of ECT2 575
leads to an increase in Rac activity which was inhibited when PRICKLE1 is co-expressed. 576
Co-expression of a mutant form of PRICKLE1 did not modify the gain of function observed 577
by ECT2 overexpression. 578
579
Figure 4: Prickle1 and Ect2 functionally interact in Xenopus during embryonic 580
development 581
A) In situ hybridization against ect2 transcripts at stage 8, 9 and 10. ect2 RNA is detectable in 582
the animal pole (animal view and lateral view) but not in the vegetal pole (vegetal view) at 583
stages 8 and 9, but no longer at stage 10. Schematic representations of embryos at the stages 584
analyzed are shown on the right. B) Embryos at 2-cell stage were injected into two 585
blastomeres with Prickle1 and Ect2 MOs as indicated. In all cases 0,5ng of mRFP mRNA was 586
injected as control and tracer. Suboptimal doses (10ng) of either MO did not cause CE 587
problems. However, when both Prickle1 and Ect2 MOs were co-injected at suboptimal doses 588
(5ng each), embryos displayed CE problems at a rate comparable to high doses of each MO 589
injected separately (40ng Prickle1-MO or 20ng Ect2-MO). A total of 60 embryos per 590
condition were analyzed in two independent experiments. Pictures illustrate representative 591
phenotypes. (SR=survival rate; ND=percentage of surviving embryos developing normally; 592
CED= percentage of surviving embryos showing convergent-extension defects). Scale bars: A 593
= 0,25 mm; B = 0,5mm. 594
PRICKLE1
PHLDB2
ECT2
ASPM
ARHGAP23
IQGAP3
MYO9B
BCR
small G-Protein
regulators
SMTM
Cytoskeleton
OBSL1
SOGA1
MINK1
TTLL5
TYK2
CLASP1
STARD13
ARHGAP21
ARHGEF40
PLK1
ARHGAP22
ARHGEF2
FIGURE 1:
A
B
Kinases
AURKA
MAST2
MARK3
MARK2
CSNK2A1
CSNK2A2
CSNK1A2
CSNK2B
Membrane
Proteins
VANGL1
KIDIN220
PLD1
PLD2
Ubiquitination
USP9x
USP7
MYCB2
FBXO38
Scaffold
ERBB2IP
TANC1
TANC2
RICTOR
MAPKAP1
PRICKLE1
ECT2
log2 (GFP-PRICKLE1 vs GFP)
0 1 2 3 4 5 6 8 9 10 11 12 13 14 0 1 2 3 4 5 6 7 8 9 10 11 12 13 14 15 16 17 18 19 7 ARHGAP23 IQGAP3 MYO9B BCR STARD13 ARHGEF2 ARHGAP22 ARHGAP21 ARHGEF40 AURKB GSK3B PLK1 CSNK2B CSNK2A2 MARK3 MARK2 USP9x USP7TANC2 CLASP1 SOGA1 OBSL1 ASPM CSNK1A1 TYK2 CSNK2A1 PLD2 PLD1 TTLL5 TANC2 MAPKAP1 MAST2 MINK1 KIDIN220 AURKA SMTN FBX038 RICTORVANGL1 TANC1 ERBB2IP
PHLDB2
MYCBP2
FIGURE 2:
GEF/GAP reg. genes
HR+/HER2- HER2+ TN -0.5 0.0 0.5 1.0 GEF/GAP metagene sc or e ANOVA, p <1.0E-250 up down 0 50 100 150 0.0 0.2 0.4 0.6 0.8 1.0 PRICKLE1+GEF/GAP metagene, TN BC N = 449
Months after diagnosis Log-rank, p = 3.11E-02 0 50 100 150 0.0 0.2 0.4 0.6 0.8 1.0 PRICKLE1+ECT2, TN BC N = 449
Months after diagnosis Log-rank, p = 0.00948
A
B
0 50 100 150 0.0 0.2 0.4 0.6 0.8 1.0 GEF/GAP, All BC N = 2030Months after diagnosis
M et as ta si s -fre e su rv iv al Log-rank, p = 0.000236 down N=1040, 5-Year MFS = 75% [72-79] up N=990, 5-Year MFS = 67% [63-71]
C
0 50 100 150 0.0 0.2 0.4 0.6 0.8 1.0 GEF/GAP metagene, TN BC N = 471Months after diagnosis
-Log-rank, p = 0.0292
down N=86, 5-Year survival = 77% [66-90]
- -up N=385, 5 Year survival = 60% [54 66] 0 50 100 150 0.0 0.2 0.4 0.6 0.8 1.0
GEF/GAP metagene, nonTN BC N = 1582
Months after diagnosis Log-rank, p = 0.461
down N=861, 5-Year survival = 75% [71-79]
up N=721, 5-Year survival = 73% [69-77]
D
E
0 50 100 150 0.0 0.2 0.4 0.6 0.8 1.0 PRICKLE1, TN BC N = 449Months after diagnosis
M et as ta sis -fre e su rv iva l Log-rank, p = 0.0147 down N=147, 5-Year MFS = 70% [61-79] up N=302, 5-Year MFS = 55% [48-63]
F
G
H
0 50 100 150 ECT2, TN BC N = 449Months after diagnosis Log-rank, p = 0.0243 down N=143, 5-Year MFS = 70% [60-81] up N=306, 5-Year MFS = 56% [50-64]
I
A R H G A P 2 1 A R H G A P 2 2 A R H G A P 2 3 A R H G E F 2 A R H G E F 4 0 B C R E C T 2 IQ G A P 3 M Y O 9 B S T A R D 1 3 -2 0 2 4 Ex pre ss ion (lo g2 cM ed )PRICKLE1 GEF/GAP n 5-year MFS
p value compare to down/down Down Down 63 72% [60-88] Down Up 84 67% [57-80] 0,495 Up Down 42 61% [41-92] 0,757 Up Up 260 53% [46-62] 0,0171
PRICKLE1 ECT2 n 5-year MFS
p value compare to down/down Down Down 54 76% [64-90] Down Up 93 67% [56-80] 0,525 Up Down 89 61% [54-82] 0,585 Up Up 213 50% [42-60] 0,0134 M et as ta sis fre e su rv iva l M et as ta sis fre e su rv iva l 0.0 0.2 0.4 0.6 0.8 1.0 M et as ta sis fre e su rv iva l M et as ta sis fre e su rv iva l M et as ta sis fre e su rv iva l
150 102 76 Lysate IP: α-GFP 225 150 102 WB: α-ECT2 WB: α-GFP
FIGURE 3:
A
B
GFP-PRICKLE1 ECT2 Merge
GFP + ECT2 Phalloidin MergeGFP + Phalloidin
225 150 MW (kDa) 225 150 225 150 102 76 52 46 + + + + + + + + + + + + - - - - -- -- - -- -- - -- - -- - - -- -- - -+ - - - - -+ -Cherry-ECT2 FLAG-PRICKLE1
FLAG-PRICKLE1 ∆PET ∆LIM1 FLAG-PRICKLE1 ∆PET ∆LIM1/2 FLAG-PRICKLE1 ∆PET ∆LIM1/2/3 FLAG-PRICKLE1 Cter FLAG-RADIL FLAG-PRICKLE1 ∆PET IP: α-FLAG WB: α-Cherry Lysate WB: α-Cherry IP: α-FLAG WB: α-FLAG CIIS
PET LIM1 LIM2 LIM3
PRICKLE1
CIIS CIIS CIIS
PRICKLE1 ∆PET ∆LIM1 PRICKLE1 ∆PET ∆LIM1/2 PRICKLE1 ∆PET ∆LIM1/2/3
115 122 189249313 831 aa
PRICKLE1 Cter CIIS
CIIS PRICKLE1 ∆PET
C
D
PD: GST-CRIB WB: α-Rac1 Lysate WB: α-Rac1 siRNA: NT P02 P04E
1 2 3 4 PD: GST-CRIB WB: α-Rac1 Lysate WB: α-Rac1 WB: α-Cherry (ECT2)WB: α-FLAG (Prickle1 mutants) FLAG-PRICKLE1
FLAG-PRICKLE1 ∆PET ∆LIM1 Cherry-ECT2 + -+ + + + -- - -Ratio Rac1-GTP/Rac1 total
1
2.9 2.9
Ratio Rac1-GTP/Rac1 total 1 1.6 0.6 1.8 MW (kDa)Animal view
Lateral view
Stage 8
Stage 9
Stage 10
Vegetal view
WT
mRFP
MO Prickle1 10ng
MO Ect2 10ng
MO Prickle1 40ng
MO Ect2 20ng
MO Prickle1 5ng +
MO Ect2 5ng
FIGURE 4:
SR %
ND %
DD %
WT
92
98
2
RFP
70
83
17
Mo Ect2 (10ng)
85
88
12
Mo Prickle1 (10ng)
82
82
18
Mo Ect2 (20ng)
63
29
71
Mo Prickle1 (40ng)
50
27
73
Mo Ect2 + Prickle1 (5ng+5ng)
45
33
67
A
B
Table 1: Clinico pathological characteristics of samples in the whole cohort and in subgroup defined according to the GEF/G
down up
Age at diagnosis (years) 3.46E-14
<=50 2540 (36%) 1112 (32%) 1428 (40%)
>50 4488 (64%) 2388 (68%) 2100 (60%)
Pathological type 1.21E-02
ductal 3979 (79%) 1998 (77%) 1981 (80%)
lobular 498 (10%) 263 (10%) 235 (10%)
other 574 (11%) 325 (13%) 249 (10%)
Pathological tumor size (pT) 0.133
pT1 2113 (38%) 1100 (39%) 1013 (36%)
pT2 2923 (52%) 1439 (51%) 1484 (53%)
pT3 595 (11%) 304 (11%) 291 (10%)
Pathological axillary node status (pN) 0.239
0 3446 (56%) 1741 (56%) 1705 (55%)
1 2743 (44%) 1344 (44%) 1399 (45%)
Pathological grade 1.00E-06
1 721 (11%) 442 (14%) 279 (9%)
2 2573 (41%) 1478 (48%) 1095 (34%)
3 2986 (48%) 1181 (38%) 1805 (57%)
ER mRNA status 2.29E-153
negative 2764 (31%) 811 (18%) 1953 (43%) positive 6218 (69%) 3680 (82%) 2538 (57%)
PR mRNA status 8.62E-53
negative 4670 (52%) 1976 (44%) 2694 (60%) positive 4255 (48%) 2489 (56%) 1766 (40%)
ERBB2 mRNA status 0.00021
negative 7884 (88%) 4000 (89%) 3884 (86%) positive 1098 (12%) 491 (11%) 607 (14%)
Molecular subtype 1.00E-06
HR+/HER2- 5929 (66%) 3532 (79%) 2397 (54%)
HER2+ 1098 (12%) 491 (11%) 607 (14%)
TN 1936 (22%) 463 (10%) 1473 (33%)
Metastatic relapse 6.81E-06
no 3127 (77%) 1606 (80%) 1521 (74%)
yes 923 (23%) 396 (20%) 527 (26%)
Follow-up median (range) 42 (1-232 38 (1-221) 37 (1-232) 0.48 5-year MFS % [95%CI] 71% [69-74] 75% [72-79] 67% [64-71] 5.09E-04
GEF/GAP metagene
Table 2: Comparison of the prognostic value of different models based on gene expression in TNBC A, PRICKLE1 & GEF/GAP
MFS,TN BC p-value
PRICKLE1 LRX² 6.23 1.25E-02
PRICKLE1 + GEF/GAP LRX² 8.98 1.12E-02 GEF/GAP+PRICKLE1 vs. PRICKLE1 ΔLRX² 2.75 0.097
B, PRICKLE1 & ECT2
MFS,TN BC p-value
PRICKLE1 LRX² 6.23 1.25E-02
PRICKLE1 + ECT2 LRX² 11 4.14E-03
ECT2+PRICKLE1 vs. PRICKLE1 ΔLRX² 4.74 2.90E-02 statistic