The MIT Faculty has made this article openly available.
Please share
how this access benefits you. Your story matters.
Citation
Chen, Z.-X., D. Sturgill, J. Qu, H. Jiang, S. Park, N. Boley, A. M.
Suzuki, et al. “Comparative Validation of the D. Melanogaster
modENCODE Transcriptome Annotation.” Genome Research 24, no.
7 (July 1, 2014): 1209–1223.
As Published
http://dx.doi.org/10.1101/gr.159384.113
Publisher
Cold Spring Harbor Laboratory Press
Version
Final published version
Citable link
http://hdl.handle.net/1721.1/89401
Terms of Use
Creative Commons Attribution-Noncommercial 4.0
10.1101/gr.159384.113
Access the most recent version at doi:
2014 24: 1209-1223
Genome Res.
Zhen-Xia Chen, David Sturgill, Jiaxin Qu, et al.
transcriptome annotation
modENCODE
D. melanogaster
Comparative validation of the
Material
Supplemental
http://genome.cshlp.org/content/suppl/2014/05/21/gr.159384.113.DC1.html
Related Content
Genome Res. July , 2014 24: 1236-1250
Jiayu Wen, Jaaved Mohammed, Diane Bortolamiol-Becet, et al.
piRNAs across 25 Drosophila cell lines
Diversity of miRNAs, siRNAs, and
Genome Res. July , 2014 24: 1224-1235
Matthew Slattery, Lijia Ma, Rebecca F. Spokony, et al.
transcriptional regulators in Drosophila melanogaster
Diverse patterns of genomic targeting by
Genome Res. July , 2014 24: 1115-1124
Robert K. Arthur, Lijia Ma, Matthew Slattery, et al.
duplication and diversification
chromatin is linked to gene expression evolution and to patterns of gene
Evolution of H3K27me3-marked
Genome Res. July , 2014 24: 1102-1114
Yoav Lubelsky, Joseph A. Prinz, Leyna DeNapoli, et al.
programs respond to the same chromatin cues
DNA replication and transcription
Genome Res. July , 2014 24: 1086-1101
Jingyi Jessica Li, Haiyan Huang, Peter J. Bickel, et al.
and cells by modENCODE RNA-seq data
Comparison of D. melanogaster and C. elegans developmental stages, tissues,
References
http://genome.cshlp.org/content/24/7/1209.full.html#related-urls
Articles cited in:
http://genome.cshlp.org/content/24/7/1209.full.html#ref-list-1
This article cites 62 articles, 31 of which can be accessed free at:
Open Access
Open Access option.
Genome Research
Freely available online through the
License
Commons
Creative
.
http://creativecommons.org/licenses/by-nc/4.0/
License (Attribution-NonCommercial 4.0 International), as described at
, is available under a Creative Commons
Genome Research
This article, published in
Service
Email Alerting
click here.
top right corner of the article or
Receive free email alerts when new articles cite this article - sign up in the box at the
http://genome.cshlp.org/subscriptions
go to:
Genome Research
Comparative validation of the D. melanogaster
modENCODE transcriptome annotation
Zhen-Xia Chen,
1,18David Sturgill,
1,18Jiaxin Qu,
2Huaiyang Jiang,
2Soo Park,
3Nathan Boley,
4Ana Maria Suzuki,
5Anthony R. Fletcher,
6David C. Plachetzki,
7Peter C. FitzGerald,
8Carlo G. Artieri,
1Joel Atallah,
7Olga Barmina,
7James B. Brown,
4Kerstin P. Blankenburg,
2Emily Clough,
1Abhijit Dasgupta,
9Sai Gubbala,
2Yi Han,
2Joy C. Jayaseelan,
2Divya Kalra,
2Yoo-Ah Kim,
10Christie L. Kovar,
2Sandra L. Lee,
2Mingmei Li,
2James D. Malley,
6John H. Malone,
1Tittu Mathew,
2Nicolas R. Mattiuzzo,
1Mala Munidasa,
2Donna M. Muzny,
2Fiona Ongeri,
2Lora Perales,
2Teresa M. Przytycka,
10Ling-Ling Pu,
2Garrett Robinson,
4Rebecca L. Thornton,
2Nehad Saada,
2Steven E. Scherer,
2Harold E. Smith,
1Charles Vinson,
8Crystal B. Warner,
2Kim C. Worley,
2Yuan-Qing Wu,
2Xiaoyan Zou,
2Peter Cherbas,
11Manolis Kellis,
12Michael B. Eisen,
13Fabio Piano,
14Karin Kionte,
14David H. Fitch,
14Paul W. Sternberg,
15Asher D. Cutter,
16Michael O. Duff,
17Roger A. Hoskins,
3Brenton R. Graveley,
17Richard A. Gibbs,
2Peter J. Bickel,
4Artyom Kopp,
7Piero Carninci,
5Susan E. Celniker,
3Brian Oliver,
1,19and Stephen Richards
21–17
[Author affiliations appear at the end of the paper.]
Accurate gene model annotation of reference genomes is critical for making them useful. The modENCODE project has
improved the D. melanogaster genome annotation by using deep and diverse high-throughput data. Since transcriptional
activity that has been evolutionarily conserved is likely to have an advantageous function, we have performed large-scale
interspecific comparisons to increase confidence in predicted annotations. To support comparative genomics, we filled in
divergence gaps in the Drosophila phylogeny by generating draft genomes for eight new species. For comparative
tran-scriptome analysis, we generated mRNA expression profiles on 81 samples from multiple tissues and developmental stages
of 15 Drosophila species, and we performed cap analysis of gene expression in D. melanogaster and D. pseudoobscura. We also
describe conservation of four distinct core promoter structures composed of combinations of elements at three positions.
Overall, each type of genomic feature shows a characteristic divergence rate relative to neutral models, highlighting the
value of multispecies alignment in annotating a target genome that should prove useful in the annotation of other high
priority genomes, especially human and other mammalian genomes that are rich in noncoding sequences. We report that
the vast majority of elements in the annotation are evolutionarily conserved, indicating that the annotation will be an
important springboard for functional genetic testing by the Drosophila community.
[Supplemental material is available for this article.]
The value of sequenced and assembled genomes is increased by high-quality annotation of genes and their possible functions (Picardi and Pesole 2010). Approximately 13,000 gene models developed by a combination of ab initio predictions and expert manual curation were included in the first release of the D. mela-nogaster genome (Adams et al. 2000), and more than a decade of input from members of the Drosophila research community and the FlyBase curators have resulted in an ever improving annotation(McQuilton et al. 2012). However, results from early microarray expression profiling studies demonstrated that transcribed ele-ments were unannotated (Andrews et al. 2000; Hild et al. 2003; Stolc et al. 2004). Evolutionary conservation in the genus has been important for improving annotation of D. melanogaster (Pollard et al. 2006; Drosophila 12 Genomes Consortium 2007; Stark et al. 2007; Zhang et al. 2007). As part of a major effort to improve the annotation, expression profiles provided in the first phase of modENCODE (Cherbas et al. 2011; Graveley et al. 2011) and by complementary studies (Daines et al. 2011) added thousands of new exons to the annotation, especially untranslated 59 and 39
Ó 2014 Chen et al. This article, published in Genome Research, is available under a Creative Commons License (Attribution-NonCommercial 4.0 In-ternational), as described at http://creativecommons.org/licenses/by-nc/4.0/.
18These authors contributed equally to this work. 19Corresponding author
E-mail [email protected]
Article published online before print. Article, supplemental material, and publica-tion date are at http://www.genome.org/cgi/doi/10.1101/gr.159384.113. Freely available online through the Genome Research Open Access option.
regions and noncoding RNAs, as well as confirming the expression of most of the previously annotated transcripts (McQuilton et al. 2012). Importantly, the splice junction spanning reads in those RNA-seq profiles revealed a much richer set of processed tran-scripts. Additional RNA-seq data sets, along with cap analysis of gene expression (CAGE-seq) and full-insert cDNA sequencing, have been used to generate the modENCODE D. melanogaster tran-scriptome annotation version 2 (MDv2), including MDv3 (Brown et al. 2014). This modENCODE annotation was used to support analysis in the current set of publications from the Consortium. Here we evaluate the biological relevance of this annotation.
Biological tests of annotations are important because not all transcribed regions are functional genes. A classic example is the expressed pseudogene, which can arise by gene duplication fol-lowed by degeneration of one redundant copy by random accu-mulation of mutations (Balakirev and Ayala 2003; Zheng et al. 2007). Functionless transcripts might also arise from transposon promoters (Emera and Wagner 2012; Hancks and Kazazian 2012). It is also reasonable to assume that transcriptional errors occur at a nonzero rate. Core promoter elements use a number of motifs (e.g. TATA, Initiator [INR], and downstream promoter element [DPE]) that are often precisely positioned relative to transcription starts in Drosophila (FitzGerald et al. 2006; Ohler 2006; Ohler and Wassarman 2010). These elements direct RNA polymerase to the promoter, but such simple sequence motifs will also appear in ran-dom sequence and might be easily generated de novo by mutation. Indeed, the precise nucleotide position of transcript initiation at bona fide promoters is often probabilistic (Libby and Gallant 1991; Kanamori-Katayama et al. 2011), and it has been suggested that 90% of RNA Pol II molecules are initiating nonspecifically rather than from conventional promoters in yeast (Struhl 2007). Such levels of nonspecific initiation arising as a simple consequence of neutral accumulation of sequence changes and high tolerance for spurious transcription within the organism might well result in transcripts having no biological function.
Comparative data from related organisms can provide crucial evidence of function: Genomic elements that are conserved at the level of sequence and expression have withstood mutation for millions of years and are therefore likely to be under purifying selection. Although the Drosophila genus is well represented in the pantheon of sequenced and assembled genomes, with 12 species spanning 40–154 million years of evolutionary time (Adams et al. 2000; Richards et al. 2005; Drosophila 12 Genomes Consortium 2007; Obbard et al. 2012), our ability to identify regions of the genome that arose by descent from common ancestral sequences declines with increasing sequence divergence. In addition, herent statistical problems with short elements make them in-creasingly difficult to align at greater evolutionary distances. Conversely, closely related genomes may not have had sufficient time to lose deleterious or nonfunctional elements due to in-sufficiently strong purifying selection. Additionally, functional DNA elements can tolerate different amounts of sequence change; for example, one might expect that UTRs will accumulate muta-tions more readily than CDSs, which means that there is no perfect single evolutionary divergence for comparative validation. Finally, gene losses and gains in particular lineages mean that the proba-bility of finding D. melanogaster orthologs will increase with the number of species examined. We report the sequencing and as-sembly of eight additional Drosophila species targeted to increase resolution at intermediate evolutionary distances from D. mela-nogaster. We developed RNA-seq profiles from 81 samples of 15 Drosophila species, generating ;6 billion mapped reads to sample
evolutionary distances and tissues with the aim of maximizing the number of transcript element types we could detect.
Our comparative approach revealed strikingly conserved sequence and expression for the vast majority of models in the D. melanogaster annotation, suggesting that most of the rich modENCODE transcriptome annotation is biologically relevant. These data also indicate that the D. melanogaster transcribed element annotation is nearing completion.
Results
Eight new genomes
Intermediate divergence times from D. melanogaster are under-represented among published Drosophila genomes. These might better balance the needs for accurate alignment to the D. mela-nogaster genome and accumulation of substitutions in sequences not constrained by selection. We therefore generated draft as-semblies of D. biarmipes, D. eugracilis, D. ficusphila, D. takahashii, D. elegans, D. rhopaloa, D. bipectinata, and D. kikkawai (Supple-mental Table S1). To compute evolutionary distances between these and previously sequenced species, we performed a Bayesian phy-logenetic analysis of 41 orthologous coding genes to estimate di-vergence distance in substitutions per site (ss). We found that dis-tances from D. melanogaster (Supplemental Table S2) span a broad range from 0.05 ss (D. simulans) to 1.10 ss (D. mojavensis), with multiple intermediate sampling points (0.30–0.63 ss) from the newly sequenced species (Fig. 1A). Pairwise whole-genome align-ments of D. melanogaster to each of the new assemblies showed that our ability to align contiguous blocks of genome sequence decreased at a rate proportional to distance based on substitutions among orthologs (Fig. 1B), providing us with ample material for analysis of expression from these aligned genome segments.
D. melanogaster adults show rich transcriptional diversity in RNA-seq data sets (Daines et al. 2011; Graveley et al. 2011). Therefore, as a cost-effective sampling strategy, we performed RNA-seq on poly(A)+RNA (Supplemental Table S3) from adult
whole females and males (34–172 million mapped reads for each sex) of all eight of the newly assembled and six of the previously assembled genomes (D. simulans, D. yakuba, D. ananassae, D. pseu-doobscura, D. virilis, and D. mojavensis), as well as previously pub-lished RNA-seq data for D. pseudoobscura and D. mojavensis head samples (Graveley et al. 2011). D. melanogaster reads reported here are independent from those used for the annotation (Brown et al. 2014). To assay stage- and tissue-biased expression, we also per-formed poly(A)+RNA-seq on samples from mixed-sex embryos or several dissected tissues from the 14 non-melanogaster species (Supplemental Table S4). To estimate the conservation of gene ex-pression across samples and species, we clustered exex-pression values in log2reads per kb per million (RPKM) for the first CDS exon of
3223 orthologous genes present in the genomes of all 15 species (Supplemental Table S5). We found striking conservation of ex-pression across species and samples (Fig. 1C). For example, ovary and testis samples from the distantly related D. simulans and D. pseudoobscura showed top-level branching demonstrating that tissue-specific expression of this subset of highly conserved genes in the gonad is constrained at a distance of at least 0.68 ss. Collectively, we obtained ;6 billion mapped RNA-seq reads with a minimum of 168 million uniquely mapped reads for each species (Fig. 1D) to help ensure detection of low abundance transcripts. We used com-parative data to validate the modENCODE elements in the D. mel-anogaster genome (Fig. 1E; Supplemental Tables S6–S10) by testing
whether the sequence of these elements was conserved in other species and whether elements conserved at the se-quence level also showed expression. We use the term ‘‘validation’’ to indicate that we observed expression in at least one other species (>95% of the aligned element covered by at least one RNA-seq read). Validation is evidence that an el-ement was not annotated due to exper-imental artifacts such as species-specific alignment error. We also developed models to estimate neutral divergence rates for elements. We use the term ‘‘conservation’’ to indicate that an ele-ment shows significantly better align-ment and expression level than the neutral model would predict (P < 0.05).
Validation of transcribed elements
The degree of D. melanogaster genomic element alignment to the genomes of other species depended both on evolu-tionary distance and element type (Fig. 2A). For example, the percentage of aligned CDS exons was high in all species and correlated well with evolutionary distance from D. melanogaster (r = 0.93). Alignment of other D. melanogaster tran-script element types was significantly lower (CDS > NC > UTR > intron > inter-genic) but followed the same basic pattern of decreasing alignment with increasing distance. The percentage of alignable elements that were expressed in other species also depended on element type (Fig. 2B), with CDS exons showing the highest expression conservation (CDS > UTR > NC » intron > intergenic). As a result of the correlation between evolutionary distance and alignment, our ability to identify D. melanogaster anno-tated elements in other species tracked phylogenetic distance very closely (Fig. 2C). Overall, we found sequence and expression evidence validating 98% of D. melanogaster CDS exons, 86% of UTR exons, 62% of NC exons, 52% of introns, and 15% of intergenic regions (Supple-mental Table S11).Coding exons were usually aligned and expressed in all species examined. Indeed, 50% of all CDS exons were expressed in at least 60 different samples (Fig. 2D). These data suggest that vali-dating annotation of the coding portion of the genome can be saturated relatively easily, and is essentially complete, due to high conservation of sequence and abun-dant transcription. The major differences between CDS exons in FlyBase (McQuilton Figure 1. Genome assemblies and RNA-seq. (A) Bayesian phylogenetic tree of 20 sequenced
Dro-sophila species (four letter abbreviations). All nodes are supported by 100% posterior probabilities. Scale bar indicates phylogenetic distance in substitutions per site (ss). Previously (italics) and newly assembled (bold italics) genomes, and those with supporting RNA-seq data (asterisk) are indicated. (B) Scatterplot showing alignment versus phylogenetic distance from D. melanogaster (linear trendline in red). (C ) Heatmap and hierarchical clustering of expression values for 3223 first coding exons from the in-dicated samples. Adult ovary (dark red) and testis (dark blue) included developing germ cells and so-matic gonadal cells and internal reproductive tracts derived from the genital disc. Females (pink) and males (light blue) were whole adults, embryos were unsexed, heads were from adults, and carcasses were all adult tissues remaining after removal of the gonads and internal reproductive tract. RPKM scale is shown for 15 species. The distance scale for hierarchical leaves was arbitrary. (D) Sequencing depth by species. A limited number of RNA-seq reads from heads (20.5 million reads for D. melanogaster, 28.4 million reads for D. pseudoobscura, and 51.6 million reads for D. mojavensis) were previously published (Graveley et al. 2011). The remaining reads are reported here for the first time. (E) The number of each element type from the modENCODE version 2 (MDv2) annotation. We examined the conserved se-quence and expression characteristics of all such elements. For purposes of analysis, exons with both UTR and CDS sequences were split.
et al. 2012) and MDv2 (N = 16,661) are restricted to boundaries (39 and 59 ends and splice junctions, which are explored later). Only 17 short CDS exons (range 30–306 nt, median = 60 nt) found in MDv2 were completely missing from the current FlyBase an-notation. Short exons are inherently difficult to predict using gene finders but are detected empirically. As an example, the short 60-nt CDS exon in the sodium chloride cotransporter 69 (Ncc69) locus was not annotated in FlyBase release 5.45. We located this exon in 16 of 20 Drosophila genomes, including 13 species for which we also had supporting RNA-seq data (Fig. 2E).
Neutral models for conservation of transcribed elements
Sequence and expression validation indicates that a particular el-ement is a biochemical entity in D. melanogaster, but evidence of function requires a model. As a first step in the construction of a neutral model, we developed a conservation index (CI). For each species, we took the Boolean present/absent call for an element and multiplied by the distance from D. melanogaster (ss) and thensummed the scores by element, for a maximum possible score of ;7. We then generated a frequency profile for each transcript el-ement (Fig. 3A). Based on the simple determination of presence and expression, CDS exons showed the highest CIs, with the maximum number of elements at or near maximum. The UTR and NC exons showed a peak distribution at a conservation index <0.5; however, there was an extended right tail in these distributions. Conservation of introns was slightly worse, but there was steady decay of the distribution of conservation indexes, such that very few introns had an index >4. Expressed intergenic regions showed the lowest conservation indexes, with ;90% of regions showing a conservation index <0.5 and very few regions showing a conser-vation index >1.5. Although it is quite possible that expression of some intergenic regions is functionally important (see Discussion), a conservative approach is to assume that these regions represent the neutral or nearly neutral evolution of expression. Therefore we used the percentile of intergenic CI as a metric to assign a proba-bility that a validated element was conserved due to selection (Fig. 3B). In the context of modENCODE, these values represent the Figure 2. Exon validation. (A) Percentage of MDv2-annotated CDS exons (black), UTR exons (orange), ncRNA exons (green), introns (blue), and intergenic regions (red) that align in the indicated genome. (B) Percentage of aligned regions expressed (95% element coverage). (C ) Percentage of aligned and expressed for each element type in each non-melanogaster species, plotted against phylogenetic distance from D. melanogaster (Fig. 1E; Supplemental Tables S6–S10). (D) The distribution of aligned and expressed features in RNA-seq samples. (E) Gene model for Ncc69 showing transcription start (arrow), UTR regions (orange fill), CDS (black fill), and introns (black line). Expression of MDv2 exon mdcds_25302 (red asterisk) and flanking region (upstream 300 bp and downstream 150 bp) in 13 species. Log2scale RNA-seq coverage (arbitrary scale for illustration) in whole adult males of the
probability that a biochemically validated element is functional based on conservation of sequence and expression. At P < 0.05, we observed conservation for 95% of CDS exons, 56% of UTR exons, 44% of NC exons, and 32% of introns.
It is difficult to comment on the function of D. melanogaster elements that were not conserved, and we certainly do not rule out species-specific elements. However, we did evaluate some sources of negative results. Elements with low detection due to sample selection in our experiments, sampling depth, low general ex-pression, or expression limited to a few rare cell types, should be
more difficult to evaluate by comparative transcriptomics. To explore the idea that we were underestimating the number of functional elements, we calculated ex-pression in annotated gene models in adult D. melanogaster, in fragments per kb per million reads (FPKM) (Trapnell et al. 2012) and plotted maximum expression levels against CI. For CDS exons (Fig. 3C), we observed the highest density at in-termediate expression and high conser-vation. There was a second area of in-termediate density with low expression (<1 FPKM) across much of the conserva-tion index range (scores 0–5). These data suggest that low gene expression levels in our samples did not impinge on the comparative analysis of these exon fea-tures. Even if we exclude all genes with low expression, the vast majority of CDS exons were validated and conserved. For UTR exons, we observed a similar density distribution, although these were shifted toward lower CI scores (Fig. 3C). As exons within a gene are often derived from the same promoter and as many exons are common to all transcripts from a locus, there was a strong positive correlation between exon expression levels within a gene model (not shown). Thus, at least for the poly(A)+transcripts we analyzed,
poor representation is unlikely to lower the overall high rate of element conser-vation observed across the genus.
Promoter structure and position
An important aspect of gene model an-notation is the accurate identification of transcription start sites (TSSs). In order to map TSSs, modENCODE has performed extensive sequencing of D. melanogaster 59 transcript ends using CAGE-seq (Hoskins et al. 2011). We performed CAGE-seq an-alysis on D. pseudoobscura, the most ex-tensively annotated member of the genus outside of D. melanogaster and with the most RNA-seq reads in this study (>1.5 billion). We used the same RNAs from gonads and reproductive tracts and the remaining adult carcass as samples for both RNA-seq and CAGE-seq experiments (Supplemental Files S1–S8). These samples are important for several reasons. For example, the male germline uses a set of specific tran-scription initiation complex members (Hiller et al. 2004), which might recognize different core promoters. Additionally, at least some genes expressed in the germline (e.g., ovo and ovarian tumor) are known to require specific core promoter subtypes for function (Lu¨ and Oliver 2001; Bielinska et al. 2005).We examined the relationship between 125,727 CAGE sites identified in D. melanogaster, and 111,845 CAGE sites identified in D. pseudoobscura. Although 40% of D. melanogaster CAGE site Figure 3. Exon conservation. (A) Frequency of conservation index (CI) scores for MDv2-annotated
CDS exons (black), UTR exons (orange), ncRNA exons (green), introns (blue), and intergenic regions (red). (B) Frequency of probabilities that CI scores for CDS exons (shades of black), UTR exons (shades of orange), NC exons (shades of green), and introns (shades of blue) were similar to those of intergenic regions. The P-value is shown in the key (0.05, 0.01, 0.001 from left to right for each element) (Fig. 1E; Supplemental Tables S6–S10). (C ) Density plots illustrating the relationship between CDS and UTR exons’ CI and maximum element gene-level expression values (FPKM) in D. melanogaster adults.
sequences aligned to D. pseudoobscura, only 13% overlapped in both species at exactly 1 bp, suggesting that the similar sequences in these aligned promoters have different functions in the two species. However, we found that 81% of D. melanogaster CAGE sites that aligned to the D. pseudoobscura genome were within 20 nt of a D. pseudoobscura CAGE site, suggesting that promoter position is roughly the same in these species. A priori, promoter position could be nearly neutral in evolutionary terms as long as the ORF and any translational regulatory information in the UTR is downstream from the promoter and therefore subject to positional drift. Alternatively, the shifts in CAGE site position we observed could be due to changes in the core promoter motifs between these species. To determine the likelihood of these alternatives, we per-formed sequence motif analysis on regions flanking CAGE sites.
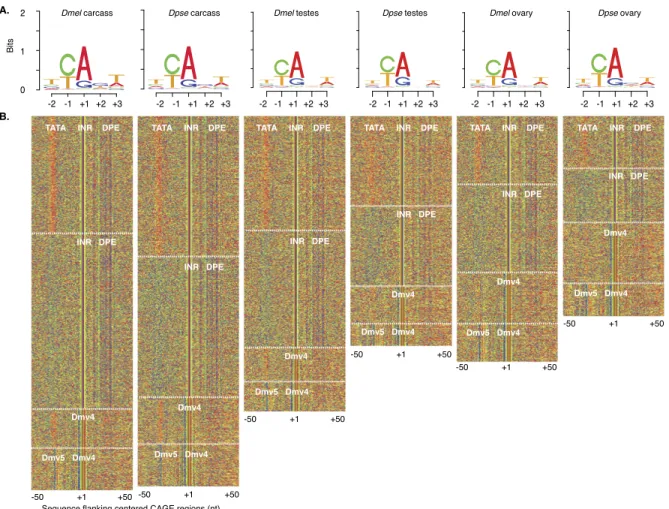
Three different methods of sequence analysis (motif finding, clustering, and random forests; see Methods) revealed diagnostic short motifs (FitzGerald et al. 2006; Ohler 2006) at the predicted TSS in both species. Like previously annotated TSSs in D. mela-nogaster, we observed enrichment for a CA dinucleotide, where the A is +1 in the transcript (Fig. 4A). The core TSS motif position weight matrix was nearly identical between tissues and species. A large subset of TSSs also showed clear patterns in flanking regions. We observed AT-rich sequences diagnostic of the nucleosome-poor
regions upstream of well-annotated D. melanogaster promoters (not shown), as well as known core promoter motifs, flanking the CAGE defined TSSs (Fig. 4B). Interestingly, we found four types of co-associated motifs among these promoters: (1) with a combina-tion of TATA (TATAAA), INR (TCAGTY), and DPE (CGGTT); (2) with an INR and DPE as well as a slightly higher CG content; (3) with Dmv4 (GGYCACAC) in the place of INR; and (4) with a Dmv5 (TGGTATTT) in place of TATA and a Dmv4 motif in place of an INR (Fig. 4B; Supplemental Table S12). We observed only subtle dif-ferences in promoter type from tissue to tissue or species to species. At the tissue level, there was a stronger TATA signature in the type-3 promoters in carcass samples relative to gonads. At the species level, the TATA signature of type-1 promoters was more diffuse in D. pseudoobscura testis. This finding suggests that there are in-terdependencies among core promoter motifs, and at least four basic core promoter structures are conserved in the genus.
Since TSSs are short, degenerate, and abundant in the ge-nome, novel sites may easily arise by mutation (Stone and Wray 2001). If the four types of core promoters are functionally equiv-alent, then the type of core promoter at a given locus should be random because substitutions are extensive between D. mela-nogaster and D. pseudoobscura (0.68 ss). However, we found that core promoter types were maintained between species because the
Figure 4. Transcription start site motifs. (A) Sequence logos centered on the ‘‘CA’’ motif (where A = +1 of CAGE sites) derived from the peak distribution of CAGE reads from each D. melanogaster and D. pseudoobscura sample. CAGE-seq used the same mRNA samples as RNA-seq (Fig. 1C). (B) K-means clustering of sequences flanking the CAGE site sequences (A, red; C, green; G, blue; T, orange). Promoter regions lacking obvious structure are not shown. Regulatory motifs (white text) in each cluster are indicated (delineated by white dashed lines).
corresponding genes were found in the same cluster class more often than expected (P < 10 10, Fisher’s exact test).
Additionally, differences in core pro-moter structure between species in-volved ‘‘conservative’’ shifts. For example, the most common differences involve switches between type-1 TATA/INR/DPE and type-2 INR/DPE promoters. As a more definitive test of chance co-occurrence of TSS sites between D. melanogaster and D. pseudoobscura, we generated a neutral model by asking how often the most common tetramers at TSS were conserved in intergenic space. For example, the most common TSS tetramer CAGT occurs in 23% of TSSs. We were able to align 37% of D. melanogaster intergenic space CAGT sequences to D. pseudoobscura intergenic CAGT regions. In contrast, 57%–61% of CAGT motifs at gonad TSSs and 71% of CAGT motifs at carcass TSSs were align-able between the species, indicating that they are selectively constrained at TSS (P < 10 10, Fisher’s exact test). Interestingly,
there was also a significant two- to three-fold enrichment for CAGT to CATT sub-stitutions in D. pseudoobscura TSS sites relative to intergenic substitutions. CATT is the tetramer in the initiator variant, INR1 (TCATTCG) (FitzGerald et al. 2006), the second most common motif at TSS. These data indicate that there is selection to maintain the particular configuration of TSS motifs at a given gene.
We asked if indels between TSS and the CDS could account for the observed shifts in TSS location between the species and how extensive these shifts might be in a compact Drosophila genome (Fig. 5). We found a strong positive correlation between CAGE sites and CDS initiation position, between tissues within a species and between species (Fig. 5A,B), with the majority of CAGE sites within 500 bp of the CDS in both species. We observed two patterns in orthologs when the CAGE sites were further away. In some ortho-logs, the extended distances were con-served, and in others a distant CAGE site in one species was proximal in the other (moderate density along the diagonal and along each axis). Global rates of indel formation in Drosophila result in a 20.4% difference in the size of an element between D. melanogaster and D. pseudoobscura (Leushkin et al. 2013). Similarly, we observed a 20.9% median
difference in the size of aligned intergenic regions between these species. Although the change in the TSS to AUG distance measured from carcass (19.6%) and ovary (20.0%) RNAs between these two species is close to the size change of intergenic regions, the distance
change in testes was much larger (30.3%), suggesting that random indels or perhaps even preferential indel accumulation in the case of testis promoters contributes to TSS positional shifts. However, indels do not explain the cases in which we observed the same TSS Figure 5. Transcription start site position. (A,B) Density plot (color scale) of distance between translation start (encoding the first AUG of the open reading frame) and CAGE site between D. mela-nogaster tissues or species (see Supplemental Files S1–S8 for browser-ready CAGE data files). (C ) CAGE site examples for the chinmo locus expression in testes. UTR (orange fill) and CDS exons (black), an-notated TSS (red arrow), CAGE sites (red), and RNA-seq read density (black) do not align, but there is clear evidence of these structures from RNA-seq (black). Aligned and presumably orthologous CAGE sites (red asterisk) are shown. Double-ended arrows indicate distance from CDS to the CAGE sites.
tetramer in both species with evidence of a functional TSS in only one species.
We explored the many situations (>30 k per species) in which new promoters may have evolved in one or both species relative to the last common ancestor. A good example of multiple conserved and novel TSSs was at the chronologically inappropriate morphogenesis (chinmo) locus (Fig. 5C). There were two CAGE sites each in the testis samples from D. melanogaster and D. pseudoobscura. The proximal D. melanogaster site aligned with the proximal D. pseudoobscura CAGE site even though the CAGE site to ATG distance was different due to an indel. The distal D. melanogaster CAGE site aligns to D. pseudoobscura, but was not used. The distal D. pseudooscura CAGE site was novel. Thus, there are clear examples of both shifts in TSS use independent of sequence evolution, in addition to indels changing the spacing between the TSS and CDS.
Splice junctions
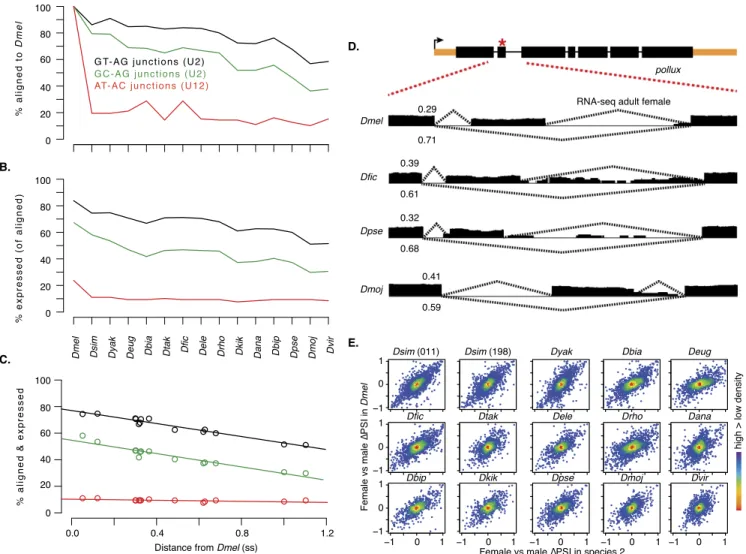
The most extensive contribution of MDv2 to the D. melanogaster annotation is at the level of RNA processing, where 8120 newly annotated splice junctions bring the total for D. melanogaster to 64,644. The majority of D. melanogaster introns (99.9%) are spliced by U2-type spliceosomes (recognizing GT-AG and GC-AG donor–acceptor motifs). However, minor forms processed by U12-type spliceosomes (recognizing AT-AC motifs) are also pres-ent (Sheth et al. 2006). We aligned regions flanking splice junc-tions of each type in D. melanogaster with the genomes of the other Drosophila species, again with sensitivity that tracked phylogenetic distance (Fig. 6A; Supplemental Table S13). Overall, we aligned 97.7% of splice junctions to at least one non-mela-nogaster species. However, the U12-type spliceosome junctions were poorly aligned.
Figure 6. RNA splicing validation. (A) D. melanogaster MDv2 GT-AG (black) and GC-AG (green) splice junctions (recognized by U2 spliceosomes) and AT-AC splice junctions (red) (recognized by U12 spliceosomes) that align to the indicated genomes. (B) Aligned elements expressed ($1 junction spanning read). (C ) Combined sequence and expression conservation for each element type plotted against distance from D. melanogaster. (D) An example of a validated splicing event in a transcript model of the pollux gene. (Upper panel) An exon previously annotated as constitutive is annotated as an alternatively spliced cassette in MDv2 (red asterisk). (Lower panels) RNA-seq read coverage (black), and junction coverage with percent spliced in (PSI) values for the cassette exon inclusion (upper dotted lines) and exclusion (lower dotted lines) isoforms in adult females of the indicated species. Additional species also showed this splicing pattern (not shown). (E) Density plots of female/male nPSI values for species (and two strains in the case of D. simulans) plotted against D. melanogaster female/male nPSI values.
We mapped junction-spanning reads from each species back to the source genome to determine whether splice junctions were used (Fig. 6B; Supplemental Table S13). Aligned GT-AG donor– acceptor motifs were utilized as bona fide splice junctions at a higher frequency than conserved GC-AG motifs. This is un-surprising because GC-AG introns have intrinsically weak donor sites that must rigidly adhere to other consensus sequences to be recognized by the U2 spliceosome (Thanaraj and Clark 2001), so these may be vulnerable to mutation and rapid evolution. As we observed with exons, the relationship between element validation and divergence was linear (Fig. 6C), allowing us to calculate ele-ment half-life for U2-mediated splicing events. Overall, GT-AG junctions showed a half-life of 1.67 ss and GC-AG junctions a half-life of 1.03 ss (Supplemental Table S14). However, the val-idation of AT-AC junctions was unrelated to phylogenetic dis-tance. Of the AT-AC junctions that were annotated exclusively by modENCODE, we detected use of only 16% in D. melanogaster and only 4% were aligned and expressed in non-melanogaster species. However, the subset of AT-AC junctions that were detected in D. melanogaster and validated by comparative annotation were used throughout the genus. For example, of the 13 AT-AC junctions that were used in both D. melanogaster and D. simulans, 10 were also used in the most distantly related species (>1.0 ss). Thus, there are clear examples of validated U12 spliceosome AT-AC junctions.
New splicing patterns identified in MDv2 provide a fuller accounting of proteomic complexity in D. melanogaster. Although many newly annotated junctions are in untranslated regions, 2115 have overlap with annotated coding regions. For example, the pollux (plx) gene has a newly annotated junction that defines an
alternatively spliced cassette exon rather than the previously an-notated constitutive exon (Fig. 6D). This alternative splicing event is broadly conserved in the Drosophila genus, as we observed both the inclusion and exclusion junctions in 14 species with RNA-seq data, including those most distantly diverged from D. melanogaster (additional species not shown). Additionally, the percent spliced in (PSI) for the alternative paths is also conserved, indicating that the isoform ratios are subject to constraint. The conservation of al-ternative splicing ratios is a general feature (Fig. 6E; Supplemental Table S15). We obtained RNA-seq data for the adult sexes in all the species, and a pairwise comparison of female/male DPSI values of those species against D. melanogaster showed a strong linear relationship.
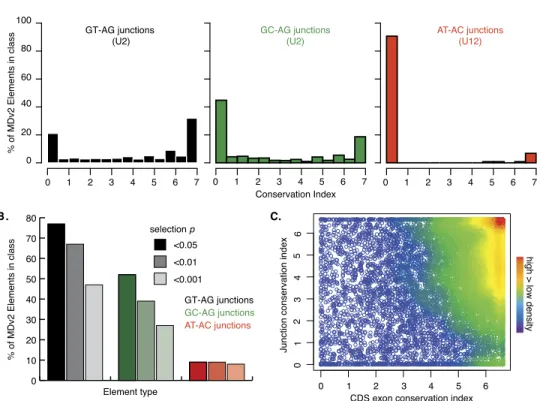
We again used the CI score for every D. melanogaster junc-tion to estimate the contribujunc-tion of selecjunc-tion (Fig. 7A). All three junction types showed a strongly bimodal distribution with peaks in the distributions of CI at <0.5 and >6.5. Those that were used throughout the genus are likely to represent strongly con-served splicing events that are subject to strong selection (Fig. 7B). At P < 0.05, we observed conservation of 77% of GT-AG junctions, 52% of GC-AG junctions, and 9% of AT-AC junctions. The distribution of AT-AC junction conservation P-values was strikingly skewed, such that essentially all junction P-values <0.95 were also <0.001. This suggests that many of the AT-AC junctions are either invalid or neutral in evolutionary terms. However, the few conserved AT-AC junctions we observed are essentially fixed in the phylogeny. This is consistent with the very rare gains or losses of U12 splice sites, as well as U12 to U2 switches, in metazoans (Lin et al. 2010).
Figure 7. RNA splicing conservation. (A) Frequency of CI scores for MDv2 annotated GT-AG (black) and GC-AG (green) splice junctions (recognized by U2 spliceosomes) and AT-AC splice junctions (red) (recognized by U12 spliceosomes). (B) Frequency of probabilities that the exon conservation indexes for GT-AG junctions (shades of black), GC-AG junctions (shades of green), and AT-AC junctions (shades of red) were similar to intergenic regions (Supple-mental Table S13). The P-value column order for each element is shown in the key (0.05, 0.01, and 0.001 from left to right for each element). (C ) Density plot illustrating the relationship between the mean CDS exon and junction conservation index scores within a gene.
The evolution of splicing patterns has not been examined as extensively as DNA sequences, or gene-level expression, but recent reports indicate that alternative splicing may evolve more rapidly than expression (Merkin et al. 2012). Thus, lower vali-dation might be expected for evolutionary reasons. However, it is also true that junction detection is much more complicated technically and is more subject to detection errors (see Discus-sion). Given that we have the highest confidence in the CDS exons, where strong selection to maintain open reading frames should result in conserved splicing patterns, we compared the mean junction CI scores with the mean CI scores averaged by gene (Fig. 7C). We observed the highest density of points at high CI in both data sets. However, there were genes with maximum exon CI values with a wide range of junction CI values, sug-gesting that technical issues contributed to some failed junction detections.
RNA editing
Adenosine deaminase acting on RNA (ADAR) catalyzes the de-amination of adenosine to inosine (A-to-I) in dsRNA regions that can alter secondary structure, siRNA targeting, polypeptide di-versity or expression (Jin et al. 2009). The modENCODE Project identified 972 edited positions in 597 genes (Graveley et al. 2011). Our comparative approach is critically important for validating editing, a feature that cannot be inferred from genome sequence alone, and because RNA-seq error results in mismatches relative to the genome. As a result, the extent of editing has been contro-versial (Li et al. 2011; Bass et al. 2012). Species comparison provides higher confidence in the validation of these elements (Danecek et al. 2012).
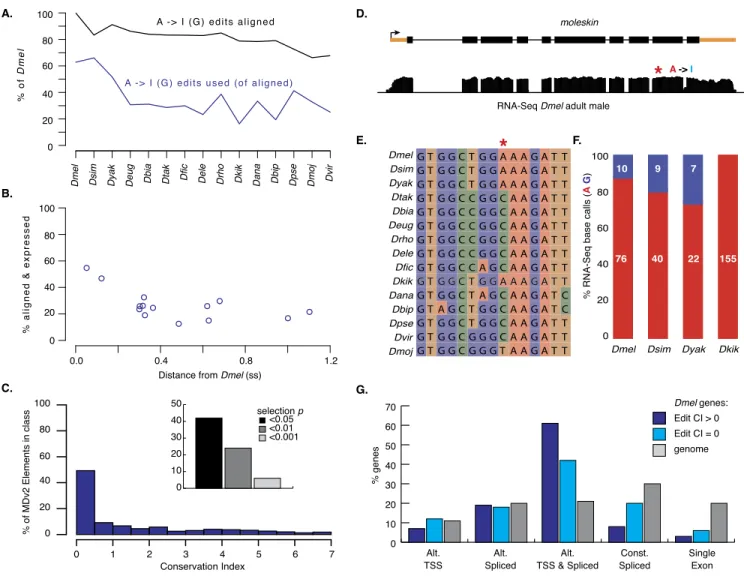
We aligned 99% of edited positions in genomic sequence in at least one non-melanogaster species, and >66% align even in the most distantly related species (Fig. 8A). This level of conservation
Figure 8. RNA editing. (A) D. melanogaster editing events that align to the indicated genomes (black) and are used if aligned (blue). (B) Combined sequence and expression conservation for editing events. (C ) Frequency of conservation index scores for MDv2-annotated edits. (Inset) Probability that CI is random (shades of black). (D) An example of a validated editing site in moleskin with a low CI. Gene model and log2scale RNA-seq coverage in adult
males with editing site are indicated (red asterisk). (E) Genome alignment of moleskin editing site (red asterisk) and flanking region. (D,E) Nucleotides are color coded (I, light blue; A, red; C, green; G, blue; T, orange). (F) Stacked bar plot of editing site base calling in D. melanogaster, D. simulans, D. yakuba, and D. kikkawai. (G) Frequencies of editing occurrence among transcripts from genes with annotated alternative transcription start sites (Alt. TSS), alternative splicing (Alt. Spliced), both alternative transcription start sites and splicing (Alt. TSS & Alt. Spliced), multiexon genes with a single annotated isoform, and single exon genes. All D. melanogaster genes (gray), those with edits in at least one other species (dark blue), and those with edits only in D. melanogaster (light blue) are shown.
was comparable to what we observed for CDS exons (Fig. 3A), which is unsurprising as many of the editing events were em-bedded within CDS exons. To validate the RNA editing events, we asked if there were ‘‘G’’ bases (‘‘I’’ is read as ‘‘G’’) in RNA-seq reads at ‘‘A’’ locations in the corresponding assemblies. Consid-ering that the base calling error rate is >1%, we required $5% of reads showing an editing-type mismatch. We found that 70% of the D. melanogaster annotated editing sites were confirmed in our non-melanogaster data. Most conserved editing events were ob-served in D. simulans and D. yakuba, two very close relatives of D. melanogaster (Fig. 8A,B; Supplemental Table S16). However, evidence for conserved editing was quite sparse in the remaining species and relatively flat across the rest of the phylogeny (we did not estimate editing site half-life due to that lack of a phylogeny-wide linear relationship between conservation and distance). The CI distributions showed a maximum in the lowest bin (<0.5), with a long extended tail to the maximum CI score, supporting the idea that there are many rapidly evolving editing events as well as a few highly conserved events. Overall, 42% of D. mela-nogaster editing events are likely to be functional (P < 0.05) based on comparison to the intergenic region neutral model (Fig. 8C). Our RNA-seq data showed that genes subject to editing in D. melanogaster were expressed at significantly higher levels than genes without edits throughout the phylogeny (not shown), therefore failure to detect such events was not due to low expression.
Among the 682 sites used in non-melanogaster species, 478 CDS edits alter amino acid coding and 112 are synonymous, and 92 were in UTRs. An example of a conserved editing event is a site in the moleskin (msk) coding sequence (Fig. 8D–F). This site is synonymous (in the wobble position of a glycine codon) in D. melanogaster and is a potentially editable ‘‘A’’ in seven non-melanogaster species, including four species where we obtained RNA-seq data. We found evidence for editing in D. simulans and D. yakuba (<0.30 ss) but not in the more distantly related D. kikkawai (0.48 ss). The potential editing site was lost in many of the species due to an A > C substitution relative to D. melanogaster.
Because of the nonlinearity in edit validation relative to di-vergence, the analysis of more species, especially ones more closely related to D. melanogaster, may be required to define the rate of editing evolution and to determine if most D. melanogaster editing events are changing due to drift or selection. We did observe a slightly higher validation rate for editing events that change the encoded amino acid (not shown), suggesting that amino acid changing events result in functional changes in the encoded pro-teins that are under selection, but this will require further analysis with additional species. However, we did look for additional evi-dence (albeit ad hoc) to inform edit function in D. melanogaster. Given that editing contributes to regulatory complexity, we asked if editing events were significantly enriched in genes showing complexity at the level of alternative TSS use and alternative splicing (Fig. 8G). Although ;20% of all D. melanogaster genes show both alternative TSS use and alternative splicing, ;60% of genes with edits in at least one non-melanogaster species were in this category. Even the genes where we found edits only in D. melanogaster were overrepresented among genes with higher regulatory complexity. In contrast, we found that editing events were significantly underrepresented in genes with single isoforms. These data indicate that editing increases isoform diversity at genes, which already show complex regulation. These data raise the possibility that edits with low CI scores are functional, but species-specific or lineage-specific.
Discussion
Biochemical validation and evolutionary conservation
of modENCODE transcripts
The modENCODE and ENCODE mission (Celniker et al. 2009; The ENCODE Project Consortium 2012) is to identify all the functional elements in the D. melanogaster, C. elegans, and human genomes. This is essentially a project to take empirical biochemical evidence and map it back onto the genome. Simple conservation of se-quence and expression provides strong validation of the physical presence of transcripts, but it does not imply function unless it is measured relative to the probability of occurrence by chance. Analysis of defective D. melanogaster transposons (Petrov et al. 1996) suggests that neutral DNA has a half-life of ;0.19 ss (see Methods). We calculated a 0.16 ss half-life for nonexpressed intergenic DNA. Using these estimates, a functionally neutral ele-ment would be overwritten in most of the lineages outside of the melanogaster subgroup. Our extensive data from multiple species spanning a wide range of phylogenetic distances allowed us to calculate the rates of divergence and the evolutionary half-life for different types of conserved transcribed elements: CDS exons (2.06 ss), NC exons (0.58 ss), introns (0.39 ss), UTR exons (0.36 ss), and total intergenic space (0.24 ss). All of these values are greater than the estimated half-life of neutral DNA, indicating that all classes of transcribed elements, including introns and expressed intergenic DNA, are functionally constrained. In terms of D. melanogaster annotations, this means our use of total intergenic space as a model for neutral sequence and position change is conservative.
Caveats
The absence of comparative evidence does not imply that there is no function for a species-specific element. Therefore, some of the elements that have low conservation scores in our report may ul-timately be shown to be functional. Conversely, we might over-estimate the selection for expression, as expression and sequence need not always be causally linked. For example, excised introns generally do not contribute to gene function, but D. melanogaster introns were aligned to and showed expression in non-mela-nogaster species. Here the conservation of intron sequence is con-sistent with functional constraint on intron evolution, possibly due to the regular presence of intronic splicing enhancers (Hare and Palumbi 2003; Xing and Lee 2006) and transcriptional en-hancers (Banerji et al. 1983; Rowntree et al. 2001) rather than ex-pression per se. If introns have little direct function as RNA-ele-ments, then we might expect that the expression of most introns would be low, because most reads mapping to introns would be derived from incompletely processed transcripts. Indeed, most were detected at very low coverage in the RNA-seq data sets (0.3%– 3.3% of mapped reads). Additionally, only 19% of D. melanogaster introns were mapped and expressed in species with distances >0.6 ss. Although some retained introns might be functional RNA ele-ments (e.g., misannotated alternative isoforms), it is reasonable to assume that the vast majority of expressed introns are detected processing intermediates.
Similarly, regulatory sequences in intergenic space might be conserved but not in order to produce transcripts, or at least not principally for that reason. For example, there is transcription at enhancers (Natoli and Andrau 2012). We observed very little intergenic transcription in D. melanogaster (for example, <18% of intergenic bases were covered by reads in any one sample type). The lack of detected transcription in >82% of D. melanogaster
intergenic bases is important because this suggests that there are regions of the genome free from easily detectable transcriptional noise. Furthermore, when we did observe conserved intergenic expression, only a small fraction of reads mapped to that con-served intergenic space in any species (0.01%–1.08% of mapped reads), and most of this expression was not well conserved in the phylogeny. For example, we observed conservation of sequence and expression of only 3% of the MDv2 intergenic regions at >0.6 ss, suggesting that much of the intergenic transcription of conserved sequences is nonfunctional. Additionally, among all the expressed elements, these regions showed expression in the fewest numbers of samples. These data suggest that most intergenic space is likely to accumulate expression divergence due to chance.
What is missing and what might be removed
from the annotation?
We have shown that the Drosophila genome and annotation built from modENCODE and community data over the last decade is of very high quality, but it is more difficult to determine how many transcripts remain undiscovered. A systematic way of estimating completeness is to carefully examine intergenic expression and determine if targeted analysis in those regions is justified. Some intergenic expression could be due to artifact, but if RNA-seq ar-tifacts resulted in the appearance of expression where no tran-scripts existed, we would not expect supporting evidence from other modENCODE data sets. Expressed intergenic regions in D. melanogaster were enriched for CAGE sites indicative of pro-moters (Hoskins et al. 2011) and with histone H3K27ac modifi-cations (Supplemental Table S17; Ne`gre et al. 2011), which are markers of transcriptional activity. These data validate the bio-chemical activity of the corresponding regions. Interestingly, en-richment for CAGE sites and H3K27ac in D. melanogaster was maximal for intergenic regions conserved and expressed in distantly related species (distance >0.3 ss), suggesting that some unannotated and functional transcribed elements remain. These transcripts ten-ded to be both rare and lowly expressed. Although we chose to use a conservative neutral model incorporating both expressed and nonexpressed intergenic space, the rare aligned and transcribed intergenic regions will be of special interest in future rounds of an-notation. Indeed many have already been incorporated as UTR exons in the working draft of the modENCODE version 3 annota-tion (MDv3) (Brown et al. 2014).
We were unable to conclusively determine the cause of poor AT-AC junction validation and suggest that these might require more targeted experimental validation. In the meantime, we sug-gest that annotation end-users carefully review any AT-AC junc-tions in a gene of interest.
Conclusions
There has been prolific recent criticism of the ENCODE annotation project, suggesting that much of the effort has been to map func-tionless regions of the genome (Eddy 2012; Kapranov and St Laurent 2012; Doolittle 2013; Graur et al. 2013; Niu and Jiang 2013). Our analysis indicates that the vast majority of transcribed elements in the D. melanogaster modENCODE annotation are evolution-arily conserved. Although it is certainly possible that some tran-scription is selected based on selfish DNA function that does not benefit the host, the most parsimonious conclusion is that the annotated transcribed elements perform functions that are con-strained by natural selection acting on the organism. Given that
ENCODE has used similar methods to annotate transcribed ele-ments in the human genome, it seems likely that those eleele-ments are also under selective constraint. However, the euchromatic portion of the Drosophila genome is quite compact and may well exhibit less functionless transcriptional noise than the human genome. This makes it even more important to apply comparative methods to improve ENCODE annotations. There are genomes available for this work, as the human-mouse-rat-dog group comprises 0.68 ss of divergence time (Lindblad-Toh et al. 2011). This is comparable to the distances flanking D. melanogaster and D. pseudoobscura. If our observations on the rates of decay of transcribed elements are general, rather than specific to fruit flies, then sampling taxa within this range should allow the validation of the human transcriptome annotation.
Methods
Genomes
D. biarmipes, D. eugracilis, D. ficusphila, D. takahashii, D. elegans, D. rhopaloa, D. bipectinata, and D. kikkawai were inbred by single-pair, full-sib crosses for 10–18 generations (with the exception of D. rhopaloa, which did not tolerate inbreeding). All genome strains have been deposited in the San Diego (USA) and Ehime (Japan) Drosophila species stock centers. We prepared shotgun genomic paired-end libraries for sequencing on a Genome Sequencer FLX instrument using Titanium chemistry (Roche) using standard methods. Genome assembly was performed using the CABOG as-sembler. We utilized Illumina technology to correct for any 454 homopolymer errors that may have otherwise been incorporated in the reference genome sequences. Additional detail on the library construction, sequencing, and assembly methods is available in the Supplemental Material.
For analysis, we used GenBank files under these identifiers: D. biarmipes (Dbia_1.0), D. bipectinata (Dbip_1.0), D. elegans (Dele_1.0), D. eugracillis (Deug_1.0), D. ficusphila (Dfic_1.0), D. kikkawai (Dkik_1.0), D. rhopaloa (Drho_1.0), D. takahashii (Dtak_1.0), D. psedoobscura (Dpse_2.0), D. ananassae (GCA_000005115.1), D.erecta (GCA_000005135.1), D. grimshawi (GCA_000005155.1), D. melanogaster (GCA_000001215.1), D. mojavensis (GCA_ 000005175.1), D. persimilis (GCA_000005195.1), D. sechellia (GCA_000005215.1), D. simulans (GCA_000259055.1), D. virilis (GCA_000005245.1), D. willistoni (GCA_000005925.1), and D. yakuba (GCA_000005975.1).
Phylogenetic analysis
We constructed phylogenetic trees using 41 loci that were present in at least 75% of the species using MrBayes 3.2 (Ronquist et al. 2012). We used the combined branch length separating these species on the phylogeny, expressed in substitutions per site (ss). Whole-genome alignments between D. melanogaster and other species were performed using LASTZ (Harris 2007) using UCSC Genome Browser liftOver software (Kent et al. 2002) to project D. melanogaster annotation coordinates from the modENCODE D. melanogaster transcriptome (MDv2) and FlyBase r5.45 to the genomes of each species. Additional methodological detail is in the Supplemental Material.
Expression analysis
We generated RNA reads on the Illumina platform. Reads for exons, introns, and intergenic space were uniquely mapped using TopHat v2.0.3 (Trapnell et al. 2012). For abundance comparisons
between samples and between species, we used Cufflinks (Trapnell et al. 2012). To estimate background expression (<1.47 RPKM), we used read density in intergenic space.
CAGE (Takahashi et al. 2012) reads were aligned to the D. pseudoobscura genome using StatMap (http://www.statmap-bio.org/) and represented as a 1-bp CAGE site. To compare orthologous TSSs, we used the translation start sites of 1:1 ortho-logs of D. melanogaster and D. pseudoobscura from OrthoDB version 6 (Waterhouse et al. 2013). We used Random Forests (Malley et al. 2012), seqLogo v.1.2 (Bembom 2012), and k-means clustering to examine regions flanking CAGE sites for motifs. Additional methodological detail is in the Supplemental Material.
Post-translational modifications
Splicing analysis was performed with the Splicing Analysis Toolkit (Spanki) v.0.4.0 (http://www.cbcb.umd.edu/software/spanki; and https://github.com/dsturg/Spanki). Briefly, this program analyzes splicing at the junction level by calculating read coverage over splice junctions and over exon–intron boundaries (Sturgill et al. 2013). Alternative splicing was quantified from junction coverage using the percent spliced in (PSI) metric. For the validation of aligned editing sites, we extracted the base calling at the aligned editing sites with the mpileup command in SAMtools (v.0.1.18) (Li et al. 2009) and compared them with the reference bases. Reads where base calling of the site is ‘‘G’’ and reference is ‘‘A,’’ or base calling of the site is ‘‘C’’ and reference is ‘‘T,’’ were taken as evidence of editing; base calling that is the same as reference bases were taken as reference match, and other reads were excluded.
Data access
The RNA-seq data from this study have been submitted to the NCBI Gene Expression Omnibus (GEO; http://www.ncbi.nlm. nih.gov/geo/) under accession number GSE44612. Reads for all CAGE experiments have been submitted to the NCBI Sequence Read Archive (SRA; http://www.ncbi.nlm.nih.gov/sra) under the following accession numbers: SRR488282, SRR488283, SRR488284, SRR488285, SRR488308, SRR488309, and SRR488325 (D. mela-nogaster); and SRR488317, SRR488318, SRR488319, and SRR488320 (D. pseudoobscura). All DNA sequencing data have been submitted to the NCBI SRA under the following accession numbers: SRP007984, SRP007991, SRP008002, SRP008019, SRP008020, SRP008021, SRP008024, and SRP008029. Genome assemblies have been sub-mitted to NCBI GenBank (http://www.ncbi.nlm.nih.gov/genbank/) under identifiers: D. biarmipes (Dbia_2.0), D. bipectinata (Dbip_2.0), D. elegans (Dele_2.0), D. eugracillis (Deug_2.0), D. ficusphila (Dfic_2.0), D. kikkawai (Dkik_2.0), D. rhopaloa (Drho_2.0), and D. takahashii (Dtak_2.0).
Competing interest statement
Certain commercial equipment, instruments, or materials are identified in this document. Such identification does not imply recommendation or endorsement by NIH, nor does it imply that the products identified are necessarily the best available for the purpose.
List of affiliations
1National Institute of Diabetes and Digestive and Kidney Diseases, National Institutes of Health, Bethesda, Maryland 20892, USA;
2Human Genome Sequencing Center, Baylor College of Medicine,
Houston, Texas 77030, USA;3Department of Genome Dynamics,
Life Sciences Division, Lawrence Berkeley National Laboratory, Berkeley, California 94720, USA;4Department of Statistics,
Uni-versity of California, Berkeley, California 94720, USA;5Technology
Development Group, RIKEN Omics Science Center and RIKEN Center for Life Science Technologies, Division of Genomic Tech-nologies, Yokohama City, Kanagawa, Japan 230-0045;6Division
of Computational Bioscience, Center For Information Technology, National Institutes of Health, Bethesda, Maryland 20814, USA;
7Department of Evolution and Ecology, University of California,
Davis, California 95616, USA;8National Cancer Institute, National Institutes of Health, Bethesda, Maryland 20892, USA; 9Clinical Trials and Outcomes Branch, National Institute of Arthritis and Musculoskeletal and Skin Diseases, National Institutes of Health, Bethesda, Maryland 20892, USA; 10National Center for Bio-technology Information, National Library of Medicine, Na-tional Institutes of Health, Bethesda, Maryland 20892, USA;
11
Department of Biology, Indiana University, Bloomington, Indi-ana 47405, USA;12Computer Science and Artificial Intelligence
Laboratory, Massachusetts Institute of Technology, Cambridge, Massachusetts 20139, USA;13Molecular and Cell Biology, Univer-sity of California, Berkeley, California 94720, USA;14Department
of Biology, New York University, New York, New York 10003, USA;
15
HHMI and Division of Biology, California Institute of Technol-ogy, Pasadena, California 91125, USA;16Department of Ecology
and Evolutionary Biology, University of Toronto, Toronto, M5S 3B2, Canada;17Department of Genetics and Developmental Bi-ology, Institute for Systems Genomics, University of Connecticut Health Center, Farmington, Connecticut 06030-6403, USA.
Acknowledgments
We thank modENCODE and laboratory members for discussion. This research was supported by the Intramural Research Programs of the National Institutes of Health, NIDDK (DK015600-18 to B.O.) and by the extramural National Institutes of Health program (1ROIGM082843 to A.K.; U01HB004271 to S.E.C.). This study utilized the high-performance computational capabilities of the Biowulf Linux cluster at the National Institutes of Health, Bethesda, Maryland (http://biowulf.nih.gov).
Author contributions: C.G.A., N.R.M., J.H.M., A.K., and O.B. collected samples and prepared RNA. C.G.A., N.R.M., J.H.M., H.E.S., Y.-Q.W., S.L.L., J.C.J., K.P.B., L-L.P., L.P., C.B.W., X.Z., M.L., N.S., M.M., S.G., C.L.K., R.L.T., T.M., Y.H., and F.O. performed se-quencing. D.S., D.K., J.H.M., and C.G.A. managed data deposition. J.Q., H.J., and K.C.W. performed genome assembly. A.K., D.C.P., Z.C., D.S., B.O., Y.A.K., E.C., T.M.P., and J.A. performed phyloge-netic analysis. Z.C., D.S., and B.O. performed RNA-seq analysis. Z.C., D.S., M.O.D., and B.R.G. analyzed RNA editing. S.C., J.B.B., N.B., P.J.B., R.H., S.P., G.R., P.C., A.M.S., Z.C., D.S., A.R.F., and J.M. performed promoter analysis and CAGE experiments. P.C., R.W., P.J.B., K.K., D.H.F., P.W.S., A.C., M.K., M.B.E., and B.O. conceived the project. R.A.G., D.M.M., S.E.S., S.R., B.R.G., S.E.C., R.H., and B.O. managed the project. Z.C., D.S., S.R., A.K., D.C.P., and B.O. wrote the manuscript.
References
Adams MD, Celniker SE, Holt RA, Evans CA, Gocayne JD, Amanatides PG, Scherer SE, Li PW, Hoskins RA, Galle RF, et al. 2000. The genome sequence of Drosophila melanogaster. Science 287: 2185–2195. Andrews J, Bouffard GG, Cheadle C, Lu J, Becker KG, Oliver B. 2000. Gene
discovery using computational and microarray analysis of transcription in the Drosophila melanogaster testis. Genome Res 10: 2030–2043.