Publisher’s version / Version de l'éditeur:
Journal of Materials, 3, 3, pp. 658-671, 1968-09-01
READ THESE TERMS AND CONDITIONS CAREFULLY BEFORE USING THIS WEBSITE.
https://nrc-publications.canada.ca/eng/copyright
Vous avez des questions? Nous pouvons vous aider. Pour communiquer directement avec un auteur, consultez la première page de la revue dans laquelle son article a été publié afin de trouver ses coordonnées. Si vous n’arrivez pas à les repérer, communiquez avec nous à PublicationsArchive-ArchivesPublications@nrc-cnrc.gc.ca.
Questions? Contact the NRC Publications Archive team at
PublicationsArchive-ArchivesPublications@nrc-cnrc.gc.ca. If you wish to email the authors directly, please see the first page of the publication for their contact information.
NRC Publications Archive
Archives des publications du CNRC
This publication could be one of several versions: author’s original, accepted manuscript or the publisher’s version. / La version de cette publication peut être l’une des suivantes : la version prépublication de l’auteur, la version acceptée du manuscrit ou la version de l’éditeur.
Access and use of this website and the material on it are subject to the Terms and Conditions set forth at
Moisture content and freeze-thaw cycles of masonry materials
Ritchie, T.; Davison, J. I.
https://publications-cnrc.canada.ca/fra/droits
L’accès à ce site Web et l’utilisation de son contenu sont assujettis aux conditions présentées dans le site
LISEZ CES CONDITIONS ATTENTIVEMENT AVANT D’UTILISER CE SITE WEB.
NRC Publications Record / Notice d'Archives des publications de CNRC:
https://nrc-publications.canada.ca/eng/view/object/?id=60389cba-8efd-495f-bf21-02706b1451c8 https://publications-cnrc.canada.ca/fra/voir/objet/?id=60389cba-8efd-495f-bf21-02706b1451c8T . Ritchiel and J . I . Davison2
ANALYZED
Moisture Content and Freeze-Thaw
Cycles of Masonry Materials
REFERENCE: Ritchie, T . and Davison, J. I., "Moisture Content and Freeze-Thaw Cycles of Masonry Materials," Jourr~al of Materials,
JMLSA, Vol. 3, No. 3. Sept. 1968, pp. 658-671.
ABSTRACT: Changes in the moisture content and temperature of masonry materials exposed to the weather at two locations for two years depended on several factors. The moisture content was influenced mainly by the nature of the material exposed, its geographical location and direction of exposure, and the season of the year. The temperature also depended on geographical location and direction of exposure and o n daily and seasonal changes in air temperature. The number of freeze- thaw cycles experienced by the samples was considerably influenced by the direction of exposure as well as by geographical location. The rate of freezing of the exposed samples and the moisture content when frozen-two factors important to durability-differed considerably from the freezing rate and moisture content used in a standard test for brick durability. The results of the exposure tests suggest that more realistic conditions should be used in laboratory freeze-thaw testing.
KEY WORDS: testing, masonry, bricks, mortars, stones, moisture, rain, temperature, freezing, durability, evaluation
The possibility of masonry materials being damaged from freezing has concerned builders from an early age to the present and has prompted many attempts to devise tests for durability. The Roman architect Vitruvius required stone to be quarried two years before the building was started and left exposed in an open place. If it was un- damaged after the two years, it was considered to be durable. As such a time-consuming test is unacceptable today, artificial weathering is employed to accelerate decay. The material is wetted to an arbitrary high degree, then alternately frozen and thawed a number of times at a rapid rate; cracking of the material, or loss of weight, or a change in some other property indicates a lack of durability. I n the test for
'
Research officer, Inorganic Materials Section, Division of Building Research, National Research Council of Canada, Ottawa, Ont., Canada.' Research officer, Atlantic Regional Station, Division of Building Research, National Research Council of Canada, Halifax, N.S., Canada.
RlTCHlE A N D DAVISON O N MASONRY MATERIALS 6 5 9
clay bricks (ASTM Methods of Sampling and Testing Brick, C 67-66), samples are soaked in water and then frozen and thawed; excessive loss of weight after 50 such cycles indicates lack of durability.
A report prepared in 19383 showed that the moisture content at the time of freezing was an important factor in the durability of stone, brick, and tile; the higher the moisture content, the more liable were these materials to damage by freezing. Recent experiments' with port- land cement mortar have also shown that its susceptibility to frost damage was greatly dependent on its moisture content. In the earlier the rate of freezing and thawing was indicated to be an important factor in the durability of the materials, while a more recent study of the frost resistance of concretei has indicated that permeability, elas- ticity, and tensile strength are additional important durability factors.
If the conditions of test are sufficiently severe, practically any wet masonry material may be damaged from freezing and thawing. In spite of the importance of moisture content and rate of freezing, however, little information has been published on these properties in the masonry of actual buildings. U p to the present time there has been available no sound basis on which an artificial durability test for masonry mate- rials could be devised. Arbitrary test conditions unrelated to field condi- tions make it impossible to correlate the durability of a material indi- cated by such tests and its performance in service in the wall of a building.
Purpose
The purpose of this study was to obtain information on the moisture content of masonry materials exposed to the weather, such as they would be in the walls of a building, and to obtain corresponding infor- mation on the rate of freezing and thawing. F o r this purpose, samples were exposed at two widely separated places-Ottawa, Ont. and Hali- fax, N.S.-which enjoy different weather conditions. At both locations, samples of masonry materials were exposed to each of the four cardinal points to assess the directional effect on wetting and freezing. A com- parison was also made of the amount of rain absorbed by a material with the amount that fell on its surface, the latter being measured by a rain-collecting cup whose open face was in the same plane as that of the sample and of the same dimensions.
Thomas, W. N., "Experiments on the Freezing of Certain Building Materials," Technical Paper 17, Department of Scientific and Industrial Research, London,
1938.
'
MacInnis, C. and Beaudoin, J. I., "Effect of Degree of Saturation on the Frost Resistance of Mortar Mixes," Jourr~al o f the Atnericarz Cotzcrete Institute, Proceerlings, Vol. 65, No. 3, March 1968, pp. 203-207.'
Verbeck, G. and Landgren, R., "Influence of Physical Characteristics of Aggregates on Frost Resistance of Concrete," Proceedings, American Society for Testing Materials, Vol. 60, 1960, pp. 1063-1079.660 JOURNAL OF MATERIALS
Method and Materials
The materials studied-four clay bricks, one concrete brick, a sand- stone, and three mortars (the last four materials in the shape of a brick)-were mounted in a four-directional rack and arranged so that one vertical surface of the sample was exposed to the weather. The remaining surfaces were sealed by a polysulfide material, except for the surface opposite the exposed face which was shielded from rain but not sealed. The samples, arranged for easy removal from the rack, were weighed at frequent intervals to determine changes in moisture content, calculated as the difference between the original dry weight before exposure and the subsequent weight. Additional samples, fitted with thermocouples cemented in holes drilled into them and connected to a temperature-recording apparatus, were exposed on the racks for measurement of freezing and thawing.
T A B L E I-Water absorption properties. Water Absorption b y Immersion,
per cent of d r y weighta Material 24 FI 5-H Boil Clay Brick: A . . . l . 5 t o 2 . 2 3 . 0 t o 3 . 6 B . . . 6 . 3 t o 6 . 8 8 . 4 to 9 . 0 C . . . 7 . 4 t o 8 . 0 9 . 3 t o '3.9 D . . . 1 8 . 6 t o 1 9 . 3 2 1 . 7 t o 2 2 . 5 Concrete Brick: E . . . . . 2 . 7 t o 2 . 9 not determined Sandstone: F . . . 3 . 9 t o 4 . 0 5 . 9 t o 6 . 1 Mortar: Gb. . . . 9 . 4 t o 9 . 7 not deternmincd Hc. . . 1 1 . 1 t o 1 1 . 5 not deterrnincd J d . . . . . 1 2 . 4 t o 1 2 . 7 not determined
a Range of samples used for exposure.
*
hlasonry cement and sand ; volume proportions 1 : 3. Portland cement, lime, a n d s a n d ; volume proportions 1 : 1 : 6. Portland cement, lime, and s a n d ; volume proportioris 1 : 2 : 9.Eight samples of each material required for study of change in mois- ture content (exposed at two locations and to each of the four direc- tions) were selected from a large number of samples to be within a narrow range of absorption properties (Table 1 ).
The clay bricks varied from a dense unit, low in water absorption, to a very porous unit, high in absorption. The rate of water absorption similarly varied over a wide range. The concrete brick and the sandstone had relatively low values of water absorption. The three mortar sam-
RlTCHlE A N D D A V l S O N O N M A S O N R Y MATERIALS 661
ples-one of masonry cement and sand, the other two of portland cement, lime, and sand in different proportions of cement and lime- varied over a wide range in water absorption values.
Factors Affecting Moisture Content
Although the levels of moisture in the samples occasionally fluctuated in a short time over a wide range due to heavy wetting and rapid drying, it was evident that the moisture content was influenced by sev- eral factors. Of these factors, the geographical location, the particular material exposed, the direction of exposure, and the season of the year were important.
Directional and Seasonal Effect
The pronounced directional effect on moisture content is shown by the graphs of Figs. 1 and 2, in which the moisture content of Brick D (Table 1 ) is plotted for the four directions at Halifax and Ottawa. The moisture content is expressed in these graphs (and elsewhere in this study) as a percentage of the moisture the material was capable of absorbing when totally immersed for 24 h. It is evident in Figs. 1 and 2 that at both Halifax and Ottawa there was a wide difference in the moisture content of the samples facing the different directions. The sample facing east at both Halifax and Ottawa was generally high- est in moisture content of the four samples. The lowest moisture content was found in the sample facing north at Halifax and south at Ottawa; the degree of wetness varied greatly between the samples of lowest and highest moisture content at both places, but the difference was particularly marked at Ottawa.
Figures 1 and 2 also demonstrate the pronounced seasonal effect on moisture content. The level of moisture increased in the fall to a relatively high value, which was sustained during the cold season and then decreased to a considerably lower value in the summer. Al- though Figs. 1 and 2 show moisture content for the first winter and the early part of the next summer, a similar seasonal pattern of increas- ing then decreasing moisture content occurred in the second year of exposure. Studies of the loss of weight of the samples after being wetted by rain showed that the rate of drying was much faster in the summer than in the cold season.
Influence of Geographical Location
The moisture content of samples exposed at Halifax was generally higher than that of the corresponding samples at Ottawa (Figs. 1 and 2 ) . This reflects the difference in rainfall at the two locations, which in the period of time covered by Figs. 1 and 2 was 23.8 in. at Halifax and 13.7 in. at Ottawa.
RlTCHlE A N D DAVISON O N MASONRY MATERIALS 663
0 0 0 0 0 0
0' CO CD
*
CUu o ! s ~ ~ u u l
~ y b;! u ! a l d u l o s h q p a q l o s q v
alnls!oW
40
l u a 3 l a d
-
i u a i u o 3 a l n i s ! o W
664 JOURNAL O F MATERIALS
Influence of Material on Moisture Content
The nine materials that faced the same direction and were subjected to the same conditions of wetting did not attain the same level of moisture. The moisture content in general was greater for samples of greater water absorption, and there was frequently a wide variation in moisture content, for example, the samples facing east at Halifax in December 1963 and January 1964 (Fig. 3 ) . Similar wide variation occurred at Ottawa; some of the materials had been more readily wetted and had attained a much higher level of moisture than others.
One of the four clay bricks (Brick A, of Table 1 and Fig. 3 ) re- mained at a consistently low moisture content. The moisture content of the other clay bricks was relatively high, as it increased with increas- ing water absorption, but not proportionally. Similarly, the moisture content of the mortar samples increased as the water absorption in- creased. The moisture content of the concrete brick and of the sand- stone was higher than that of clay Brick A but lower than that of the other samples.
Rainfall and Moisture Content
Comparisons made of the amount of rain caught in the rain-cup and that absorbed by samples facing the same direction as the rain-cup showed that the former amount was always greater than the latter. In a few instances, the difference was not great, as when a highly absorptive material in a nearly dry condition was able to absorb almost the equivalent amount of water collected in the cup. The rate of water absorption of a material, the amount of moisture in it at the start of the rainfall, and the rate at which rain drops were supplied to its surface undoubtedly determined the proportion of water absorbed by the sample and the proportion drained off its surface before it could be absorbed.
Freezing
A brick with a thermocouple in the center was exposed to each of the four directions at Halifax and Ottawa. The continuous recordings of temperature thus obtained indicated seasonal and directional influ- ences on temperature, as well as an influence due to geographical location.
The seasonal and directional effects are illustrated in Fig. 4, which compares the temperatures of bricks facing the four directions at Ottawa on typical summer and winter days. The level of temperature is, of course, much higher during the summer, but a similar directional effect is evident in that as the morning sun falls on the brick facing east its temperature rises, followed by a rise in temperature of the brick
RITCHIE AND DAVISON O N MASONRY MATERIALS 665
a y B r i c k s ; A , B , C , D C o n c r e t e B r i c k ; E
December
January
1963
1964
FIG. 3-Variatio,~ in ,noistiire content of materials at Halifax facing east.
facing south. Late in the day the brick facing west starts to be affected by the sun; the temperature of the brick facing north, however, remains close to air temperature. Figure 4 shows that on the winter day the temperature of the brick facing south, but not that of the others, rose above the freezing point and later descended below it; thus, the brick
RlTCHlE A N D DAVISON ON MASONRY MATERIALS 667
facing south experienced a thawing and a freezing not experienced by the others.
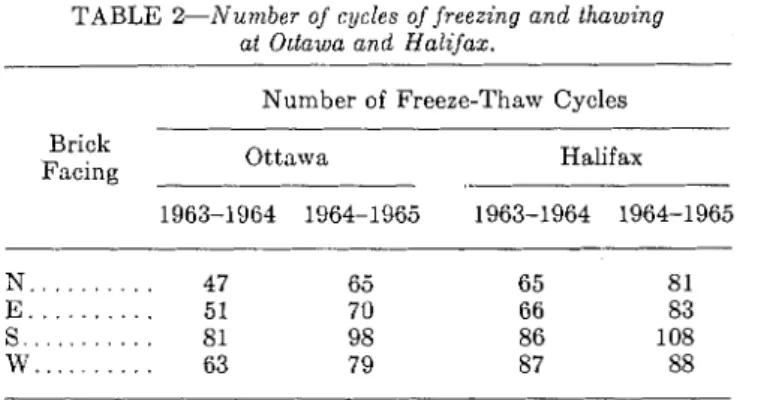
The temperature change of a brick, from above the freezing point to below it and a return to above-freezing temperature, was considered to constitute one cycle of freezing and thawing. The number of such cycles in relation to the direction of exposure at Ottawa and Halifax was determined from the temperature records. Table 2 illustrates that
TABLE 2-~Vuiiaber of cycles of freezing and thawing at Ottawa and Halifax.
Number of Freeze-Thaw Cycles Brick
Facing Ottawa Halifax
there was a considerable directional influence on the number of freeze- thaw cycles; at Ottawa in the winter of 1963-1964, for example, the brick facing south experienced almost twice as many cycles as that facing north. The bricks at Halifax consistently underwent a greater number of freeze-thaw cycles than those at Ottawa, and at both places there was a significant diffelence in the number of cycles from the one cold season to the next.
In addition to giving the number of freeze-thaw cycles, the charts of temperature change also provided information on the rate of freezing, which was determined by noting on the chart the time at which the brick's temperature reached 32 F and then noting its temperature 1/2 h before and after. The difference in these temperatures was taken as the rate of freezing in degrees per hour. The cooling of the brick usually took place gradually, about 2 or 3 deg/h; the maximum rate measured was 10 deg/h.
The freeze-thaw cycles of Table 2 refer to a dense brick with the thermocouple at its center. Other experiments showed that locating the thermocouple elsewhere affected the temperature changes and the number of cycles; when the thermocouple was placed nearer to the exposed surface a greater number of freeze-thaw cycles resulted, whereas the number was reduced when the thermocouple was placed nearer to the back surface. A change in the nature of the brick affected the number of cycles; a more porous brick was less responsive to change in air temperature and to the effects of the sun's heat, and, therefore,
668 JOURNAL OF MATERIALS
such a brick underwent fewer cycles of freezing and thawing than did the dense brick.
Moisture Content of Materials When Frozen
Since, as previous studies3," have indicated, the extent of damage caused by freezing probably depends greatly on the amount of moisture in a material when it is frozen, the records of moisture content and temperature were studied to determine the moisture content of the various materials throughout that part of the year when the samples were liable to be frozen. The period of time between the first and
TABLE 3-Maximum moisture conter~t of the ?nalerials during the freezing season.
Materiala Whose Moisture Contentb During the Freezing Location Season 1963-1964 Was in the Itange Indicated and Direction
Under 80 80 to 89 90 to 99 100 and Over Halifax: North.. . . A, D, E , H, F E a s t . . . . . A, E South.. . . A, E , F West.. . . A, E , F, G Ottawa: North.. . . A, E E a s t . . . . . A, E South.. . . A to H, J West.. . . A to H, J F F none none C, D, G, I1 C, D, G, I-I, J none none B C, D, J none none B, J B none none Materials: A, B, C, D = clay bricks. E = concrete brick. F = sandstone. G, H, J = mortars.
V e r cent of moisture absorbed by 24-h immersion.
the last freezing of the seasons 1963-1964 and 1964-1965 lasted, respectively, 168 and 194 days at Halifax and 165 and 201 days at Ottawa. The results for the first cold season are given in Table 3, where the various materials are classified with respect to certain ranges of moisture content. Since the critical moisture content, that below which a material is not likely to be damaged by freezing, is probably about 80 per cent of the amount of water absorbed by 24-h immersion, the ranges of moisture content chosen were below 80 per cent and in increments of 1 0 per cent above this figure. The results for the second cold season were generally similar to those of the first.
The information presented in Table 3 relates to the maximum mois- ture content of the materials during the cold season. The level of mois- ture was usually considerably less than the maximum, as shown in
RlTCHlE A N D D A V I S O N O N M A S O N R Y MATERIALS 669
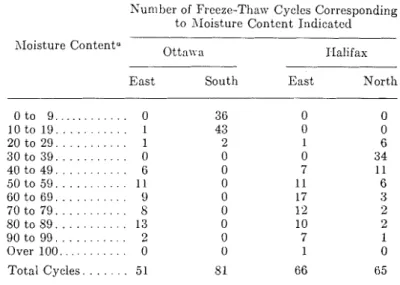
Table 4, which presents a more detailed study of the relation between moisture content and freezing. In Table 4 the number of freeze-thaw cycles of one of the sanlples (Brick C) is given with the corresponding moisture content of the sample when frozen, for the directions of ex- posure of generally highest moisture content (east at both Halifax and Ottawa) and of generally lowest nloisture content (south at Ottawa and north at Halifax). A t Ottawa few of the freezings of the brick facing east took place when the sample was low in moisture content, whereas the reverse held for the brick facing south. Sinlilar directional
TABLE 4-Freeze-thaz~. cycles o,f Brick C corresponding lo ils ~ > l o i s t t ~ r e conier~l when Jrozen; season 1963-1964.
Kuniber of Freezr-Thaw Cycles Corresponding to hIoisture Content Indicated
East South East North
Oto 9 . . . 0 1 0 t o 1 9 . . . 1 20 to 2 9 . . . . . 1 . . . 30 to 3 9 . . 0 40 to 4 9 . . . . 0 50 to 59. . . 11 00 to 6 9 . . . . . 9 70 to 7 9 . . . . . S . . . 8 0 t o 8 9 13 90 to 9 9 . . . . . 2 Over 100.. . . 0 Total Cycles. . . 51
a Per cent of moisture absorbed by 24-11 im~nersion.
effects, though not as pronounced, were noted for the samples at Halifax.
It is evident from Table 3 that the degree of wetness varied greatly; some of the materials remained at a relatively low moisture content throughout the cold season while others were at a much higher level. At both Halifax and Ottawa, for example, clay Brick A and concrete Brick E were in the lowest moisture classification regardless of direction of exposure. There was, however, a strong directional influence on wetting. This was especially evident at Ottawa, where none of the mate- rials facing south and west had moisture contents exceeding 80 per cent of the moisture content attained on 24-h immersion in water. All samples facing in the other directions, however, except the two bricks mentioned, exceeded 80 per cent moisture content during the freezing season.
670 JOURNAL OF MATERIALS
Conditions of Artificial Durability Tests
I n the freezing and thawing test for clay brick ( A S T M Methods C 6 7 ) , the rate of freezing is not specified. T h e temperature of the bricks t o be tested must not exceed 9 0 F when they are placed in the freezing chamber, and the heat-removal capacity of the chamber must be sufficient for its air temperature not to exceed 1 6 F 1 h after the bricks have been placed in the chamber. Bricks for test may be prepared in two ways, either by soaking them for 4 8 h prior to the first freezing (Method A ) o r by soaking them for 4 h prior to the first freezing (Method B ) . I n both cases, the wet bricks are frozen while standing on edge in a tray of water and subsequently are thawed by complete immersion in water.
A number of materials fitted with a thermocouple at the central point were frozen and thawed under the A S T M conditions of test (fol- lowing Method B for wetting prior to freezing). T h e rate of freezing (determined in the same way as that described previously for the ex- posed samples) varied from 1 0 to 2 0 F/h. If the size of charge to the freezer were smaller and the initial temperature of the bricks lower than was the case, the rate of freezing would have been much higher. T h e water absorbed in the 4-h soaking of the samples prior t o their first freezing combined with the water subsequently absorbed when the brick was thawed in water and resulted in a high moisture level, which after a few cycles exceeded 100 per cent of the water that would have been absorbed in 24-h immersion. By this test method, therefore, the samples are at a relatively high moisture content when frozen, and the rate of freezing is also relatively high compared with the samples subjected to "natural" exposure.
Conclusions
T h e moisture content of masonry materials exposed at two different locations varied greatly depending o n the geographical location of ex- posure, the nature of the material exposed, the direction of exposure, and the season of the year. T h e maximum moisture content of the materials attained on exposure was related to the amount of water absorbed by 24-h immersion, but only a part of the rain that fell on the vertical face of a material was absorbed by it.
T h e temperature of the masonry materials was influenced by geo- graphical location and daily and seasonal changes in air temperature. T h e sun exerted a strong directional effect on temperature. T h e number of cycles of freezing and thawing, determined from the temperature records of exposed samples, depended on geographical location and direction of exposure and on the material exposed. I n the cold season of the year, when the samples were liable to be frozen, the moisture
RlTCHlE A N D DAVISON ON MASONRY MATERIALS 671
content of the materials varied greatly, depending on the nature of the material, the geographical location, and the direction of exposure.
The freezing conditions of the exposed samples differed considerably from those of samples subjected to freezing and thawing by the ASTM method of test for durability of bricks. The rate of freezing was appre- ciably slower on natural exposure and the moisture content was much lower, both of which are factors indicated elsewhere to have an impor- tant influence on durability.
Although further study is needed of the conditions of freezing of masonry materials when in service in walls, the results of this work suggest that a more realistic basis for freeze-thaw tests of bricks than is now used should be established. The rate of freezing should be speci- fied and should not exceed 10 F/h; the moisture content of the brick when frozen should not exceed the amount obtained by 24-h immersion; and the number of freezings should be 100 for each year of intended exposure of the brick in service in the wall of a building. The prac- ticability of such a procedure depends of course on the length of time required for the test; if it is possible to cycle the temperature of test bricks from a few degrees above the freezing point to a few degrees below, not exceeding the rate of 1 0 dcg/h, one such cycle could be completed in 2 h, 12 cycles in a day, and 100 cycles (corresponding to a year of service) in 9 days.
Acknowledgment
This paper is a contribution from the Division of Building Research, National Research Council of Canada, and is published with the ap- proval of the Director of the Division.