HAL Id: hal-00907781
https://hal.inria.fr/hal-00907781
Submitted on 21 Nov 2013
HAL is a multi-disciplinary open access
archive for the deposit and dissemination of
sci-entific research documents, whether they are
pub-lished or not. The documents may come from
teaching and research institutions in France or
abroad, or from public or private research centers.
L’archive ouverte pluridisciplinaire HAL, est
destinée au dépôt et à la diffusion de documents
scientifiques de niveau recherche, publiés ou non,
émanant des établissements d’enseignement et de
recherche français ou étrangers, des laboratoires
publics ou privés.
Optimizing P300-speller sequences by RIP-ping groups
apart
Eoin M. Thomas, Maureen Clerc, Alexandra Carpentier, Emmanuel Daucé,
Dieter Devlaminck, Rémi Munos
To cite this version:
Eoin M. Thomas, Maureen Clerc, Alexandra Carpentier, Emmanuel Daucé, Dieter Devlaminck, et
al.. Optimizing P300-speller sequences by RIP-ping groups apart. IEEE/EMBS 6th international
conference on neural engineering (2013), IEEE/EMBS, Nov 2013, San Diego, United States.
�hal-00907781�
Optimizing P300-speller sequences by RIP-ping groups apart
Eoin Thomas
1,2, Maureen Clerc*
,2, Alexandra Carpentier
1, Emmanuel Dauc´e
3,4, Dieter Devlaminck
2, R´emi Munos
1Abstract—So far P300-speller design has put very little empha-sis on the design of optimized flash patterns, a surprising fact given the importance of the sequence of flashes on the selection outcome. Previous work in this domain has consisted in studying consecutive flashes, to prevent the same letter or its neighbors from flashing consecutively. To this effect, the flashing letters form more random groups than the original row-column sequences for the P300 paradigm, but the groups remain fixed across repetitions. This has several important consequences, among which a lack of discrepancy between the scores of the different letters. The new approach proposed in this paper accumulates evidence for individual elements, and optimizes the sequences by relaxing the constraint that letters should belong to fixed groups across repetitions. The method is inspired by the theory of Restricted Isometry Property matrices in Compressed Sensing, and it can be applied to any display grid size, and for any target flash frequency. This leads to P300 sequences which are shown here to perform significantly better than the state of the art, in simulations and online tests.
I. INTRODUCTION
The P300 speller is an assistive device based on electroen-cephalography (EEG) signals which allows a user to select letters from a visual display [1]. It is based on the well known P300 wave which is elicited by the expectation of a stimulus. In order to spell letters, groups of letters are flashed on-screen and pattern recognition algorithms are used to detect whether a P300 wave occurs, which indicates that the target letter was part of the flashed group. Under this paradigm, multiple flashes of the target letter are required in order to spell accurately.
Much current research on P300-speller design is dedicated to the visual presentation of stimuli, with the aim to improve the signal-to-noise ratio of the P300. Such studies have dealt with randomizing inter-stimulus interval [2], studying the im-pact of the visual appearance of the display [3], and changing background image during the flashing [4]. Reducing the occur-rence of letters that flash consecutively, or whose close neigh-bors flash consecutively, was the motivation for Townsend et al. to propose the checkerboard flashing paradigm [5].
Another important opportunity for improving the P300 throughput is to improve the discriminability between the different letters. To this effect, Perrin and coworkers have designed novel stimulation paradigms in which the group to which a letter belongs varies at each series of flash repetitions [6]. This requires the individualization of P300 occurrence
* Contact [email protected]
1
Sequel Project-Team, INRIA Lille Nord Europe, France
2
Athena Project-Team, INRIA Sophia Antipolis - M´editerran´ee , France
3
Ecole Centrale de Marseille, 38 Rue Fr´ed´eric Joliot Curie 13013 Mar-seille, France
4
INSERM, UMR 1106 ”Institut de Neurosciences des Systemes”, Facult´e de M´edecine, 27, Boulevard Jean Moulin - 13005 Marseille, France
statistics at the level of letters instead of groups, and has the important side-benefit of allowing optimal stopping pro-cedure when the system has reached a reliable decision [7]. The above-mentioned seminal work paves the way to further improvements of the P300 sequence presentation. However, one issue is that the size of the groups of letters flashed is tied to the number of elements available for selection.
Taking the classical 6 by 6 display grid as an example, row-column flashing results in groups of 6 letters and an average target flash rate of 1/6. However, there are issues with row-column flashing in the case of small display grids (target flash rate may be too high), large display grids (target flash rate may be too low) and non-square matrices where rows and columns will have different sizes and may even have empty elements. Large display matrices in particular are appealing as they allow the user to select from a large set of characters and symbols, which significantly boosts the bit-rate of the speller and allows for faster and more diverse communication. Large display grids have been investigated by [5], [8] and [9], however the sequences employed for flashing the elements are not optimised for faster search of the target letter.
In this paper, we present a method for generating the groups of flashed letters that improves the speed and reliability of the P300 speller. We optimize the letter presentation by using matrices that satisfy a kind of Restricted Isometry Property (RIP), guaranteeing minimal intersection between the groups of letters to be flashed within a repetition. This article first describes the theory of the P300 speller for letter selection in section II, we then use simulations to compare different approaches to flashing sequences in section III, and results are validated with online tests on two subjects in section IV.
II. AN ELEMENT LEVEL DESCRIPTION OF THEP300
SPELLER
There are two automated stages to letter selection in the P300 speller. The first is the detection of the P300, while the second is the accumulation of evidence concerning all the letters.
A. P300 detection
P300 detection is performed by analysing the EEG. After some preprocessing, an epoch of EEG is represented as a concatenation of time samples (locked to the stimulus) over several channels. This representation defines a feature vector x(t) for each stimulus presentation, i.e. every flash, indexed in time by t. Typically, classification is performed by some linear classifier which can be described by a weight vector ω.
The P300 detection problem is solved as follows: ˆ
y(t) = ω⊤x(t) (1) Thus, for each flash t, we have an estimate ˆy(t) of y(t) which indicates whether a P300 wave occurred or not. For the purpose of this study, y(t) shall be binarized, and givenˆ the value 0 if no P300 was detected and 1 if a P300 was detected.
B. Letter selection
In the second stage, the speller accumulates the evidence. At each stimulation, only n elements are flashed, i.e. a subset of the N elements in the display grid. For each flash, the letters flashed are indexed by a(t), a binary vector of size N containingn non-zero elements. Based on this, the letters can be scored at each flash according to:
α(t) = α(t − 1) + a(t)⊤y(t) ,ˆ (2) where α(t) is a score vector of size N , which represents how many times a P300 wave was detected when the letter was flashed. All elements of α(t) are initialized to 0 at t = 0. In a typical experiment, the number of flashes is set to T , and the element ˆk is selected that maximizes the accumulated evidence: ˆ k = argmax k (α(T )) (3) C. Early stopping
For the discrete α(t) used here, a simple early stopping rule can be used: the accumulation process is stopped if the most likely element has a score greater or equal than the next most likely plus a constant bes. The term bes can be
modified to set the speed of letter selection. Generally, for the interface described in this article, a value of 1 for bes
resulted in premature stopping with many errors, and a value of 3 resulted in accurate but slow letter selection, as such bes
is given a value of 2 in all tests here. D. Optimising the sequences
The standard method of flashing the elements on-screen is to flash individual rows and columns alternatively. The target letter is then found by determining which row and which column are associated with the most P300 detections. Thus, a key aspect of the methodology in row-column flashing is the reliance on sets which only share a single element between them, i.e. any row intersects any column at only one element, and no elements are repeated among different rows.
There are issues with row-column, namely the number of double flashes and adjacent distractors which it produces. A simple solution which minimises adjacent distractors was proposed by Cecotti and Rivet [10], in which the rows and columns of a ”logical” matrix are randomised and appear on a “physical” matrix. This results in groups which appear random on screen, but retain the properties of rows and columns. This idea was further developed by Perrin et al [7], to create dynamic random stimulation (DRS) sequences in which the
randomisation from logical to physical matrix is changed after each repetition of all the rows and columns.
The benefits of DRS sequences are important, and currently represent the state of the art. However, as they are based on the rows and columns of a “logical” matrix of the same size as the display matrix, the target flash rate is tied to the size of the display grid. This can be problematic when the display matrix is small, overly large or simply non-square. Thus, we propose a method similar to DRS, however rather than employ a logical matrix, a template repetition is generated which gives the experimenter more control over the properties of the sequences.
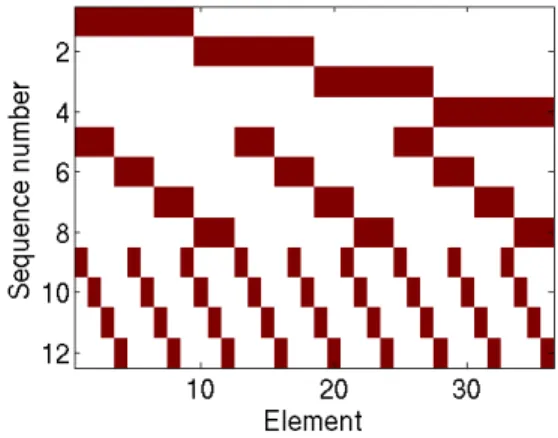
The template is generated by an algorithm inspired by the restricted isometry property (RIP) used in the field of compressed sensing. Effectively, this means that sequences will share as few elements as possible among each other across a repetition. The algorithm which creates the template repetition is based on calculating the size of contiguous groups of elements which are flashed together. In Figure 1 a template repetition is shown. The algorithm iteratively creates each se-quence by first flashing contiguous groups of sizeceil(N ∗fr) whereN is the number of elements (36 in the example) and f r is the target flashrate (1/4 in this example). For the next sequences, sets which have the lowest possible RIP constant with respect to the previous sequences are generated. This is done by creating multiple smaller contiguous groups of size (ceil(ceil(N ∗ fr) ∗ fr). Thus, after each 1/fr sequences, a new set is created based on smaller contiguous groups, until all elements have a unique encoding in time.
Fig. 1. Element level representation of flashed elements, red indicates flashed elements. A 1 in 4 template for a 36 element grid is used as an example here. Note that one repetition requires 12 sequences, and there are no double flashes present in this template.
Henceforth, the described method for generating sequences is referred to as RIPRAND, as it is based on randomising RIP-based templates. Note that RIPRAND is equivalent to DRS if the group size is set to the square root of the number of elements in the display grid. In this article, we will compare these sequences to the basic row-column sequences, to randomly generated sequences (RAND) and to sequences generated via a RIP template, but utilising a fixed permutation over all repetitions, which will be referred to as RIP.
III. SIMULATION RESULTS
The aim of this study is to investigate the impact of using different flashing sequences. From equation 2 it can be seen that the scores accumulate at each flash based on the vector a(t) and the classifier output ˆy(t). As such, different sequence matrices A containing the a(t) over all flashes can be used with a simulated classifier output.
The simulated classifier output is as such: ifa˚k(t) = 1 then P (ˆy(t) = 1) = .6 ,
ifa˚k(t) = 0 then P (ˆy(t) = 0) = .9 .
Where ˚k is the index of the target element. These detection rates were obtained based on the results of single trial classi-fication of the P300 waves on data from 21 healthy subjects. The classification pipeline consisted of the XDAWN spatial filter [11] and a linear classifier. The simulated classifier can thus be considered as an average-performing P300 detection algorithm applied to an average subject, which is reflected by the relatively low true positive detection rate of 0.6.
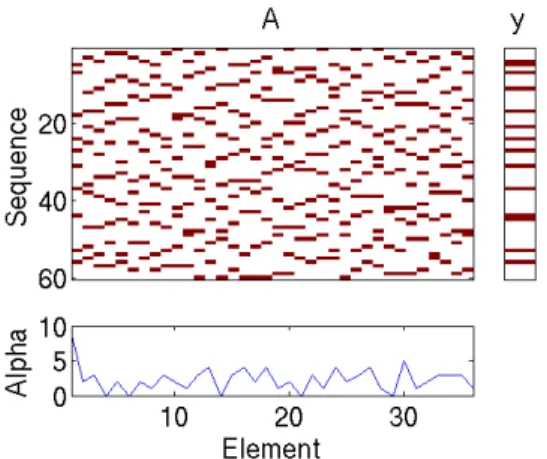
The simulated results are thus achieved by simulating the decisions of a classifier while using different flashing se-quences. A graphical example of the simulation can be seen in Figure 2. All the results in this section are reported on 1000 simulated letters per experiment. One aspect of the speller which is not reflected in the simulation is the modulation of the P300 based on different flashing procedures, i.e. in realistic conditions, yt will be affected by the change in frequency of
the target, by adjacent distractors and by double flashes.
Fig. 2. An example of accumulation based on 36 elements over 60 flashes, with element 1 as target. Each row of A represents the elements flashed in red, note that 6 elements are flashed at a time. The simulated classifier output is labelled as y, based on the rule given in Section III. The scores of the elements after 60 flashes are given by Alpha, note that the target (element 1) obtains a higher score than other elements after 60 flashes.
A. Performance as a function of flashes
The performance of the P300 speller can be given as the letter accuracy (percentage of target letters correctly identified) as a function of the number of flashes. In Figure 3, different types of sequences are contrasted based on a 36 element display grid. Note that row-column and RIP-based flashing have similar performance, whereas random groups and in particular RIPRAND-based flashing lead to improvements in
accuracy for any given number of flashes. In this example, RIPRAND is equivalent to DRS.
Fig. 3. Simulation results for a 36 element display grid.
In Figure 4 a similar plot is shown, but for a 64 element grid. In this case, the full benefits of RIPRAND can be seen. A 64 element grid represents an 8x8 display, as such standard row-column flashing will result in a target flashrate of 1/8, as will any sequence based on randomised row-column such as the state of the art DRS, emulated here by RIPRAND 1/8. In this example, it can be seen that RIPRAND 1/6 improves over the current state of the art DRS (equivalent to RIPRAND 1/8 results).
Fig. 4. Simulation results for a 64 element display grid.
B. Performance with early stopping
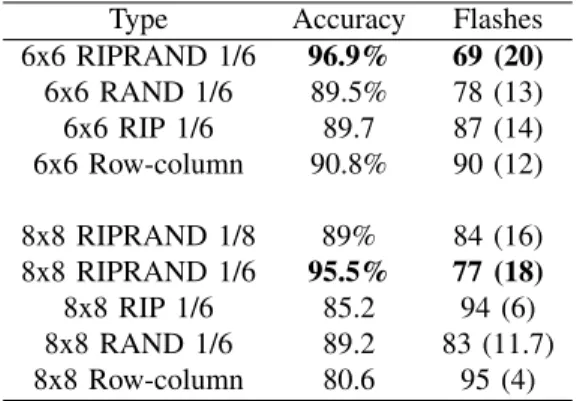
The most relevant result is the performance of the algorithm when combined with early stopping. These results can be found in Table I, where the performance benefits of RIPRAND are even clearer. Indeed, RIPRAND 1/6 is particularly effective both for a 6x6 display and an 8x8 display. Note that RIPRAND sequences result in a simpler early stopping rule as compared to the RAND sequences in which elements are flashed un-evenly. This leads to a greater improvement in performance than expected from Figures 3 and 4.
IV. ONLINE RESULTS
The methods proposed in this article were tested online in a proof of concept experiment with 2 subjects. Both subjects
TABLE I
LETTER ACCURACY AND NUMBER OF FLASHES REQUIRED WITH EARLY STOPPING. THE FIRST4ENTRIES ARE FOR A6X6DISPLAY GRID,WHILE THE FINAL5ARE FOR AN8X8DISPLAY GRID. THE STANDARD DEVIATION
OF THE FLASHES IS GIVEN IN PARENTHESES.
Type Accuracy Flashes 6x6 RIPRAND 1/6 96.9% 69 (20) 6x6 RAND 1/6 89.5% 78 (13) 6x6 RIP 1/6 89.7 87 (14) 6x6 Row-column 90.8% 90 (12) 8x8 RIPRAND 1/8 89% 84 (16) 8x8 RIPRAND 1/6 95.5% 77 (18) 8x8 RIP 1/6 85.2 94 (6) 8x8 RAND 1/6 89.2 83 (11.7) 8x8 Row-column 80.6 95 (4)
had previous experience with the P300 speller. A set of 13 electrodes was used (Fz, C3, Cz, C4, P7, P3, Pz, P4, P8, POz, O1, Oz and O2). The EEG was filtered with a 4th order Butter-worth bandpass filter between 1 and 15Hz and downsampled from 256 to 64Hz. Following each flash, an epoch of 0.6s of EEG was used for classification. The XDAWN spatial filter was used to reduce the number of channels from 13 down to 3 channels. Classification was performed based on a linear discriminant analysis classifier (LDA). The flash duration was 116ms and the inter-flash duration was 66ms.
Subject 1 performed experiments based on a standard 6x6 grid, while subject 2 performed additional tests with 7x7 display grid. Table II shows the results in terms of letters correctly spelled and average number of flashes required per letter. While the scope of these tests was limited, it is clear that RIPRAND-based sequences outperform row-column due to the very high letter accuracy and reduced number of flashes. Note that 1/4 and 1/5 flashrates lead to significantly worse results for subject 1 as these lead to overly frequent target flashes. Thus, RIPRAND is expected to lead to better performance than state of the art methods in large display grids (see subject 2 results for 7x7 grids) and for good performing subjects (see subject 1 results).
V. CONCLUSION
We present a novel method of generating flashes and a novel accumulation-based decision making scheme for the P300 speller which allows the experimenter to set any desired target flash rate for a display grid of any size. Simulation results showed that RIPRAND improves upon the classical row-column method in all circumstances and is particularly useful when used with large display grids. Online tests are used to showcase the increase in spelling speed which can be achieved by RIPRAND sequences. However, further validation is required to determine the benefits of RIPRAND for larger display grids and with more sophisticated P300 detection and accumulation.
TABLE II
ONLINE EXPERIMENT,RESULTS ARE GIVEN FOR THE COPY TASKS OF2
SUBJECTS. ACCURACY REPRESENTS THE NUMBER OF CORRECTLY SPELLED LETTERS OVER THE NUMBER OF TOTAL LETTERS SPELLED,AND
FLASHES GIVES THE MEAN NUMBER OF FLASHES REQUIRED PER LETTER.
Task Display Grid size Accuracy Flashes Subject 1
Copy RIPRAND 1/6 6x6 33/34 48.6 Copy RIPRAND 1/5 6x6 10/10 33.9 Copy Row col. 1/6 6x6 8/10 68.2
Subject 2
Copy RIPRAND 1/6 6x6 18/20 60.9 Copy RIPRAND 1/5 6x6 6/10 70.6 Copy RIPRAND 1/4 6x6 12/20 53.4 Copy Row col. 1/6 6x6 8/10 79.9 Copy RIPRAND 1/6 7x7 9/10 68.8 Copy Row col. 1/7 7x7 4/5 89.6
Acknowledgements
This work was carried out as part of the CoAdapt project, funded through ANR-09-EMER-002-01. We thank J´er´emie Mattout and Emmanuel Maby from INSERM DYCOG team for providing offline data.
REFERENCES
[1] L. Farwell and E. Donchin, “Talking off the top of your head: toward a mental prosthesis utilizing event-related brain potentials,” Electroencephalography and Clinical Neurophysiology, vol. 70, no. 6, pp. 510 – 523, 1988.
[2] B. Allison and J. Pineda, “ERPs evoked by different matrix sizes: implications for a brain computer interface (BCI) system,” Neural Systems and Rehabilitation Engineering, IEEE Transactions on, vol. 11, no. 2, pp. 110–113, 2003.
[3] M. Salvaris and F. Sepulveda, “Visual modifications on the P300 speller BCI paradigm,” Journal of Neural Engineering, vol. 6, no. 4, p. 046011, 2009.
[4] J. Jin, B. Z. Allison, T. Kaufmann, A. K¨ubler, Y. Zhang, X. Wang, and A. Cichocki, “The changing face of P300 BCIs: A comparison of stimulus changes in a P300 BCI involving faces, emotion, and movement,” PLoS ONE, vol. 7, no. 11, 2012.
[5] G. Townsend, B. LaPallo, C. Boulay, D. Krusienski, G. Frye, C. Hauser, N. Schwartz, T. Vaughan, J. Wolpaw, and E. Sellers, “A novel p300-based brain–computer interface stimulus presentation paradigm: Moving beyond rows and columns,” Clinical Neurophysiology, vol. 121, no. 7, pp. 1109 – 1120, 2010.
[6] M. Perrin, “Coadaptation cerveau machine pour une interaction opti-male: application au P300-Speller,” Ph.D. dissertation, Universit´e Claude Bernard Lyon 1, 2012.
[7] M. Perrin, E. Maby, S. Daligault, O. Bertrand, and J. Mattout, “Objective and subjective evaluation of online error correction during P300-based spelling,” Advances in Human-Computer Interaction, 2012.
[8] J. Jin, B. Allison, E. Sellers, C. Brunner, P. Horki, X. Wang, and C. Neuper, “Optimized stimulus presentation patterns for an event-related potential EEG-based brain-computer interface,” Medical and Biological Engineering and Computing, vol. 49, no. 2, Feb. 2011. [9] J. Jin, B. Allison, E. Sellers, C. . Brunner, P. Horki, X. Wang, and
C. Neuper, “An adaptive P300-based control system,” Journal of Neural Engineering, vol. 8, no. 3, Jun. 2011.
[10] H. Cecotti, B. Rivet et al., “One step beyond rows and columns flashes in the p300 speller: a theoretical description,” International Journal of bioelectromagnetism, 2010.
[11] B. Rivet, A. Souloumiac, V. Attina, and G. Gibert, “XDAWN algorithm to enhance evoked potentials: Application to brain-computer interface,” Biomedical Engineering, IEEE Transactions on, vol. 56, no. 8, pp. 2035 –2043, 2009.