A Comparison of the Behavior of Intact and
Resedimented Boston Blue Clay (BBC)
By
Robert Donald House B.S. Civil Engineering
University of Massachusetts, Amherst MA (2009)
Submitted to the Department of Civil and Environmental Engineering in partial fulfillment of the requirements for the degree of
Master of Engineering in Civil and Environmental Engineering at the
MASSACHUSETTS INSTITUTE OF TECHNOLOGY June 2012
ARCHIVES
MAASSACHUSET7,S INSTITUTE O)FTC
JU2
02012 Robert Donald House. All rights reserved.
The author hereby grants to MIT permission to reproduce and to distribute publicly paper and electronic copies of this thesis document in whole or in part in any medium now known or
hereafter created.
Signature of Author:
Department of Civil and Environmental Engineering May 17, 2012 Certified by:
Senior Research Associate of Civil and
I I
John T. Germaine Environental Engineering Thesis Su ervisor Accepted by: I eidi 1. Nepf Chair, Departmental Committee for Graduate StudentsA Comparison of the Behavior of Intact
and Resedimented Boston Blue Clay
by
Robert D. House
Submitted to the Department of Civil and Environmental Engineering on May 17, 2012 in Partial Fulfillment of the
Requirements for the Degree of Master of Engineering in Civil and Environmental Engineering
ABSTRACT
Resedimented Boston Blue Clay (RBBC) has been used as an analog test material for research at MIT for decades, due to local variability and the high cost of sampling. However, a comprehensive study of the differences in behavior between intact and resedimented BBC has not been completed recently. This thesis analyzes test data from laboratory CRS and triaxial tests conducted at MIT on intact and RBBC.
Typical ranges for compression ratio, hydraulic conductivity, coefficient of consolidation, lateral stress ratio, preconsolidation pressure and peak friction angle of RBBC were within ranges for intact BBC. Ranges for secant friction angle, swell ratio and undrained strength for intact BBC overlapped and were lower than ranges reported for RBBC.
Both intact and RBBC CRS data plotted to the right of the sedimentation compression line (SCL) in the Burland (1990) framework, showing significant structure and clay fabric. The Jaky equation (1948) was found to overestimate KO for intact BBC when using the peak friction
angle, and underestimate KO when using the secant friction angle.
Despite these differences, RBBC should continue to be used as an analog test material for studying clay behavior of BBC. Future research should expand the comparison into different test modes and additional clay mineralogies.
Thesis Supervisor: John T. Germaine
Acknowledgements
My biggest thanks go to Dr. Germaine. For serving as my advisor, teacher and friend and for providing an opinion on anything related to soil behavior and laboratory testing.
William Colehower at MIT Facilities for allowing me access to the MIT archives and previous geotechnical reports prepared for buildings on campus.
Zhandos Orazlin, Aiden Horan and Brendan Casey, for helping me collect data, find trends and answer my endless questions.
Shehab, Gery, Vasso, Alessandra, and Rachel for your friendship and help with classwork. All my coworkers and managers at GZA, especially: Terese Kwiatkowski, Bill Hover, Bill Hadge and Bill Beloff. Without your support and good blessing, this would not have been possible.
The Boston Society of Civil Engineers Section/ASCE and the Casagrande family for helping support my education.
My family (Mom, Dad and Ali) for your support and encouragement. And to Laura, for your patience and fortitude.
Table of Contents
A cknow ledgem ents ... 5
Table of C ontents ... 7
List of T ables ... 9
List of Figures... 10
List of Sym bols ... 12
1. INTRODUCTION... 14
1.1 PR O B LEM STA TEM EN T ... 14
1.2 SCO PE A N D O BJECTIV ES ... 15
1.3 ORGAN IZATION OF THESIS... 15
2. LITERATURE REVIEW ... 18
2.1 RESEARCH ON INTACT BOSTON BLUE CLAY ... 18
2.1.1 Evaluation of SHANSEP Strength-Deformation Properties of Undisturbed Boston Blue Clay from Automated Triaxial Testing (de La Beaumelle, 1991)... 18
2.1.2 Comparison of Recompression and SHANSEP Strength-Deformation Properties of Undistrubed Boston Blue Clay from Automated Triaxial Testing (Estabrook, 1991) ... 19
2.1.3 Characterization of the Engineering Properties of Boston Blue Clay at the MIT C am pus (B erm an, 1993)... 20
2.2 RESEARCH ON RESEDIMENTED BOSTON BLUE CLAY ... 20
2.2.1 Factors Controlling Pore Pressure Generation During Ko Consolidation of Laboratory Tests (Force, 1998)... 20
2.2.2 Experimental and Theoretical Investigation of Constant Rate of Strain Consolidation (G onzalez, 2000) ... . 2 1 2.2.3 An Experimental Study of the Time-Dependent Undrained Shear Behavior of Resedimented Clay Using Automated Stress Path Triaxial Equipment (Sheahan, 19 9 1)... 2 1 2.2.4 Simulation of Sampling Disturbance in Soft Clays Using Triaxial Element Tests (Santagata, 1994)... 22
2.2.5 An Experimental Investigation into the Stress-Dependent Mechanical Behavior of Cohesive Soil with Application to Wellbore Instability (Abdulhadi, 2009)... 22
2.3 RESEARCH ON BEHAVIORAL COMPARISONS BETWEEN INTACT AND RESED IM EN TED CLA Y S ... 23
2.3.1 On the Compressibility and Shear Strength of Natural Clays (Burland, 1990) ... 23
3. COMPARATIVE METHODLOGY... 30
3.1 BA SIS FOR COM PARISON S ... 30
3.2 C O LLECTIO N O F D A TA ... 31
3.3 SELECTION OF A DA TU M ... 31
3.4 LIMITATIONS ON ANALYZED DATA... 32
4. COMPRESSION BEHAVIOR... 35
4.1 IN T R O D U C T IO N ... 35
4.2 TRENDS WITH ATTERBERG LIMITS ... 35
4.3 EFFECTIVE STRESS AND PRECONSOLIDATION PRESSURE ... 38
4.4 SW E L L R A T IO ... 40
4.6 STRUCTURE OF INTACT AND RESEDIMENTED CLAYS ... 41
5. HYDRAULIC CONDUCTIVITY AND COEFFICIENT OF CONSOLIDATION...57
5.1 IN T R O D U C T IO N ... 57
5.2 TRENDS WITH ATTERBERG LIMITS AND ELEVATION... 57
5.3 HYDRAULIC CONDUCTIVITY AND VOID RATIO ... 58
5.4 COEFFICIENT OF CONSOLIDATION... 60
5.5 IMPLICATIONS FOR LABORATORY TESTING AND SOIL BEHAVIOR... 62
6. STRENGTH ... 72
6.1 IN T R O D U C T IO N ... 72
6.2 NORMALLY CONSOLIDATED LATERAL STRESS RATIO, KONC ---... 72
6.3 UNDRAINED STRENGTH ... 74
6.4 FR IC T IO N A N G L E ... 74
7. SUMMARY, CONCLUSIONS AND RECOMMENDATIONS ... 84
7.1 SUMMARY AND CONCLUSIONS... 84
7.1.1 B ackground ... 84
7.1.2 Previous R esearch ... 84
7.1.3 Comparative Methodology... 85
7.1.4 C om pression ... 86
7.1.5 Consolidation Param eters... 87
7 .1.6 S tren gth ... 8 8 7.2 RECOMMENDATIONS ... 89
7.2.1 Record Keeping and Electronic Data Storage ... 89
7.2 .2 Future W ork ... 90
References... 93
List of Tables
Table 1-1: Comparison of Resedimented and Intact BBC Properties ... 17
Table 3-1: Sources of Data for Intact BBC... 33
Table 3-2: Sources of Data for Resedimented BBC ... 33
Table 4-1: Soil Properties for Selected CRS Tests on Intact BBC ... 44
Table 4-2: Soil Properties for Selected RBBC Tests ... 44
Table 4-3: Coordinates of the SCL (Burland, 1990)... 45
List of Figures
Figure 2-1: Compression Ratio (CR) verus Elevation for South Boston Test Site (Estabrook, 19 9 1)... 2 5 Figure 2-2: Compression Ratio (CR) versus Elevation for East Boston Test Site (Estabrook,
19 9 1)... 2 5
Figure 2-3: SHANSEP versus Recompression Testing (Estabrook, 1991)... 26
Figure 2-4: CRS Compression Curves for RBBC (Gonzalez, 2000)... 26
Figure 2-5: Coefficient of Consolidation versus Vertical Effective Stress for RBBC (Gonzalez, 2 0 0 0 )... 2 7 Figure 2-6: Hydraulic Conductivity versus Void Ratio for RBBC (Gonzalez, 2000)... 27
Figure 2-7: Intrinsic Compression Line, as plotted in Void Ratio vs. Log Effective Stress Space (B urland, 1990) ... 28
Figure 2-8: Intrinsic Compession Line (ICL), as plotted in Void Index vs. Log Effective Stress Space (Burland, 1990)... 28
Figure 2-9: Comparing the ICL and the SCL (Burland, 1990)... 29
Figure 2-10: Compression Curves for Normally Consolidated Clays (Skempton, 1970, as shown in B urland, 1990)... 29
Figure 3-1: Locations of Intact BBC ... 34
Figure 4-1: Typical Intact BBC Compression Curve (CRS319)... 46
Figure 4-2: Compression Ratio and Liquid Limit for Intact and Resed. BBC ... 46
Figure 4-3: Compression Ratio and Plastic Limit for Intact and Resed. BBC ... 47
Figure 4-4: Compression Ratio and Plasticity Index for Intact BBC ... 47
Figure 4-5: Compression Ratio and Water Content for Intact BBC... 48
Figure 4-6: Water Content and Compression Ratio for Intact BBC... 48
Figure 4-7: Vertical Compression Ratio Profile for Intact BBC ... 49
Figure 4-8: Compression Index and Vertical Effective Stress... 49
Figure 4-9: Compression Ratio and Max. Pre-Shear Vertical Effective Stress... 50
Figure 4-10: CR and In-Situ Void Ratio for Intact and Resedimented BBC... 50
Figure 4-11: Preconsolidation Stress and In-Situ Void Ratio... 51
Figure 4-12: Vertical Profile of Void Ratio for BBC from Cambridge, MA ... 51
Figure 4-13: Stress History Profile for Natural BBC (South Boston and Cambridge)... 52
Figure 4-14: Vertical Swell Ratio Profile for Intact BBC ... 52
Figure 4-15: Swell Ratio for Intact BBC at High Stress... 53
Figure 4-16: Sw ell Ratio at Low Stress ... 53
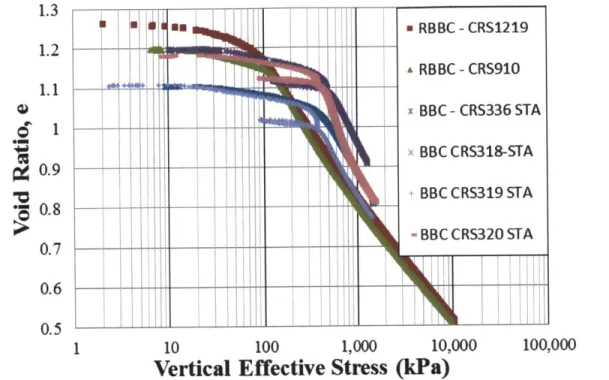
Figure 4-17: Selected RBBC Compression Curves ... 54
Figure 4-18: RBBC Swell Behavior at Incremental OCR... 54
Figure 4-19: Lateral Stress Ratio and Effective Stress for Intact and Resedimented BBC... 55
Figure 4-20: Evaluating the Burland Compression Space... 55
Figure 4-21: Compression Curves for Selected CRS Tests on Intact and Resedimented BBC ... 56
Figure 5-1: Extrapolating the In-situ Hydraulic Conductivity (CRS290) ... 63
Figure 5-2: Atterberg Limits Data for Intact BBC from Cambridge, MA... 63
Figure 5-3: Extrapolated In-situ Hydraulic Conductivity for BBC from Cambridge, MA ... 64 Figure 5-4: Hydraulic Conductivity at In-situ Void Ratio and e=0.8 for BBC from Cambridge,
Figure 5-6: In-situ Hydraulic Conductivity at In-situ Porosity... 65
Figure 5-7: In-situ Hydraulic Conductivity at In-situ Porosity for BBC in Cambridge, MA... 66
Figure 5-8: Vertical Plasticity Index Profile for Intact BBC ... 66
Figure 5-9: Hydraulic Conductivity and Void Ratio for Intact and RBBC from Cambridge, MA at 10 k sc ... 6 7 Figure 5-10: Hydraulic Conductivity and Void Ratio for Intact and RBBC from Cambridge, MA: in-situ and 10 ksc... . . 67
Figure 5-11: Hydraulic Conductivity versus Porosity for RBBC and Intact BBC ... 68
Figure 5-12: In-situ Hydraulic Conductivity versus In-situ Porosity ... 68
Figure 5-13: Coefficient of Consolidation for Intact BBC from Cambridge, MA ... 69
Figure 5-14: Coefficient of Consolidation for Intact BBC from Cambridge, MA ... 69
Figure 5-15: Coefficient of Consolidation for BBC from Cambridge, MA at 10 ksc ... 70
Figure 5-16: Coefficient of Consolidation for BBC from Cambridge, MA ... 70
Figure 5-17: Cv with Vertical Effective Stress for Intact and Resed. BBC ... 71
Figure 5-18: Evaluating Terzaghi Theory: Relating Cc/Ck and In-situ Void Ratio ... 71
Figure 6-1: Previous MIT Research on the Relation of Undrained Strength to Lateral Stress Ratio in R B B C ... 7 7 Figure 6-2: Normalized Undrained Strength and Ko for Intact and Resedimented BBC ... 77
Figure 6-3: Trendline by Abdulhadi (2009) for Normalized Undrained Strength and K0...... . . 78
Figure 6-4: Understanding the Relationship Between Undrained Strength, KO and Plasticity: Index Tests and Distance from RBBC Trendline for Intact BBC... 78
Figure 6-5: Normalized Undrained Strength of RBBC with Stress Level... 79
Figure 6-6: Normalized Undrained Strength with Stress Level for Intact and Resedimented BBC ... 7 9 Figure 6-7: Understanding the Relationship Between Undrained Strength and Stress Level... 80
Figure 6-8: Previous MIT Research on Large-Strain Friction Angle for RBBC... 80
Figure 6-9: Large Strain Friction Angle and Vertical Effective Stress for Intact and RBBC ... 81
Figure 6-10: Friction Angle at Peak Strength and Max. Vertical Effective Stress from Undrained T e sts... 8 1 Figure 6-11: Jaky's Equation and Peak Friction Angle for Intact and RBBC from Undrained T e sts... 8 2 Figure 6-12: Large-Strain Friction Angle and Jaky's Equation for Intact and RBBC... 82
Figure 6-13: RBBC Trendline for Secant Friction Angle and Vertical Effective Stress (A bdulhadi, 2009) ... 83 Figure 6-14: Relating Secant Friction Angle and Vertical Effective Stress to Plasticity and Water
List of Symbols
AL BBC CA/T CCB CR CRmax CRmin CRS CSL DSS EB GOM H&A ICL LIR MIT MSL MO NC OC OCR RBBC RR SB SCL SD SFBM SR TC TESkempton's pore pressure parameter A at failure
Absolute value of vertical distance from RBBC trendline Compression Index
Permeability change index Intrinsic compressibility Coefficient of Consolidation
Undrained secant Young's modulus In-situ (or initial) void ratio
Void ratio
Void ratio at liquid limit Intrinsic void ratio at 100 kPa Intrinsic void ratio at 1000 kPa Atterberg Limits
Boston Blue Clay
Central Artery/Tunnel Project (aka Big Dig) Cambridge City Base
Compression Ratio
Maximum Compression Ratio Minimum Compression Ratio Constant Rate of Strain Critical State Line Direct Simple Shear East Boston
Gulf of Mexico
Haley and Aldrich, Inc. Intrinsic Compression Line Load Increment Ratio
Massachusetts Institute of Technology Means Sea Level
Maximum Obliquity Normally Consolidated
Overconsolidated
Overconsolidation Ratio
Resedimented Boston Blue Clay Recompression Ratio
South Boston
Sedimentation Compression Line Standard Deviation
San Francisco Bay Mud Swell Ratio Triaxial Compression Triaxial Extension Af Ab cc Ck c, Eu eo e eL e 1oo e
IV Void Index
K Lateral Stress Ratio
K, Coefficient of lateral earth pressure at end of consolidation
Ko(NC) Coefficient of lateral earth pressure at rest for NC soil
k Hydraulic Conductivity k, In-situ Hydraulic Conductivity
kPa kilopascal
ksc kg/cm2
LL Liquid Limit
ln Natural logarithm
m Exponent in the SHANSEP equation describing the change in normalized strength with OCR MPa Megapascal n Porosity no In-situ porosity PI Plasticity Index PL Plastic Limit R2 Regression Coefficient
S Normalized undrained strength for NC soil in the SHANSEP equation su Undrained Shear Strength
Aub Change in back pressure USR Undrained Strength Ratio qf Shear stress at failure
w Water Content
E Strain
E a Axial strain
Ef Strain at peak shear stress, i.e. at failure <p'P Secant friction angle at peak shear strength <p'mo Friction angle at maximum obliquity a' P Preconsolidation pressure
C'V Vertical effective stress G've Axial consolidation stress
a'vm Pre-shear vertical effective stress a'v o In-situ vertical effective stress
1.
INTRODUCTION
1.1 PROBLEM STATEMENT
Most construction projects of any substantial magnitude in areas underlain by thick clay deposits conduct exploratory drilling and testing programs. The goal of these programs is to characterize the subsurface conditions, especially typical engineering properties of the clay, like Atterberg Limits, water content, compression ratio, lateral stress ratio and hydraulic
conductivity, preconsolidation pressure and strength. Much of the greater Boston area is underlain by thick deposits of marine illitic clay, locally known as Boston Blue Clay (BBC).
Over the past century, it has been one of the most studied and well understood clays, due in part to its history of high-rise buildings, and research by local universities and notable geotechnical engineers like Karl Terzaghi and Charles Ladd.
Unfortunately, obtaining high-quality samples of intact clay is expensive and difficult, even with piston samplers and heavy drilling mud (Ladd and DeGroot, 2003). Sample
disturbance can result from a number of factors, including encountering obstructions during tube advancement and mishandling during transportation, among others. These factors, coupled with natural variability lead to the development of resedimented clays as an analog material for clay testing and research. Resedimented clays consist of intact clay powder that have been oven-dried, ground, sieved, and then mixed with low concentrations of salt water and blended (Casey, 2011). This results in a soil slurry that is then put inside a greased consolidation cell and one-dimensionally consolidated to the desired stress. Upon completion of consolidation, the clay can be carefully removed and used in laboratory experiments.
While the resedimentation process has been successfully used and refined at MIT over the past 50 years, subtle and sometimes significant differences in the behavior of intact and resedimented BBC (RBBC) have been observed during laboratory testing. Table 1-1
summarizes key differences between intact and RBBC. Occasionally noted in small sections of graduate theses, a comprehensive analysis of the variation in behavior between intact and natural BBC has yet to be conducted.
1.2 SCOPE AND OBJECTIVES
The goal of this research is to compare the behavior of intact and resedimented BBC. This goal will be met through several objectives, notably: performing a broad-based literature review of existing research, create a database of previous research on BBC, and analyzing the comparisons between intact and resedimented BBC while documenting research that can be expanded on by future researchers. These objectives will be discussed in additional detail below:
1. Literature Review: The goal of the literature review is twofold: to research the differences in behavior between intact and resedimented clays and to review existing research conducted on Boston Blue Clay.
2. Create a Database: Using the existing research identified in the literature review, create a database in Microsoft Excel that documents test number, sample ID,
elevation, test quality, Atterberg Limits data and engineering properties (k, CR, SR, K, e, Cv, etc.). Ultimately, provide a copy of this database in electronic format for inclusion in the thesis for future researchers to utilize and expand upon.
3. Analyze Differences in Behavior: Locate and identify trends in intact and
resedimented clay behavior. Identifying trends between a laboratory-manufactured clay and one obtained from a natural deposit will be the most challenging component of the research, as large scatter in data exists for intact clay, even of the highest quality samples. Discerning the cause of the scatter is also of critical importance, to ensure that observed scatter is not due to laboratory bias.
4. Provide a basemap for future research: Ideally, the data collected in this thesis can be used for the starting point of additional research into the behavior between intact and resedimented clays that could be expanded into different test modes and clay types.
1.3 ORGANIZATION OF THESIS
This thesis is broken into 7 chapters that are discussed in further detail below. Chapter 2 presents a literature review of previous research on both intact and
resedimented Boston Blue Clay. Work by Estabrook (1991) and de La Beaumelle (1991) on intact BBC for both SHANSEP and Recompression testing for Boston's Central Artery/Tunnel
project is reviewed. Berman (1993) studied triaxial testing of intact BBC on MIT's campus for Building 68. Her work was supplemented by laboratory data conducted by Dr. Germaine on behalf of Haley and Aldrich for the recent Stata and Simmons Hall projects. Resedimented BBC
at varying pressures was studied by Abdulhadi (2009) and several CRS tests were performed on RBBC by Force (1998) and Gonzalez (2000). Additionally, several individual tests were taken from the research of Casey (2011) and Horan (2012), as well as Santagata (1994) and Sheahan (1991). The review concludes with a comparison of the behavior of intact and reconstituted soils by Burland (1990).
Chapter 3 describes how comparisons were made between intact and resedimented clay. Included, are how tests were selected, what material properties were studied and brief
descriptions of the data sources. Finally, simplifying assumptions and limitations on the presented results are discussed.
In Chapter 4, comparisons between intact and RBBC begin to be discussed, starting with compression behavior. Trends with Atterberg Limits, the coefficient of lateral earth pressure and effective stress as well as elevation are compared to reported values of compression ratio, CR. Relations to swell ratio and OCR are explored and test data are evaluated against Burland's intrinsic compression line (ICL) and the sedimentation compression line (SCL).
Chapter 5 explores hydraulic conductivity of intact and resedimented BBC. Hydraulic conductivity is studied in conjunction with void ratio, porosity and stress-level dependence. The coefficient of consolidation is also briefly discussed.
Strength components of intact and resedimented BBC are discussed in Chapter 6. Both peak and secant friction angle and undrained strength ratio (USR) are evaluated against vertical effective stress. Lastly, coefficient of lateral earth pressure is compared against friction angle and USR.
A brief summary and important research conclusions are presented in the final chapter, as Chapter 7. Future research areas and the importance of electronic data storage are also discussed.
Table 1-1: Comparison of Resedimented and Intact BBC Properties, from (de La Beaumelle, 1991) and (Sheahan, 1991)
Clay USR=qf/Y',e n Ef(a iab
Ar
Type Peak MO Peak MO Peak MO
BBC 0.322 ± 0.250 0.155% 11.6% 0.436 III 0.004SD 0.004SD 2 0.562 0.4SD .85SD 25 33.4 0.12SD 0.48S1 Natural 0.279 0.207 0.481 0.86 BBC 0.O1OSD 0.021SD 13 0.36% 10.2% 22.2 31.2 0.09SD 0.014
2. LITERATURE REVIEW
2.1 RESEARCH ON INTACT BOSTON BLUE CLAY
2.1.1 Evaluation of SHANSEP Strength-Deformation Properties of Undisturbed Boston Blue Clay from Automated Triaxial Testing (de La Beaumelle, 1991)
de La Beaumelle analyzed clay samples from two special testing sites in South and East Boston completed as part of Boston's Central Artery/Third Harbor Tunnel (CA/T, aka the Big Dig) project. Samples were obtained using piston samplers or Sherbrooke Block Samplers (South Boston, only) and heavy-weight drilling mud prior to laboratory extraction. de La Beaumelle performed 56 (46 with good results) Ko-consolidated undrained strength tests at varying OCR (1-8) using the SHANSEP method as well as 9 lateral stress oedometer tests.
de La Beaumelle describes a trend where KONC was observed to decrease with depth. He cites that "for El. 70 to El. 40, KO[NC] ranging from 0.56 to 0.61 down to typical values of 0.53 to
0.57 for the bottom 40 ft (El. 20 to El. -20)." A mean value of 0.557 ± 0.025SD is cited; using the Jaky equation, D'm = 31.2 +1 .3SD. Note that elevations are referenced to the CA/T datum,
which is further discussed in Chapter 3, Section 3.3 of this thesis.
Several other important conclusions are included, notably that peak failure is caused by relatively small axial strains, approximately 0.355% ± 0.15SD. Also, "a large amount of strain-softening until the maximum obliquity condition is reached, resulting in a friction angle at MO much greater than at peak." (approximately 25% less shear stress than at peak). The undrained strength ratio was observed to be constant; normalized Young's modulus was approximately 273
55 (no trend observed). Results for the South and East Boston sites were found to be comparable, when tested in triaxial compression.
de La Beaumelle also includes a brief comparison of the behavior of intact versus resedimented BBC as studied by 8 triaxial tests conducted by Sheahan (1991). He notes a number of important observations. First, compression curves for BBC may have some double curvature, but it is significantly less pronounced than compression curves obtained from intact clay. Second, compression ratios for resedimented BBC were less and showed considerably less scatter than intact BBC (0.132 - 0.187, versus 0.15 to 0.75). de La Beaumelle notes that "BBC III has a 15% higher qf/c-'vc that appears to result from the lower preshear Kc of only 0.48 (versus
0.56 for natural BBC). The low K, in turn led to a higher peak (p'r and a lower A,..." Resedimented BBC was also noted to have a higher effective friction angle at maximum obliquity and less strain softening. A summary table of selected properties was previously included as Table 1-1.
2.1.2 Comparison of Recompression and SHANSEP Strength-Deformation Properties of Undistrubed Boston Blue Clay from Automated Triaxial Testing (Estabrook, 1991)
A companion thesis to de La Beaumelle, Estabrook performed tests using the recompression technique and compared the results to de La Beaumelle's results using the
SHANSEP testing approach. Estabrook performed tests exclusively on the South Boston clay, performing 28 triaxial compression tests (9 from tubes, 19 from block samples) and 13 tests in
triaxial extension (2 from tubes, 11 from block samples).
Estabrook found a number of observations from her study of intact BBC behavior. First, intact normally-consolidated BBC has an S-shaped (double curvature) compression curve. This trend results in a maximum CR value located just past the preconsolidation pressure and
decreasing to a near-constant value. CRmax is often above 0.4 and has been reported as high as 0.7 for intact BBC before decreasing to more constant values around 0.15 to 0.2. Plots of CR versus elevation can be found in Figure 2-1 and Figure 2-2, for South and East Boston,
respectively. In South Boston, the transition from OC to NC was found to occur around El. 20 (CA/T datum); this change was noted higher in East Boston, at El. 40 (CA/T datum). Estabrook also noted that excessive deformation around the expected maximum past consolidation pressure is indicative of excessive sampling disturbance. Furthermore, preconsolidation stress can be difficult to locate, and may require LIR values as low as 0.1 when performing 1 -D oedometer testing.
Estabrook also concluded that in a high quality sampling program utilizing heavy-weight drilling mud and fixed piston samplers, the differences between tube and block samples were minimal. KONC) was also noted to be approximately 0.56.
With high quality samples, Estabrook concluded that recompression testing results are better representative of stress-strain-strength behavior of BBC. Recompression tests are faster to run and don't underestimate peak strength, strain at failure, nor normalized undrained Young's modulus, that is often accompanied with SHANSEP testing. Estabrook also noted a tendency to
mask strain-softening behavior during SHANSEP testing. For a comparison of SHANSEP versus recompression testing behavior, see Figure 2-3.
2.1.3 Characterization of the Engineering Properties of Boston Blue Clay at the MIT Campus (Berman, 1993)
Berman's thesis contains a thorough overview of the soil properties underlying the MIT Campus. Samples were collected from borings performed for the MIT Biology Building (Bldg. 68) near the intersection of Ames and Main Streets in Cambridge, MA. Berman conducted tests to analyze intact clay behavior in a number of failure modes including 1 -D oedometer (3 tests)
and CRS (6 tests). Berman also performed Ko-consolidated undrained strength tests in triaxial compression (21 tests), triaxial extension (11) and DSS (16 tests), as well as index tests. Triaxial tests were performed in both recompression and SHANSEP modes, while DSS testing was only conducted via the SHANSEP approach. Recompression and SHANSEP testing results were compared from Berman's research as well as Estabrook's and de La Beaumelle's data from
South/East Boston. Berman also analyzed piezocone. profiles from the same site, although this portion of the thesis was not utilized for comparing intact versus resedimented behavior.
Berman concluded that recompression and SHANSEP testing results are in excellent agreement for triaxial compression. "Recompression data from South Boston indicate that the Faf remains essentially constant with increasing OCR and probably better reflects in situ behavior," whereas Eaf tended to increase with increasing OCR. Berman also noted that for SHANSEP tests, the normalized undrained Young's modulus at 50% stress to failure was approximately 275 regardless of OCR. Normalized undrained Young's modulus increased with increasing OCR for recompression tests.
2.2 RESEARCH ON RESEDIMENTED BOSTON BLUE CLAY
2.2.1 Factors Controlling Pore Pressure Generation During Ko Consolidation of Laboratory Tests (Force, 1998)
Force studied the effect of strain rate on the dissipation of excess pore pressure in the Wissa constant rate of strain apparatus for RBBC. Testing specimens over a strain rate range of 0.7 to 12.7% while using a special probe to measure pore pressure in the middle of the sample, she confirmed "the relationship between excess pore pressure, hydraulic conductivity of the soil,
Force concluded that the strain rate at the time of 0.1 %/hr could be increased "by almost an order of magnitude." The author utilized data from CRS tests 238, 239, 241-244 and 250 to analyze hydraulic conductivity and the coefficient of consolidation for RBBC.
2.2.2 Experimental and Theoretical Investigation of Constant Rate of Strain Consolidation (Gonzalez, 2000)
Gonzalez performed a number of CRS tests using the Wissa consolidometer to analyze differences between linear and nonlinear theory on several different soil types and at varying
strain rate. Of these tests, 13 tests were performed on RBBC. Gonzalez concluded that results for linear and nonlinear theory are similar at low stress levels and begin to diverge at higher stress levels, where for "the fast test the nonlinear theory produces results that are closer to the slower strain rate results than the linear theory". Gonzalez also noted that tests performed at higher strain rates increase the maximum past pressure by 10-15%. These conclusions echo those
made by Force (1998). The coefficient of consolidation, C, was shown to increase with increasing stress level. Figure 2-4, Figure 2-5, and Figure 2-6 show void ratio versus effective stress, Cv versus effective stress and hydraulic conductivity versus void ratio for 6 CRS tests on RBBC.
Gonzalez also had several other important conclusions. He concluded that, "the pore-water pressure ratio (Aub/av) should be less than 0.15 to achieve accurate results with only
negligible differences between linear and nonlinear theories." Gonzalez also found that there is a apparatus stiffness issue, which can have large impacts on results, especially for RBBC. The apparatus stiffness is believed to be the reason that RBBC showed little strain rate effects when observing hydraulic conductivity, and the impetus for a relation between coefficient of
consolidation and strain rate.
2.2.3 An Experimental Study of the Time-Dependent Undrained Shear Behavior of Resedimented Clay Using Automated Stress Path Triaxial Equipment (Sheahan, 1991)
Sheahan had several contributions to geotechnical laboratory testing and behavior of soft clays at MIT in his 1991 Sc.D. thesis. First and foremost, he wrote the source code for
automated triaxial testing that still serves as the backbone of computer-automated strength testing in the MIT geotechnical laboratories and aids in regression of raw data files. Secondly,
he investigated strain rate effects on strength testing of RBBC. Testing RBBC at strain rates of 0.05, 0.5, 5 and 50% per hour in both compression and extension modes at varying OCR (1,2,4 and 8), Sheahan found, "In compression, the undrained strength increased with strain rate as follows: across the three slowest strain rates, the increase in Su drops from 7% per log cycle of strain at OCR= 1 to negligible changes at OCR=8; across the fastest strain rates, a strength increase of about 8% occurs at all OCRs." Sheahan also incorporated lubricated end platens to reduce irregular pore pressure distributions and so-called "dead zones". This author utilized data from triaxial tests TX 11 and TX 13 for undrained strength data at OCR= 1.
2.2.4 Simulation of Sampling Disturbance in Soft Clays Using Triaxial Element Tests (Santagata, 1994)
Santagata investigated the impact of sampling disturbance on the strength and compression behavior of NC and OC RBBC (up to OCR=8). By creating disturbances on laboratory samples and performing ID triaxial element tests, she found several conclusions: NC RBBC was more affected by disturbance than OC RBBC and "increasing disturbance causes a decrease in the compression ratio of the soil and an increase in the strains at any given stress, but does not significantly affect the preconsolidation pressure which for all levels of disturbance is estimated within 10±5%. In all cases disturbance leads to an overestimation of a'," (1994).
Santagata also noted that the USR decreases with increasing preshear Ko. This author included triaxial tests TX123 and TX 130 in Chapter 7 to highlight previous research on the undrained strength of RBBC.
2.2.5 An Experimental Investigation into the Stress-Dependent Mechanical Behavior of
Cohesive Soil with Application to Wellbore Instability (Abdulhadi, 2009)
Abdulhadi conducted a number of experiments on RBBC to investigate normalization behavior over a wide range of stress levels (0.15 to 1 OMPa). Three CRS tests were conducted, along with 25 Ko-consolidated specimens (of which 21 were sheared in compression). His principal findings were a, "remarkable reduction in the undrained strength ratio (su/ y've) with consolidation stress level, notable reduction in the stiffness ratio (Eu/ c'c), increase in the strain to mobilize peak resistance (se), and a significant decrease in the large strain friction angle (CD)." Abdulhadi also conducted experiments regarding borehole stability, the results of which are not included in this review.
2.3 RESEARCH ON BEHAVIORAL COMPARISONS BETWEEN INTACT AND RESEDIMENTED CLAYS
2.3.1 On the Compressibility and Shear Strength of Natural Clays (Burland, 1990) Burland introduces a framework for comparing the intrinsic behavior of clay (in the reconstituted state) and the sedimentation behavior of clay, due to geological processes, like
glaciation. He reasons that reconstituted clays should lie on a line known as the intrinsic compression line (ICL). The ICL can be defined using a parameter known as the void index, I, where:
Iv = (e -e*ioo) / (e*1oo - e*1ooo) (Eq. 2.1)
and e*loo and e*1ooo are the void ratios at 100 and 1000 kPa, respectively (see Figure 2-7 through
Figure 2-9). A regression of the line results in the following equation for I: Iv = 2.45 -1.285x + 0.015x3 (Eq. 2.2)
where x = log (ov), in kPa. The sedimentation line can be defined through laboratory testing and the equation for void index. Although the regression through the SCL is approximately
curvilinear, the individual points often are not, and may be saw-toothed, "reflecting temporal variations in depositional conditions." The slopes of the lines of the ICL and SCL, as shown in Figure 2-9 are approximately parallel and display "the enhanced resistance of a naturally
deposited clay over a reconstituted one and results from differences in the fabric and bonding (i.e. the structure) of the soil skeleton." However, Burland goes on to note that, "at pressures in excess of 1000 kPa the ICL and SCL tend to converge."
Some clays, such as those from the Mississippi delta do not follow the SCL and instead resemble the double-curvature behavior. Burland attributes this behavior to the fabric of the soil which can be open (dispersed) or closed (flocculated). "The two most significant depositional factors are likely to be the rate of deposition and the stillness of the water," notes Burland, with slow deposition resulting in the dispersed-type of fabric. A number of clays are plotted in Figure 2-10 originally presented by Skempton in 1970. Burland notes several important observations from Figure 2-10:
* The compression curves tend to converge at high stress; * Clays with higher liquid limits have higher insitu void ratios;
0 Sensitive clays tend to lay on the right hand side of the plot;
0 The relationship between void ratio and log vertical effective stress is approximately linear for individual clays
Most normally consolidated clays lie along the SCL. However, some clays do lie above the SCL. These clays are often cemented clays, and their presence away from the SCL is
indicative of their sensitive nature (Figure 2-10). The Burland compression framework is further discussed in Chapter 4 of this thesis.
-. 80 601 40 -2 4 - -0.1 0.2 0.3 0.4 0.5 0.6 0.7 0.8 Compression Ratio (CR)
Figure 2-1: Compression Ratio (CR) verus Elevation for South (Estabrook, 1991)
Boston Test Site
c 0ei *. 80 60 40 20 0 20 -4 0 L I 1 1111 J f I. 1.LL 0 0.10.20.30.40.50.60.70.8 Compression Ratio (CR)
Figure 2-2: Compression Ratio (CR) versus Elevation for East Boston Test Site (Estabrook, 1991) 11111 .- -O . ~. -0 " - - - - --I-
1
-- -I -I -I -I i ... ... ...0 Recompressior - Blocks a Recompression - Tubes x Recompession - PSS
0.1
L.R. of Recompression Tests (t 1 SD) -0 - LR of SHANSEP Tests (t 1 SD)-0.1
-0 .2
--- -....
0
-0.3 - SHA SEP Recon presi
SD.0.020 x SD=40.047
0 .4
--
---
-0.6
. , , r
-0.2
oT
0.2
0.4
0.6
0.8
1
log OCR
Figure 2-3: SHANSEP versus Recompression Testing (Estabrook, 1991)
[25 :-120 .15 'I 1.00 O95 0.90 0.85 0.80 0.75 0.10 0.65 -0.1 1 10
Effective Venical Stress. or (ksc)
Figure 2-4: CRS Compression Curves for RBBC (Gonzalez, 2000)
0r 0P) 0
0.020
Shaded area indicates nonlinear theory resukts CRS 243 0.0 15 4.02 %/hr 0.111 0 ~nl CRS 273 74. 10 %/hr
.0
- -CRS272 CRS242 CRS 33 12.71 %/hr -J7.83 %/hr 48. 10 %/hr-0.005 - - ---
- -CRS 238 0.84 %/h 0. 1 10 100Effectiv-e Vertical Stress. a, (ksc)
Figure 2-5: Coefficient of Consolidation versus Vertical Effective Stress for RBBC (Gonzalez, 2000) 1. 2 5 1.15 -- 1.10---J 1.05 CRS 27 -1.00 -- -CRS212 -- - - - - 74. 10 r/hr 0.95 - 8.10 G/hr > -- CRS 238: 01 0,90 . " - - -0.84 i/hr- --64'CRS -243 - -0.85 -CRS 334--- --4.02 %/hr < 0.80 ---.- 7.83 '/hr 0.75 CRS 242
0.70 - . . Shaded area indicawes nonlinear theory results
0.65
I E-08 I E-07 I E-06
HydrauI ic Conducti vity. k, Icm/sec I
e
',1
Intrinsic ompressoon
line (ICL)
log
(a:
kPa
Figure 2-7: Intrinsic Compression Line, as plotted in Void Ratio vs. Log Effective Stress Space (Burland, 1990)
0
-1
e*ioo-e oc C
n ,ICL
100
1000 log aj: kPaFigure 2-8: Intrinsic Compession Line (ICL), as plotted in Void Index vs. Log Effective Stress Space (Burland, 1990)
LL LL Osbotjord 98 A-33 80 A-31 63 B-87 58 C-18 46 * 0 e e e Alvingen 95 Shellhaven 82 Avonmouth 71 Drammen 54 Grangemouth 41 Drammen 38 Detroit 28 0 0 U 4 3 -2 0 10 a.:kIPa LL * S.Joaquin 64 * Milazza 62 * Baku 40 Co-ordkats of the SCL O'W: l, kPa 0-4 3-84 compression 1 3-24 4 2-42 10 1-92 40 1-22 100 0-77 400 0-13 1000 0.30 4000 -0-94 10000 -1-36 e ,~ 102 103 1W,
Figure 2-9: Comparing the I
.2
.
CL and the SCL (Burland, 1990)
pe kg/t.0
Depth 3 10 *" 0 TO 'iT e mb
Figure 2-10: Compression Curves for Normally Consolidated shown in Burland, 1990) Clays (Skempton, 1970, as 5I 0 e0 Intrinsic compression -1 Ilj I I I I L I I I I I I ijAj~ 1 0-' 1
3. COMPARATIVE METHODLOGY
3.1 BASIS FOR COMPARISONS
Comparing the behavior of resedimented and intact clay can quickly become overwhelming without adequately bounding one's research. In addition, the limited time
available for research (6 months for MEng vs. 2 years for M.S.) required reducing the scope to a manageable level with quality finished work product. To complete these objectives, the
subsequent analysis was restricted to the following: 1. Geographic Location:
Intact and resedimented clays from the Boston basin area
Only
(including Cambridge).2. Test Mode/Type:
Only constant rate of strain (CRS) consolidation and triaxial compression (both SHANSEP and Recompression) tests were included for the analysis. Triaxial extension, oedometer and direct simple shear (DSS) tests were not included. 3. Stress Range:
Only behavior of normally consolidated (NC) clays was considered (up to ~1.2 OCR). Rarely are truly NC deposits encountered in nature due to mechanical ageing and creep. However, NC behavior was studied because significant portions of BBC are considered to be NC, behavior is more likely to be linear for NC than for OC clay, and tests were SHANSEP consolidated. As a result, a comparative study of overconsolidated BBC in the intact and resedimented state was not included in this research. Nonetheless, several overconsolidated tests were used for comparison with
material parameters (AL, a'p, a'vo, etc.). 4. Basic Material Behavior (Atterberg Limits):
For a test to be considered, Atterberg Limits testing had to have been performed on a sample from the same tube. Atterberg Limits provide a simple means for bounding a
index tests performed following consolidation or strength testing. The author assumed that the soil from which index tests were performed was similar to specimens tested in consolidation or shear by looking at water content data from tube samples and searching for large discrepancies in measured water content (this may or may not be a conservative assumption). Furthermore, Atterberg Limits (AL) test data from South Boston were not tabulated and interpreted from plots of AL vs. elevation.
3.2 COLLECTION OF DATA
Data were collected from previous research conducted at MIT on both intact and resedimented Boston Blue Clay, as well as from testing programs from on-campus buildings. From MIT's campus, data from intact clay samples were obtained from the Stata Center, Building 68 (Biology) and Simmons Residence Hall. Data were also obtained from Central Artery testing sites in South and East Boston. All sites used heavy-weight drilling mud and piston samplers for obtaining intact Shelby tube samples. A table outlining the number of intact tests performed by each researcher, test mode and sample location is shown as Table 3-1. A map showing the relative locations is shown in Figure 3-1.
Data for resedimented Boston Blue Clay also came from several researchers, including Abdulhadi, Casey, Force, Gonzalez and Horan. A summary of resedimented tests, researcher and test type is summarized as Table 3-2. All data referenced in this thesis for resedimented BBC were from Series IV BBC processed from the Bldg. 68 excavation on campus; however, several tests by Santagata and Sheahan from Series III were also included for reference. For additional information on the resedimenting process and typical batch properties, see Chapter 3 in
Abdulhadi (2009).
3.3 SELECTION OF A DATUM
All figures included in this thesis are referenced to Cambridge City Base (CCB) and are in feet, unless noted otherwise. Data from South and East Boston originally in de La Beaumelle (1991) and Estabrook (1991) were presented in the Central Artery/Tunnel datum where:
CCB = CA/T - 89.16 feet (Eq. 3.1)
CCB = MSL - 10.84 feet (Eq. 3.2) (Haley and Aldrich, 2002)
3.4 LIMITATIONS ON ANALYZED DATA
All data are subject to certain limitations, and this thesis is no exception. Much of the data used in this thesis was not available in electronic format. Furthermore, not all data was tabulated. Thus some data points were estimated or interpolated from figures and are
approximate. Where preconsolidation pressures are reported, they are the average of the Strain Energy and Arthur Casagrande methods, except where noted. For resedimented clay, since samples were prepared from batches, individual test limits were not performed, but limits from the individual batches were used instead.
Table 3-1: Sources of Data for Intact BBC
Lo tion Location Year Tet Test Type Researcher
Bldg.T68 Cambridge 1993 29 CRS/Triaxial Berman
Stata Center Cambridge 2000 20 CRS H&A, Germaine
(MIT)
Hall M Cambridge 2002 10 CRS H&A, Germaine
South South Recompression/SHANSEP de La Beaumelle/
Boston Test Boston 1991 14 Triaxial Estabrook
Site _________ _
Test ston Bston 1991 6 SHANSEP Triaxial de La Beaumelle Note: Tests performed on NC clay in compression
Table 3-2: Sources of Data for Resedimented BBC No.
Year Tests Test Type Researcher
1998 7 CRS Force
2000 6 CRS Gonzalez
2009 3/14 CRS/Triaxial Abdulhadi
2012 6 Triaxial Casey
2012 1 Triaxial Horan
Note: All tests performed MIT's campus.
4. COMPRESSION BEHAVIOR
4.1 INTRODUCTION
Compression curves allow geotechnical engineers to evaluate the compressive behavior of cohesive soils. Generally, void ratio is plotted against vertical effective stress (log scale) as shown in Figure 4-1, although strain rate is frequently substituted for void ratio on the vertical axis. Clays often have a log-linear relationship between void ratio and effective stress. The slope of the line from the initial void ratio down to the beginning of the curved portion is termed the recompression ratio (RR) and is given by the equation:
RR = [Ae / log(AcY'v)] / (1+eo) (Eq. 4.1)
The point of maximum curvature is defined as the preconsolidation pressure (a'p) and is the largest stress the soil has been subjected to previously. Often, the recompression portion of the curve is subject to disturbance due to sample retrieval, transport and laboratory set-up. An unload/reload increment is often performed just after the preconsolidation pressure in an effort to more accurately estimate the RR. The portion of the curve to the right of the preconsolidation pressure is referred to as the normally consolidated region (or virgin compression line) as the preconsolidation pressure is now equal to the vertical effective stress. The compression ratio is the slope of the normally consolidated portion of the compression curve. Swell ratio (SR), or the increase in volume after reduction in vertical effective stress can be calculated by incrementally removing the load and observing swell. SR can be calculated using the method to obtain RR. (Coduto, 1999)
4.2 TRENDS WITH ATTERBERG LIMITS
Properties of RBBC are fairly constant and well documented. Typical values of liquid limit, plastic limit and plasticity index are 45 to 46%, 22 to 23% and 22 to 23%, respectively. Abdulhadi (2009) reported a specific gravity of solids of 2.81, a clay fraction of 56% and a salt content of 11.1% (intact BBC is approximately 16 g/L). Compression ratios trended between 0.18 to 0.155 at stresses of 0.2 to 0.8 MPa, while swell ratios ranged from 0.011 to 0.019 for OCR between 2 to OCR 8 (Abdulhadi, 2009). While the intrinsic properties of RBBC are
relatively constant (some are stress-dependent), a large range in data exists for natural BBC under various engineering test modes.
For intact BBC, some previous authors reported tabulated values of CRmin, while others reported values as CRmax. Still other values were reported as an average over the tested stress range. This author selected average CR values or CRmin, if reported. Values of CRmax were included if no other information was provided. Only 2 of the CRmax values seemed unreasonably high (TX10 and TX17 with CR=0.55 and 0.5, respectively), all other values were within the range of typical CR for BBC, between 0.13 and 0.22. Compression ratios (CR) of intact BBC ranged from 0.10 to 0.55, with a mean CR of 0.196 ± 0.075 based on 67 tests. This average value of CR is above the upper bound of the range noted above for RBBC. It should be noted that there was a slight variation in average CR over the several test sites studied, although individual sample subsets varied widely. For East Boston, the average CR value was 0.206 0.023 (n=4), 0.272±0.115 for South Boston (n=13) and 0.175±0.048 (n=50) for Cambridge. Of those three means, only Cambridge was within the range noted for RBBC.
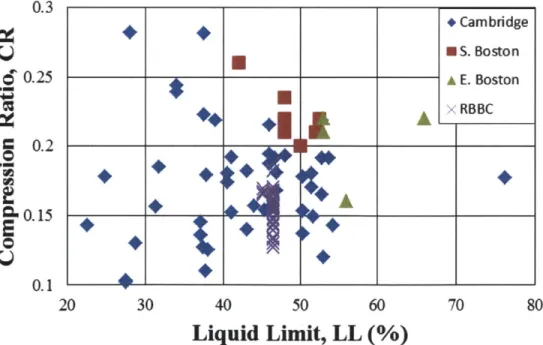
Figure 4-2 plots CR versus liquid limit while Figure 4-3 and Figure 4-4 plot CR versus plastic limit and plasticity index, respectively, with Cambridge shown in blue (diamonds), South Boston in red (squares), East Boston in green (triangles) and RBBC in purple (x's). No clear trend was observed between Atterberg Limits and compression ratio, however local geographic banding was noted between the data sets. Liquid Limit ranged from 22.6 to 66 (43.3, average) for the entire data set and from 22.6 to 54.2 (40.0, average) for the Cambridge subset. Liquid Limit for the South Boston subset ranged from 42 to 56 (50.3, average) and from 53 to 66 (58.4, average) for East Boston. Plastic Limit ranged from 16.1 to 29.6 (20.9, average) for Cambridge, 18 to 26 for South Boston (22.8, average) and 23 to 27 for East Boston (25.0, average).
Plasticity index data was similar to liquid and plastic limit data with a large range of 6.4 to 41 for the sample population, 6 to 30.3 for Cambridge (19.1, average), 25 to 34 for South Boston (28.6, average) and 29 to 41 for East Boston (34, average).
In both Figure 4-2 and Figure 4-3, data from the Cambridge subset have the widest range and the lowest CR values. South Boston trended to have the highest CR values with mid-range limits, while East Boston trended far to the right, although several Cambridge outlier points were scattered around East Boston data as well. RBBC fit within the bounds for intact BBC, although compression ratios were generally lower than for those of intact BBC. RBBC appears as a
vertical line due to the large stress range over which it was tested, as Abdulhadi (2009) noted that CR decreases with stress level.
Figure 4-5 plots compression ratio versus water content. A clear trend can be observed, with CR increasing with increasing water content according to the following equation:
we = -529.49(CR)2 + 293.1(CR) + 2.3146, R2= 0.70, n=67 (Eq. 4.2) This is intrinsically satisfying, as samples with higher water contents would be expected to undergo additional compression to remove extra water that would not be present at lower water content. Unfortunately, reversing the axes of Figure 4-5 results in the plot depicted in Figure 4-6, which is far less useful to practicing engineers. The corresponding quadratic equation is:
CR = 0.0003(wc) 2 - 0.0138(we) + 0.2674, R2 = 0.56, n=67 (Eq. 4.3)
A designer with a given water content is unable to go into the chart and accurately select a compression ratio. However, Figure 4-6 may be useful in evaluating whether a tested sample's compression ratio is acceptable or should be considered suspect.
Compression ratio was also plotted against elevation referenced to Cambridge City Base (CCB) datum as Figure 4-7. Note that CCB is 89.16 feet lower than the Central Artery/Tunnel datum. CCB is also 10.84 feet lower than Means Sea Level datum of 1929 (Haley and Aldrich, 2002). One would expect to see initially low values of CR due to dessication and
overconsolidation of the clay crust, with CR increasing with depth, as the stiffness of BBC decreases with depth. However, this expected trend is hard to observe due to a small cluster of data between El. -60 and El. -75 and one other point scattered further down. Upon closer inspection, all three data points are from the Building 68 explorations, CRS283 at El. -90.7 is from Simmons Hall and the points clustered at El. -70 along the vertical axis are from the Stata Center. Of the remaining 6 data points from Building 68, 3 have specimen water contents greater than their liquid limit. Also, their depth may be indicative of a higher silt content, which
could explain the low values for CR, although gradation or hydrometer analyses were
unavailable for validation. Omitting this cluster of points that tend to share low CR values at low elevations would support the expected trend.
Figure 4-8 plots compression index and vertical effective stress for several CRS tests on intact BBC. CRS 1219 is included as a reference for RBBC and can be seen to have a slightly decreasing compression index over one log cycle of stress, decreasing from 0.35 to 0.31 between 4 and 40 ksc. A summary of material properties can be found in Table 4-1. Note that not all
curves appear to be connected, as some tests had unload/reload cycles that resulted in additional secondary compression, prior to reload - these portions of the curve were omitted for clarity.
Preconsolidation pressures generally appear as the change in curvature on the first curve, before approaching some constant value at high effective stress, however intact BBC does not approach a common compression index value. CRS tests 294 and 343 were included, because they were performed at the highest values of liquid limit and plastic limit, respectively that were recorded from available test data. Whether tests approached a constant compression index value above or below the RBBC trendline appears to be linked to specimen water content. CRS tests 287, 290, and 317 all plotted below the RBBC line, as represented by CRS 1219 and had water contents above 38%. In contrast, CRS 283, 294, and 343 all had specimen water contents below 34%.
CRS test 283 had the sharpest transition between the initial and final portion of the curve; it was also the only test analyzed that appeared to be normally consolidated (OCR= 1.1, aT'yoa'p). All other analyzed tests had OCRs greater than 1.8.
Trends from Atterberg Limits allow several important observations. First, it shows the high variability in natural soils. While RBBC is essentially a homogenous clay fabric with nearly constant intrinsic material properties (albeit some are stress-dependent), natural BBC shows large ranges in liquid limit, plastic limit and compression ratio. Second, the data demonstrate that while generalizations can be made about intact clay properties with sufficient test data, subtle trends can be observed from geographic subsets located only several miles away. These geographic differences could be attributed to slightly different depositional environments or geologic differences, such as changes in loading due to glacial retreat.
4.3 EFFECTIVE STRESS AND PRECONSOLIDATION PRESSURE
Figure 4-9 shows CR plotted against maximum pre-shear vertical effective stress. Test data is skewed towards lower stresses and all intact BBC samples were tested to effective stresses under 30 ksc. Only recently has research been directed towards high stress testing and resulted in subsequent developments in high pressure testing cells. Compression ratio is relatively constant for RBBC over one log of stress, ranging from 0.155 to 0.18 (Abdulhadi, 2009). Compression ratios of natural BBC tend to show significant scatter with no obvious
Compression ratio and in-situ void ratio are plotted as Figure 4-10. A clear linear trend between void ratio and CR is evident for intact BBC. Lower CR is expected with lower void ratio, as the soil is already significantly compacted due to past geologic processes, whereas a higher void ratio could be indicative of a reduced overburden thickness. A regression through the intact BBC data yields an equation, where:
CR = 0.221eo - 0.05, R2=0.37, n=68 (Eq. 4.4)
A similar trend for RBBC was not observed, likely because tests on RBBC at MIT are typically carried out over a much greater range of effective stress than natural samples would be subject to in the field. Furthermore, multiple values of CR were cited for the same test at varying effective stress. To see if this trend was reflected in RBBC, additional tests would need to be conducted at lower effective stress and over a greater range of initial void ratio.
Figure 4-11 plots in situ void ratio and preconsolidation stress for the intact data set (n=78). A representative RBBC line (CRS1219) is also included for reference. Natural BBC had a large range of in-situ void ratio and preconsolidation pressure. In-situ void ratio ranged
from 0.70 to 1.37, with a mean void ratio of 1.05±0.143, and showed a trend to decrease with depth, as illustrated in Figure 4-12. For natural BBC, an extremely large range of
preconsolidation pressures can be characterized at a given void ratio. For example, at eo -1.1 preconsolidation pressures range from 2 to 13.7 ksc (approximately 1.46 ksc for RBBC). Much
of this variation is due to nonhomegeneous geologic processes. Natural BBC has a distinctive crust due to various physical processes, including cementation, dessication and groundwater pumping (Jamiolkowski, 1985) (Whittle, 2012). Another critical observation is that the RBBC trend for preconsolidation stress passes through the range of data for intact BBC. This reinforces our confidence in RBBC as an analog test material.
A vertical stress history profile is included as Figure 4-13 (Ladd and DeGroot, 2003). The preconsolidation pressure profile is distinctively bilinear due to the overconsolidated crust overlying thick deposits of normally consolidated BBC. The South Boston and Bldg. 68 sites also had distinctively different stress histories, despite their close proximity to one another. For the South Boston site, initially, the preconsolidation pressure is as high as 15 ksf at El. -40, decreasing linearly to approximately 5 ksf at El. -80, where the clay becomes normally
consolidated and follows the in-situ vertical stress line. The Cambridge site, in contrast starts at about 10 ksf at El. -20 and decreases to about 5 ksf at El. -60 before joining the NC line.
4.4 SWELL RATIO
As noted previously, Abdulhadi reported swell ratios of 0.011 to 0.019 for OCR between 2 to 8 (2009) for RBBC. Swell ratios for intact BBC were reported from several sources.
Berman conducted 6 CRS tests for Building 68. Germaine also performed 19 CRS tests for the Stata Center (plus an additional 13 unload/reload loops) and 18 CRS tests for Simmons Hall (plus an additional 12 unload/reload loops). CRS tests performed for Stata (B 101 and B 102) and
Simmons (B99) were all performed at an OCR of 2, whereas Berman performed tests at OCR=10. Swell ratios calculated by Germaine are the secant swell ratio after one cycle of secondary compression. Berman (1993) did not allow pore pressure dissipation or secondary prior to estimating the swell ratio.
A plot of swell ratio with elevation for intact BBC can be found as Figure 4-14. A total of 50 swell ratios for intact BBC were measured, with a mean value of 0.0093±0.0018 and a range from 0.001 to 0.029. The range of swell ratio for RBBC as quoted by Abdulhadi (2009) is within the range for intact BBC. The average swell ratio for intact BBC of 0.009 is just outside the lower bound of the range for swell ratio (0.011) as reported by Abdulhadi (2009).
A number of CRS tests on intact BBC had two unload loops. The first was performed just after the estimated preconsolidation pressure to OCR=2 and is denoted "low stress". The
final unload cycle was after one cycle of secondary compression and unloaded to OCR=2 and is referred to as "high stress". Maximum test stress varied slightly from test to test, but was approximately 15 ksc. All reported values of swell ratio at high stress for intact BBC
(SR=0.0l 1±0.0039) were higher than values performed during the low stress unload/reload loop for the same test (SR=0.0067±0.0017). This is expected, as the material is likely to have more relaxation following load to high stress than at low stress.
Swell Ratio for intact BBC was observed to decrease with elevation (Figure 4-15) at high stress, a conclusion echoed by Berman (1993). A similar trend was not observed at low stress (Figure 4-16), but may be due to the limited number of tests performed on samples below El. -80 feet (CCB).
To investigate whether swell ratio had a stress-level dependence, several compression tests on RBBC were collected over a large effective stress range. A summary of test properties can be found in Table 4-2. Natural BBC was not investigated, as tests are not usually conducted