HAL Id: hal-01788551
https://hal.sorbonne-universite.fr/hal-01788551
Submitted on 9 May 2018
HAL is a multi-disciplinary open access
archive for the deposit and dissemination of
sci-entific research documents, whether they are
pub-lished or not. The documents may come from
teaching and research institutions in France or
abroad, or from public or private research centers.
L’archive ouverte pluridisciplinaire HAL, est
destinée au dépôt et à la diffusion de documents
scientifiques de niveau recherche, publiés ou non,
émanant des établissements d’enseignement et de
recherche français ou étrangers, des laboratoires
publics ou privés.
Distributed under a Creative Commons Attribution| 4.0 International License
diabetes
Romain Charmet, Seamus Duffy, Sareh Keshavarzi, Beata Gyorgy, Michel
Marre, Peter Rossing, Amy Jayne Mcknight, Alexander P. Maxwell, Tarun
Veer Singh Ahluwalia, Andrew Paterson, et al.
To cite this version:
Romain Charmet, Seamus Duffy, Sareh Keshavarzi, Beata Gyorgy, Michel Marre, et al.. Novel risk
genes identified in a genome-wide association study for coronary artery disease in patients with type
1 diabetes. Cardiovascular Diabetology, BioMed Central, 2018, 17 (1), pp.61.
�10.1186/s12933-018-0705-0�. �hal-01788551�
Charmet et al. Cardiovasc Diabetol (2018) 17:61 https://doi.org/10.1186/s12933-018-0705-0
ORIGINAL INVESTIGATION
Novel risk genes identified in a
genome-wide association study for coronary
artery disease in patients with type 1 diabetes
Romain Charmet
1,2, Seamus Duffy
3, Sareh Keshavarzi
4, Beata Gyorgy
1,2, Michel Marre
5,6, Peter Rossing
7,8,
Amy Jayne McKnight
3, Alexander P. Maxwell
3, Tarun veer Singh Ahluwalia
7, Andrew D. Paterson
4,9,
David‑Alexandre Trégouët
1,2*†and Samy Hadjadj
10,11,12*†Abstract
Background: Patients with type 1 diabetes are more at risk of coronary artery disease than the general population.
Although evidence points to a genetic risk there have been no study investigating genetic risk factors of coronary artery disease specific to individuals with type 1 diabetes. To identify low frequency and common genetic variations associated with coronary artery disease in populations of individuals with type 1 diabetes.
Methods: A two‑stage genome wide association study was conducted. The discovery phase involved the meta‑anal‑
ysis of three genome‑wide association cohorts totaling 434 patients with type 1 diabetes and coronary artery disease (cases) and 3123 T1D individuals with no evidence of coronary artery disease (controls). Replication of the top associa‑ tion signals (p < 10−5) was performed in five additional independent cohorts totaling 585 cases and 2612 controls.
Results: One locus (rs115829748, located upstream of the MAP1B gene) reached the statistical threshold of 5 × 10⁻⁸ for genome‑wide significance but did not replicate. Nevertheless, three single nucleotide polymorphisms provided suggestive evidence for association with coronary artery disease in the combined studies: CDK18 rs138760780 (OR = 2.60 95% confidence interval [1.75–3.85], p = 2.02 × 10⁻⁶), FAM189A2 rs12344245 (OR = 1.85 [1.41–2.43], p = 8.52 × 10⁻⁶) and PKD1 rs116092985 (OR = 1.53 [1.27–1.85], p = 1.01 × 10⁻⁵). In addition, our analyses suggested that genetic variations at the ANKS1A, COL4A2 and APOE loci previously found associated with coronary artery disease in the general population could have stronger effects in patients with type 1 diabetes.
Conclusions: This study suggests three novel candidate genes for coronary artery disease in the subgroup of
patients affected with type 1 diabetes. The detected associations deserve to be definitively validated in additional epidemiological studies.
Keywords: Type 1 diabetes, Coronary artery disease, Diabetic nephropathy, Genome‑wide association study, Case
control study, Epidemiology, Genetic association studies, Meta‑analysis
© The Author(s) 2018. This article is distributed under the terms of the Creative Commons Attribution 4.0 International License (http://creativecommons.org/licenses/by/4.0/), which permits unrestricted use, distribution, and reproduction in any medium, provided you give appropriate credit to the original author(s) and the source, provide a link to the Creative Commons license, and indicate if changes were made. The Creative Commons Public Domain Dedication waiver (http://creativecommons.org/ publicdomain/zero/1.0/) applies to the data made available in this article, unless otherwise stated.
Open Access
Cardiovascular Diabetology
*Correspondence: david.tregouet@upmc.fr; samy.hadjadj@gmail.com
†David‑Alexandre Trégouët and Samy Hadjadj contributed equally to the
work
1 Institut National pour la Santé et la Recherche Médicale (INSERM),
Unité Mixte de Recherche en Santé (UMR_S) 1166, Team Genomics & Pathophysiology of Cardiovascular Diseases, Sorbonne Universités, UPMC Univ. Paris 06, Paris, France
12 Service d’Endocrinologie‑Diabétologie and Centre d’Investigation
Clinique, CHU de Poitiers, BP 577, 86021 Poitiers Cedex, France Full list of author information is available at the end of the article
Background
Type 1 diabetes (T1D) is a chronic disease characterized by an increase in blood glucose due to a lack of insulin production. Diabetes is a major health concern globally with a prevalence ranging between 4 and 7.8% in indus-trialized countries [1, 2]; among persons with diabetes, it is estimated that 5–10% are affected with T1D [3]. Recent large-scale epidemiological studies suggest that T1D is associated with a reduced lifespan of approximately 12 years [4] due to at least two-fold increased risk for death due to cardiovascular (CV) events.
Of note, in a nation-based registry of type 1 diabetes, coronary heart disease was 4 times more prevalent in patients with type 1 diabetes compared to sex- and age-matched controls [5].
However, studies exploring cardiovascular disease (CVD) risk variants in T1D patients are lacking. Tradi-tional risk factors for CVD including age, circulating lipid levels, and smoking are well established in the gen-eral population [6] and in patients with type 1 diabetes [7]. Coronary artery disease (CAD) could be strongly influenced by genetic factors [8]. However, to the best of our knowledge, the relationship between genetic factors and CAD in type 1 diabetes was largely examined with a candidate gene approach [9–12]. Another important question is whether genetic markers of CAD established in the general population, known to roughly explain 10% of the heritability [13, 14], also play a role in individuals with T1D.
In an attempt to unravel the genetic determinants of CAD among T1D patients, we examined the association of genome-wide genotype array data with CAD in multi-ple T1D cohorts of European descent (The British Isles, Denmark and France).
Materials and methods General workflow
The present work reports the results of a two-stage research strategy for common genetic variations associ-ated with CAD risk in T1D patients. The first (discovery) stage was based on the meta-analysis of three GWAS cohorts totaling 434 T1D patients with CAD (cases) and 3123 T1D patients with no evidence of CAD (controls). The second stage consisted of a replication of the top dis-covery signals with association p < 10−5 in five additional
T1D studies totaling 585 cases and 2612 controls.
Participating cohorts for the discovery and replication stages
All participants were patients with T1D diagnosed using ADA criteria [15].
Controls were patients with T1D without history of CAD while cases were patients with T1D and a personal
history of myocardial infarction or coronary artery revas-cularization (coronary artery angioplasty or by-pass grafting).
The discovery phase was composed of European-ances-try adults from (1) France (pooled cohorts of T1D from Corbeil Essonnes, Poitiers, Nantes, Paris, Toulouse [16] and two large scale multicenter cohorts i.e. GENESIS/ GENEDIAB [16]), (2) Denmark (After-EU cohort [17]) and (3) British Isles (UK-ROI study [18]). The replication phase included five independent T1D cohorts recruited in North America (Additional file 1: Table S1).
All participating studies were approved by their respec-tive institutional review board/ethics committee and an informed consent was obtained from all participating individuals.
Genotype determinations and imputation
For each participating study, DNA samples were geno-typed with high-density SNP arrays and further imputed for SNPs available in the 1000 Genomes reference data-set. Summary descriptions of genotyping technologies, quality control procedures, and used imputation meth-ods (MACH/Impute2) are shown in Additional file 1: Table S1.
Discovery phase: meta‑analysis of discovery GWAS
Association analyses of imputed SNPs with CAD risk were performed separately in each study. Analyses were performed using either of the MACH [19], Quicktest (http://toby.freeshell.org/software/quicktest.shtml), or Plink [20] analyses tools implementing a logistic regression model where the allele dosage represent-ing the expected number of a given reference allele at the imputed SNP was used as covariate to estimate SNP effect. Analyses were adjusted for sex, age, DN status and potential population sub-structure as defined by SNPs derived principal components.
Only SNPs with acceptable imputation quality (r2 > 0.3)
in the three discovery cohorts and with estimated minor allele frequency (MAF) ≥ 1% were kept for meta-analy-sis. This was performed by use of a fixed-effects model based on the inverse-variance weighting method as implemented in the METAL software [21]. The statistical threshold (p < 5 × 10⁻⁸) was used for declaring
genome-wide statistical significance while controlling for the number of independent tests across the genome. The Cochran’s Q statistic was used to assess heterogeneity of the SNP associations across studies whose magnitude was expressed by the I2 index [22]. Power calculations
were performed using the CaTS power calculator (http:// csg.sph.umich.edu/abecasis/cats/) [23].
Page 3 of 10 Charmet et al. Cardiovasc Diabetol (2018) 17:61
Replication phase
Similar logistic regression models as those employed in the discovery were used for assessing the association of tested SNPs with CAD risk (Additional file 1: Table S1). Results obtained in the independent replication cohorts were then meta-analyzed using the same methodology as in the discovery step. The Bonferroni threshold corre-sponding to 0.05 divided by the number of tested SNPs was used to declare statistical replication. Unilateral hypothesis testing was adopted at the replication stage. For SNPs that replicated, a meta-analysis of the com-bined discovery and replications cohorts was performed to produce a more robust estimate of the effect size.
Results
A total of 6,728,637 imputed SNPs were tested for associa-tion with CAD in 3557 T1D patients made of 434 with CAD cases and 3123 controls in the discovery dataset. The meta-analysis results of the discovery GWAS have been summa-rized in the Manhattan and QQ plots shown in Additional file 2: Figure S1, Additional file 3: Figure S2, respectively.
One locus at chromosome 5q13.2 reached genome-wide significance (p < 5 × 10⁻⁸) with the lead SNP,
rs115829748, located upstream of the MAP1B gene. The T allele of this low frequency SNP (MAF ~ 0.04), was associated with an Odds Ratio (OR) of 3.16 [95% confi-dence interval (CI) 2.18–4.59] (p = 1.36 × 10⁻⁹). No other
SNP demonstrated suggestive association with CAD at this locus (Additional file 4: Figure S3).
At the p < ~ 1.0 × 10⁻⁵ threshold, 20 additional loci
demonstrated evidence for suggestive association with CAD with little heterogeneity across cohorts (Table 1). Imputation metrics of the top SNPs are provided in the Additional file 5: Table S2. Therefore, we sought to rep-licate the top 21 signals in five independent T1D cohorts totaling 585 CAD cases and 2612 controls. Replication was feasible for 17 SNPs while four SNPs (rs34319244, rs373009901, rs143723948, rs571622299) were not prop-erly imputed in the replication stage (Table 1). While none of the 17 SNPs reached the pre-specified Bonfer-roni threshold of 3.0 × 10⁻³ for positive statistical
replica-tion, three were however nominally (p < 0.05) associated with CAD in the replication stage, with genetic effects consistent between the discovery and replication studies (Table 1). Of note, no trend for association was observed (p = 0.279) with the MAP1B rs115829748 that came out first in the discovery GWAS and that showed similar allele frequencies in the discovery and replication studies.
The strongest association was observed at the CDK18 locus where, in the replication stage, the rs138760780-T allele, with frequency 0.02, was associated with an increased odds ratio (OR) for disease of 1.88 [1.07– 3.31] (p = 0.014). This value has to compare with 3.48
[2.00–6.04] observed in the discovery cohorts. In the combined discovery and replication cohorts, the meta-analyzed OR associated with the rs138760780 T allele was 2.60 [1.75–3.85] (p = 2.02 × 10⁻⁶) with no heterogeneity
across the discovery and replication stage (p = 0.545). The second suggestive association holds at the
FAM189A2 locus. The rs12344245-G allele found
associ-ated with an increased OR of 2.52 [1.68–3.81] in the dis-covery cohorts also demonstrated a trend for association with the disease in the replication stage, OR = 1.45 [1.01– 2.08] (p = 0.022). Combining the discovery and replica-tion study led to a meta-analyzed OR for disease of 1.85 [1.41–2.43] (p = 8.52 × 10⁻⁶) with no significant evidence
for heterogeneity across stage (p = 0.426).
The third suggestive association was observed for the
PKD1 locus. The rs116092985 minor G associated with
a 1.85 [1.408–2.44] and a 1.29 [1.00–1.67] increased risk of CAD in the discovery and replication cohorts, respectively. Altogether, the combined statistical evi-dence for association of the rs116092985-G allele reached p = 1.01 × 10⁻⁵ (OR = 1.53 [1.27–1.85]) (p = 0.220 for
heterogeneity across studies).
Candidate CAD SNPs
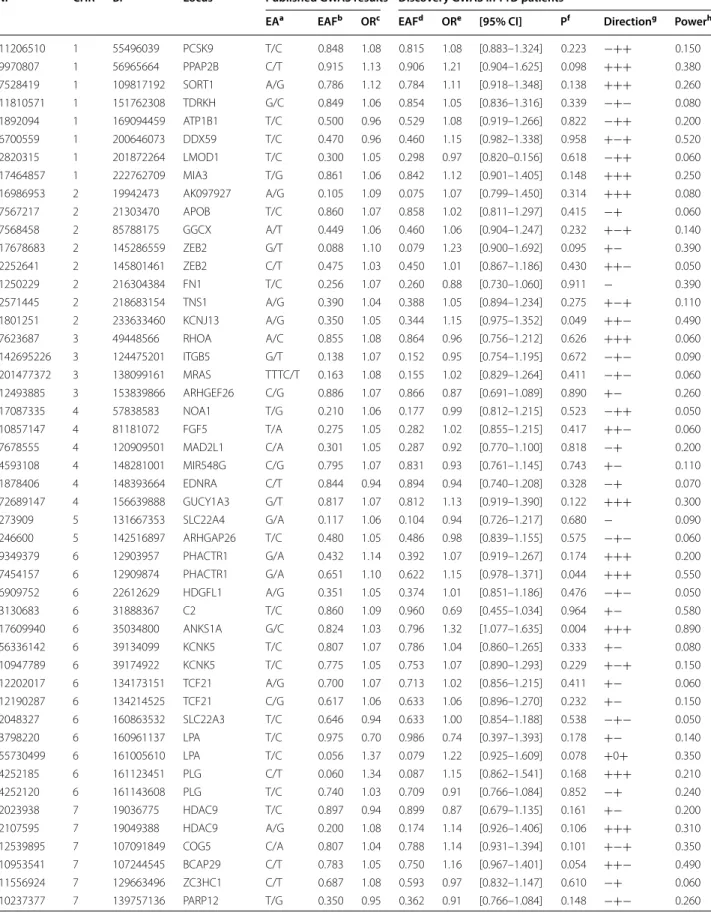
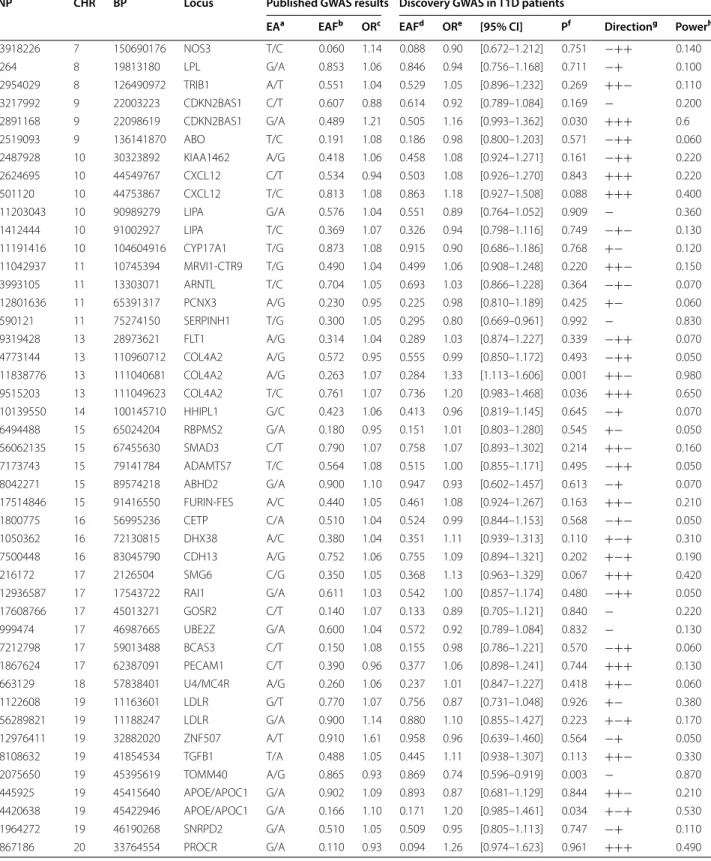
About 90 loci have been found, through GWAS studies, to harbor common susceptibility alleles associated with CAD in the general population. We sought to investi-gate how these loci associate with CAD in T1D patients. Results of this investigation are summarized in Table 2. From CAD SNPs identified in previous GWAS [13, 14,
24–26], 95 were well imputed in our discovery phase and showed genetic effects with directionality in our T1D populations that were consistent with those previ-ously reported (Table 2). Imputation quality for these 95 SNPs is given in Additional file 6: Table S3. For three SNPs ANKS1A_rs17609940, COL4A2_rs11838776 and
TOMM40_rs2075650 (near the APOE locus), the
statisti-cal evidence for association with the disease was rather strong with p < 5 × 10⁻³ even though it did not achieve
multiple testing correction for the number of tested SNPs (~ 5 × 10−4 = 0.05/95). For these three SNPs, the
ampli-tude of the genetic association even tended to be stronger in our T1D patients than that previously reported (Table 2). As an illustration, in our discovery T1D popu-lation, the COL4A1 rs11838776-A allele was associated with an OR of 1.33 [1.11–1.61] while the OR reported in the literature was slightly lower (OR = 1.07). Conversely, the association of the polymorphism at the non-coding ANRIL loci on 9p21, that is known to associate the most with CAD among common polymorphisms, showed a very similar association in our T1D patients (OR = 1.16 [0.993–1.362], p = 0.03) compared to that previously reported (OR ~ 1.21).
Table 1 L ead SNP s in disc ov er y and r eplic ation a Estima
ted allele/non estima
ted allele b A llele fr equenc y of the estima te allele c O dds r atio f or disease d A ssocia tion p v alue der iv ed fr om the meta-analy sis of the thr ee disc ov er y c ohor ts e Dir ec tionalit y of the eff ec ts acr oss the c on tr ibuting c ohor ts f I 2 sta tistics f or het er ogeneit y acr oss the c on tr ibuting c ohor ts g p v alue f or homogeneit y acr oss the c on tr ibuting c ohor ts h One sided t est p v alue of associa tion D isc ov er y Replica tion CHR BP Locus SNP Type of v aria tion EA/NEA a EAF b OR c P d D irec tion e I 2 f Phet g EAF OR P h D irec tion I 2 Phet 1 205484373 CDK18 rs138760780 Intr onic T/C 0.018 3.48 9.20 10 − 6 +++ 0 0.943 0.020 1.88 0.014 ++++− 0 0.509 2 97455276 CNNM4 rs116656846 Intr onic A/G 0.023 2.57 9.88 10 − 6 +++ 0 0.661 0.028 0.89 0.696 −+− 0 0.876 2 155225182 GALNT13 rs17206992 Intr onic G/A 0.057 2.32 6.33 10 − 6 +++ 0 0.817 0.052 0.97 0.580 ++−+− 0 0.934 2 177645590 A C092162.1 rs113517532 Int er genic A GA T/A 0.106 1.75 1.90 10 − 6 +++ 0 0.912 0.105 0.86 0.887 +−+− 0 0.658 3 13370674 NUP210 rs73018809 Intr onic T/A 0.024 3.50 1.89 10 − 7 +++ 59.1% 0.087 0.022 0.60 0.955 −+ 0 0.722 3 103975418 MIR548A3 rs28641753 Int er genic T/C 0.071 2.10 1.59 10 − 7 +++ 0 0.863 0.067 1.02 0.440 −++− 62.70% 0.030 4 6171230 JAKMIP1 rs78031527 Intr onic T/C 0.201 1.70 5.41 10 − 6 +++ 0 0.493 0.209 1.13 0.114 ++−+− 0 0.622 5 10500646 ROPN1L rs143537377 Intr onic C/A 0.096 1.88 7.89 10 − 6 +++ 1.1% 0.577 0.100 0.85 0.885 −+−+ 19.20% 0.292 5 71394387 M AP1B rs115829748 Int er genic T/C 0.040 3.16 1.36 10 − 9 +++ 71.9% 0.028 0.036 1.13 0.283 −+++− 0 0.655 6 95557471 M ANEA ‑AS1 rs9354144 Int er genic A/T 0.105 1.71 5.78 10 − 6 +++ 0 0.785 0.097 1.05 0.330 −++− 23.90% 0.262 8 73842523 KCNB2 rs571622299 Intr onic A/G 0.015 4.12 6.47 10 − 6 +++ 47.2% 0.150 NA NA NA NA NA NA 9 37034095 PA X5 rs143723948 UTR5 T/C 0.499 1.65 6.01 10 − 7 +++ 0 0.985 NA NA NA NA NA NA 9 71955717 FA M189A2 rs12344245 Intr onic G/A 0.035 2.52 9.23 10 − 6 +++ 0 0.950 0.038 1.45 0.022 +−+++ 0 0.560 10 19457387 ARL5B rs117826205 Intr onic C/T 0.026 2.72 6.30 10 − 6 +++ 0 0.482 0.029 1.11 0.315 −++ 5.70% 0.374 11 8080425 TUB rs61879614 Intr onic C/T 0.048 2.94 2.60 10 − 6 +++ 9.4% 0.332 0.046 1.11 0.300 +− 0 0.775 16 2160973 PKD1 rs116092985 M issense ( W1399R) G/A 0.097 1.85 1.72 10 − 5 +++ 29.5% 0.242 0.096 1.29 0.026 ++++− 0 0.488 17 4328164 SPNS3 rs34319244 Int er genic C/C T 0.440 1.51 2.59 10 − 6 +++ 48.8% 0.142 NA NA NA NA NA NA 18 45399356 SM AD2 rs113114656 Intr onic T/C 0.040 2.67 2.30 10 − 6 +++ 2.4% 0.359 0.038 1.04 0.437 −++−+ 43.40% 0.132 21 21347156 NCRNA00320 rs67213764 Int er genic G/A 0.261 1.48 9.28 10 − 6 +++ 0 0.536 0.260 1.03 0.363 ++− 32.20% 0.207 21 24929109 AP000459.7 rs12482425 Int er genic A/G 0.314 0.66 9.33 10 − 6 − 0 0.509 0.308 1.09 0.871 +++++ 0 0.931 22 25988780 ADRBK2 rs373009901 Intr onic C/G 0.019 3.94 9.42 10 − 6 +++ 0 0.599 NA NA NA NA NA NA
Page 5 of 10 Charmet et al. Cardiovasc Diabetol (2018) 17:61
Table 2 Replication of CAD SNPs previously identified in the general population
SNP CHR BP Locus Published GWAS results Discovery GWAS in T1D patients
EAa EAFb ORc EAFd ORe [95% CI] Pf Directiong Powerh
rs11206510 1 55496039 PCSK9 T/C 0.848 1.08 0.815 1.08 [0.883–1.324] 0.223 −++ 0.150 rs9970807 1 56965664 PPAP2B C/T 0.915 1.13 0.906 1.21 [0.904–1.625] 0.098 +++ 0.380 rs7528419 1 109817192 SORT1 A/G 0.786 1.12 0.784 1.11 [0.918–1.348] 0.138 +++ 0.260 rs11810571 1 151762308 TDRKH G/C 0.849 1.06 0.854 1.05 [0.836–1.316] 0.339 −+− 0.080 rs1892094 1 169094459 ATP1B1 T/C 0.500 0.96 0.529 1.08 [0.919–1.266] 0.822 −++ 0.200 rs6700559 1 200646073 DDX59 T/C 0.470 0.96 0.460 1.15 [0.982–1.338] 0.958 +−+ 0.520 rs2820315 1 201872264 LMOD1 T/C 0.300 1.05 0.298 0.97 [0.820–0.156] 0.618 −++ 0.060 rs17464857 1 222762709 MIA3 T/G 0.861 1.06 0.842 1.12 [0.901–1.405] 0.148 +++ 0.250 rs16986953 2 19942473 AK097927 A/G 0.105 1.09 0.075 1.07 [0.799–1.450] 0.314 +++ 0.080 rs7567217 2 21303470 APOB T/C 0.860 1.07 0.858 1.02 [0.811–1.297] 0.415 −+ 0.060 rs7568458 2 85788175 GGCX A/T 0.449 1.06 0.460 1.06 [0.904–1.247] 0.232 +−+ 0.140 rs17678683 2 145286559 ZEB2 G/T 0.088 1.10 0.079 1.23 [0.900–1.692] 0.095 +− 0.390 rs2252641 2 145801461 ZEB2 C/T 0.475 1.03 0.450 1.01 [0.867–1.186] 0.430 ++− 0.050 rs1250229 2 216304384 FN1 T/C 0.256 1.07 0.260 0.88 [0.730–1.060] 0.911 − 0.390 rs2571445 2 218683154 TNS1 A/G 0.390 1.04 0.388 1.05 [0.894–1.234] 0.275 +−+ 0.110 rs1801251 2 233633460 KCNJ13 A/G 0.350 1.05 0.344 1.15 [0.975–1.352] 0.049 ++− 0.490 rs7623687 3 49448566 RHOA A/C 0.855 1.08 0.864 0.96 [0.756–1.212] 0.626 +++ 0.060 rs142695226 3 124475201 ITGB5 G/T 0.138 1.07 0.152 0.95 [0.754–1.195] 0.672 −+− 0.090 rs201477372 3 138099161 MRAS TTTC/T 0.163 1.08 0.155 1.02 [0.829–1.264] 0.411 −+− 0.060 rs12493885 3 153839866 ARHGEF26 C/G 0.886 1.07 0.866 0.87 [0.691–1.089] 0.890 +− 0.260 rs17087335 4 57838583 NOA1 T/G 0.210 1.06 0.177 0.99 [0.812–1.215] 0.523 −++ 0.050 rs10857147 4 81181072 FGF5 T/A 0.275 1.05 0.282 1.02 [0.855–1.215] 0.417 ++− 0.060 rs7678555 4 120909501 MAD2L1 C/A 0.301 1.05 0.287 0.92 [0.770–1.100] 0.818 −+ 0.200 rs4593108 4 148281001 MIR548G C/G 0.795 1.07 0.831 0.93 [0.761–1.145] 0.743 +− 0.110 rs1878406 4 148393664 EDNRA C/T 0.844 0.94 0.894 0.94 [0.740–1.208] 0.328 −+ 0.070 rs72689147 4 156639888 GUCY1A3 G/T 0.817 1.07 0.812 1.13 [0.919–1.390] 0.122 +++ 0.300 rs273909 5 131667353 SLC22A4 G/A 0.117 1.06 0.104 0.94 [0.726–1.217] 0.680 − 0.090 rs246600 5 142516897 ARHGAP26 T/C 0.480 1.05 0.486 0.98 [0.839–1.155] 0.575 −+− 0.060 rs9349379 6 12903957 PHACTR1 G/A 0.432 1.14 0.392 1.07 [0.919–1.267] 0.174 +++ 0.200 rs7454157 6 12909874 PHACTR1 G/A 0.651 1.10 0.622 1.15 [0.978–1.371] 0.044 +++ 0.550 rs6909752 6 22612629 HDGFL1 A/G 0.351 1.05 0.374 1.01 [0.851–1.186] 0.476 −+− 0.050 rs3130683 6 31888367 C2 T/C 0.860 1.09 0.960 0.69 [0.455–1.034] 0.964 +− 0.580 rs17609940 6 35034800 ANKS1A G/C 0.824 1.03 0.796 1.32 [1.077–1.635] 0.004 +++ 0.890 rs56336142 6 39134099 KCNK5 T/C 0.807 1.07 0.786 1.04 [0.860–1.265] 0.333 +− 0.080 rs10947789 6 39174922 KCNK5 T/C 0.775 1.05 0.753 1.07 [0.890–1.293] 0.229 +−+ 0.150 rs12202017 6 134173151 TCF21 A/G 0.700 1.07 0.713 1.02 [0.856–1.215] 0.411 +− 0.060 rs12190287 6 134214525 TCF21 C/G 0.617 1.06 0.633 1.06 [0.896–1.270] 0.232 +− 0.150 rs2048327 6 160863532 SLC22A3 T/C 0.646 0.94 0.633 1.00 [0.854–1.188] 0.538 −+− 0.050 rs3798220 6 160961137 LPA T/C 0.975 0.70 0.986 0.74 [0.397–1.393] 0.178 +− 0.140 rs55730499 6 161005610 LPA T/C 0.056 1.37 0.079 1.22 [0.925–1.609] 0.078 +0+ 0.350 rs4252185 6 161123451 PLG C/T 0.060 1.34 0.087 1.15 [0.862–1.541] 0.168 +++ 0.210 rs4252120 6 161143608 PLG T/C 0.740 1.03 0.709 0.91 [0.766–1.084] 0.852 −+ 0.240 rs2023938 7 19036775 HDAC9 T/C 0.897 0.94 0.899 0.87 [0.679–1.135] 0.161 +− 0.200 rs2107595 7 19049388 HDAC9 A/G 0.200 1.08 0.174 1.14 [0.926–1.406] 0.106 +++ 0.310 rs12539895 7 107091849 COG5 C/A 0.807 1.04 0.788 1.14 [0.931–1.394] 0.101 +−+ 0.350 rs10953541 7 107244545 BCAP29 C/T 0.783 1.05 0.750 1.16 [0.967–1.401] 0.054 ++− 0.490 rs11556924 7 129663496 ZC3HC1 C/T 0.687 1.08 0.593 0.97 [0.832–1.147] 0.610 −+ 0.060 rs10237377 7 139757136 PARP12 T/G 0.350 0.95 0.362 0.91 [0.766–1.084] 0.148 −+− 0.260
Table 2 continued
SNP CHR BP Locus Published GWAS results Discovery GWAS in T1D patients
EAa EAFb ORc EAFd ORe [95% CI] Pf Directiong Powerh
rs3918226 7 150690176 NOS3 T/C 0.060 1.14 0.088 0.90 [0.672–1.212] 0.751 −++ 0.140 rs264 8 19813180 LPL G/A 0.853 1.06 0.846 0.94 [0.756–1.168] 0.711 −+ 0.100 rs2954029 8 126490972 TRIB1 A/T 0.551 1.04 0.529 1.05 [0.896–1.232] 0.269 ++− 0.110 rs3217992 9 22003223 CDKN2BAS1 C/T 0.607 0.88 0.614 0.92 [0.789–1.084] 0.169 − 0.200 rs2891168 9 22098619 CDKN2BAS1 G/A 0.489 1.21 0.505 1.16 [0.993–1.362] 0.030 +++ 0.6 rs2519093 9 136141870 ABO T/C 0.191 1.08 0.186 0.98 [0.800–1.203] 0.571 −++ 0.060 rs2487928 10 30323892 KIAA1462 A/G 0.418 1.06 0.458 1.08 [0.924–1.271] 0.161 −++ 0.220 rs2624695 10 44549767 CXCL12 C/T 0.534 0.94 0.503 1.08 [0.926–1.270] 0.843 +++ 0.220 rs501120 10 44753867 CXCL12 T/C 0.813 1.08 0.863 1.18 [0.927–1.508] 0.088 +++ 0.400 rs11203043 10 90989279 LIPA G/A 0.576 1.04 0.551 0.89 [0.764–1.052] 0.909 − 0.360 rs1412444 10 91002927 LIPA T/C 0.369 1.07 0.326 0.94 [0.798–1.116] 0.749 −+− 0.130 rs11191416 10 104604916 CYP17A1 T/G 0.873 1.08 0.915 0.90 [0.686–1.186] 0.768 +− 0.120 rs11042937 11 10745394 MRVI1‑CTR9 T/G 0.490 1.04 0.499 1.06 [0.908–1.248] 0.220 ++− 0.150 rs3993105 11 13303071 ARNTL T/C 0.704 1.05 0.693 1.03 [0.866–1.228] 0.364 −+− 0.070 rs12801636 11 65391317 PCNX3 A/G 0.230 0.95 0.225 0.98 [0.810–1.189] 0.425 +− 0.060 rs590121 11 75274150 SERPINH1 T/G 0.300 1.05 0.295 0.80 [0.669–0.961] 0.992 − 0.830 rs9319428 13 28973621 FLT1 A/G 0.314 1.04 0.289 1.03 [0.874–1.227] 0.339 −++ 0.070 rs4773144 13 110960712 COL4A2 A/G 0.572 0.95 0.555 0.99 [0.850–1.172] 0.493 −++ 0.050 rs11838776 13 111040681 COL4A2 A/G 0.263 1.07 0.284 1.33 [1.113–1.606] 0.001 ++− 0.980 rs9515203 13 111049623 COL4A2 T/C 0.761 1.07 0.736 1.20 [0.983–1.468] 0.036 +++ 0.650 rs10139550 14 100145710 HHIPL1 G/C 0.423 1.06 0.413 0.96 [0.819–1.145] 0.645 −+ 0.070 rs6494488 15 65024204 RBPMS2 G/A 0.180 0.95 0.151 1.01 [0.803–1.280] 0.545 +− 0.050 rs56062135 15 67455630 SMAD3 C/T 0.790 1.07 0.758 1.07 [0.893–1.302] 0.214 ++− 0.160 rs7173743 15 79141784 ADAMTS7 T/C 0.564 1.08 0.515 1.00 [0.855–1.171] 0.495 −++ 0.050 rs8042271 15 89574218 ABHD2 G/A 0.900 1.10 0.947 0.93 [0.602–1.457] 0.613 −+ 0.070 rs17514846 15 91416550 FURIN‑FES A/C 0.440 1.05 0.461 1.08 [0.924–1.267] 0.163 ++− 0.210 rs1800775 16 56995236 CETP C/A 0.510 1.04 0.524 0.99 [0.844–1.153] 0.568 −+− 0.050 rs1050362 16 72130815 DHX38 A/C 0.380 1.04 0.351 1.11 [0.939–1.313] 0.110 +−+ 0.310 rs7500448 16 83045790 CDH13 A/G 0.752 1.06 0.755 1.09 [0.894–1.321] 0.202 +−+ 0.190 rs216172 17 2126504 SMG6 C/G 0.350 1.05 0.368 1.13 [0.963–1.329] 0.067 +++ 0.420 rs12936587 17 17543722 RAI1 G/A 0.611 1.03 0.542 1.00 [0.857–1.174] 0.480 −++ 0.050 rs17608766 17 45013271 GOSR2 C/T 0.140 1.07 0.133 0.89 [0.705–1.121] 0.840 − 0.220 rs999474 17 46987665 UBE2Z G/A 0.600 1.04 0.572 0.92 [0.789–1.084] 0.832 − 0.130 rs7212798 17 59013488 BCAS3 C/T 0.150 1.08 0.155 0.98 [0.786–1.221] 0.570 −++ 0.060 rs1867624 17 62387091 PECAM1 C/T 0.390 0.96 0.377 1.06 [0.898–1.241] 0.744 +++ 0.130 rs663129 18 57838401 U4/MC4R A/G 0.260 1.06 0.237 1.01 [0.847–1.227] 0.418 ++− 0.060 rs1122608 19 11163601 LDLR G/T 0.770 1.07 0.756 0.87 [0.731–1.048] 0.926 +− 0.380 rs56289821 19 11188247 LDLR G/A 0.900 1.14 0.880 1.10 [0.855–1.427] 0.223 +−+ 0.170 rs12976411 19 32882020 ZNF507 A/T 0.910 1.61 0.958 0.96 [0.639–1.460] 0.564 −+ 0.050 rs8108632 19 41854534 TGFB1 T/A 0.488 1.05 0.445 1.11 [0.938–1.307] 0.113 ++− 0.330 rs2075650 19 45395619 TOMM40 A/G 0.865 0.93 0.869 0.74 [0.596–0.919] 0.003 − 0.870 rs445925 19 45415640 APOE/APOC1 G/A 0.902 1.09 0.893 0.87 [0.681–1.129] 0.844 ++− 0.210 rs4420638 19 45422946 APOE/APOC1 G/A 0.166 1.10 0.171 1.20 [0.985–1.461] 0.034 +−+ 0.530 rs1964272 19 46190268 SNRPD2 G/A 0.510 1.05 0.509 0.95 [0.805–1.113] 0.747 −+ 0.110 rs867186 20 33764554 PROCR G/A 0.110 0.93 0.094 1.26 [0.974–1.623] 0.961 +++ 0.490
Page 7 of 10 Charmet et al. Cardiovasc Diabetol (2018) 17:61
Discussion
The present work was aimed at identifying suscepti-bility alleles for CAD risk in patient population of T1D using a GWAS approach with a two-step framework (discovery + replication). Albeit we identified one locus (MAP1B) reaching genome-wide significance in the dis-covery stage, it did not replicate with similar effects. Nev-ertheless, in the combined T1D dataset of 1019 cases and 5735 controls, we observed strong statistical evidence for association with CAD at three biological candidate genes,
CDK18, PKD1 and FAM189A2.
We consider our study as very original as it is the first one, to the best of our knowledge, to use a GWAS approach for CAD, in patients with type 1 diabetes. We have thus pooled the largest collection of type 1 diabetes patients with available genetic data.
The low frequency CDK18 rs138760780-T allele (fre-quency ~ 0.02) was found associated with ~ 2.5 fold increased risk of CAD. According to public database (e.g. Haploreg [27]), this SNP does not show strong linkage disequilibrium (LD) (pairwise r2 > 0.80) with other SNPs
at this locus, consistent with the regional association plot that does not suggest any evidence of disease asso-ciated SNPs (Additional file 7: Figure S4). Interrogating the functional status of this SNP through HaploReg tool [27] suggested that this SNP may be involved in some epigenetic regulatory mechanisms. CDK18 encodes for a cyclin-dependent kinase, suggesting a role in cell cycle. This predicted protein is also related to CDK1, which is involved in the G2/M transition in eukaryotic cells [28]. Although cell cycle is a very broad pathway, CDK1 has also been associated with T1D [29], but at this point little is known about a potential involvement of CDK18 in the pathophysiology of T1D or its complications.
We also observed some evidence that the low frequency
FAM189A2 rs12344245 G allele, (frequency ~ 0.04),
asso-ciated with a ~ 1.8 fold-increased risk of CAD. We did not find any evidence suggesting that this intronic SNP, or any other SNPs in LD (Additional file 8: Figure S5: regional association plot) with it, could be functional. Nevertheless, even though not much is known about the role of the encoded protein, this locus is a good candi-date. Indeed, genetic variations at this locus have been found associated with albumin to creatinine ratio [30]. More interestingly, two FAM189A2 SNPs (rs10780297 and rs10120442) have been reported to moderately associate (p = 9.3 × 10⁻⁴) in a large GWAS for CAD
in ~ 63,000 non-diabetic populations [14], suggesting that this locus could be a CAD locus in some specific at-risk groups of diabetic patients. The latter two SNPs are in moderate LD (D’ = 1 but r2 = 0.05) with our lead
rs12344245 SNP, indicating that a fine mapping analysis of this locus would warrant further investigations. Of interest, it was not identified as a common gene in both type 2 diabetes and CAD. It can thus be speculated this gene is an important gene in high-glucose environment rather than a gene leading to high-glucose.
Finally, we observed an association of the non-syn-onymous PKD1 rs116092985 (Trp1399Arg) with CAD among T1D patients where the Arg1399 minor allele (fre-quency ~ 0.10), was associated with an increased CAD risk (OR ~ 1.5). The regional plot (Additional file 9: Fig-ure S6) shows that there are several SNPs in LD with this
PKD1 top SNP that associate with CAD. PKD1 encodes
for the Polycystin 1, Transient Receptor Potential Chan-nel Interacting protein, a member of the polycystin pro-tein family. Recent reports have suggested a role of PKD1 not only in renal tubular function and structure [31]
a Estimated allele/non estimated allele
b Allele frequency of the estimate allele reported in [14, 24–26] c Odds ratio for CAD reported in [14, 24–26]
d Allele frequency of the estimated allele in the discovery GWAS of T1D patients
e Odds ratio for CAD [95% confidence interval] observed in the discovery GWAS of T1D patients f One sided test p value of association
g Directionality of the effects across the contributing cohorts
h Power estimates were provided by the CaTS program [23] and correspond to the power of our discovery GWAS to achieve 0.05 statistical significance at the observed associations based on EAFd and ORe under the assumption of a multiplicative model (on log-scale)
SNP CHR BP Locus Published GWAS results Discovery GWAS in T1D patients
EAa EAFb ORc EAFd ORe [95% CI] Pf Directiong Powerh
rs28451064 21 35593827 KCNE2 A/G 0.121 1.14 0.126 1.36 [1.066–1.751] 0.006 +−+ 0.890
rs180803 22 24658858 POM121L9P G/T 0.970 1.20 0.979 1.18 [0.510–2.743] 0.348 −++ 0.120
but rare mutations in this gene as the main also cause underlying polycystic kidney disease [32], highlighting its importance in kidney complications. One impor-tant question is whether PKD1 risk allele is involved in a common genetic background linking DN and CAD. This question was not duly analyzed due to power issue. How-ever, no clear association was established with DN in pre-vious GWAS focusing on this question [18].
Our study also enabled us to assess in patients with T1D the impact of common SNPs that have been found associated with CAD in large GWAS performed in unse-lected individuals. Beyond the observation that most of the previously reported SNPs showed consistent associa-tion with CAD in our T1D populaassocia-tion, this look-up iden-tified a few CAD loci (ANKS1A, COL4A2, TOMM40/
APOE) where the reported CAD associated SNP could
have a stronger effect in T1D patients. However, this hypothesis would require further investigation.
Some limitations must be acknowledged. We did not consider differently T1D patients with and without DN, and all of the analyses were not stratified on DN status in order to keep all CAD patients in the analysis. How-ever, this should have limited impact on our main results as none of the SNPs identified here were positive con-sidering previously reported GWAS with regard to DN as primary endpoint [18]. Another limitation pertains to limited power of our sample size required, particular to overcome the harsh genome-wide statistical significance threshold. Indeed, our discovery GWAS was not well powered to identify common SNPs associated with mod-erate genetic effects as those frequently encountered in a GWAS context. For instance, our discovery study had no power to detect at the genome-wide statistical threshold the genetic effect of a variant with an associated allelic OR less than 1.40. It was only well powered (> 80%) to detect OR greater than 1.6 as soon as the allele frequency of the disease allele is greater than 0.28 and well pow-ered to detect OR greater than ~ 2 for allele frequency greater than 0.05. In particular, we had no power to detect the well-established association of the 9p21 locus at the 5 × 10⁻⁸ threshold while we had a chance of 60%
to detect it would the liberal threshold of 0.05 had been used. Similarly, we acknowledge the low power of our replication studies where none of the tested associations achieved the Bonferroni threshold of 3 × 10⁻³. We only
had a power of 53, 38 and 26% to detect at this threshold a significant association at the CDK18 rs13876070, PKD1 rs116092985 and the FAM189A2 loci, respectively.
Despite these limitations, we have assembled the larg-est cohort available and conducted novel analyses to dis-cover novel candidate loci for CAD in T1D patients that need to be further studied with additional epidemiologi-cal data and functional work to confirm our findings. Of
interest, our negative study could suggest a role of epige-netics beyond genomics. In this regard, insulin promotes the expression of DNA methyltransferases leading to methylation resulting in atherosclerosis [33], broadening the research field of CAD in type 1 diabetes.
Conclusions
We identified three new candidate loci for CAD in indi-viduals with T1D, these loci weren’t previously found associated with CAD in the general population. Three other loci previously reported in the general population were found associated with CAD in our setting, namely
ANKS1A, COL4A2 and TOMM40/APOE. Although this
work needs further investigation, studying the function of these loci could lead to a better understanding of the physiological pathways involved in the development of CAD as a complication of T1D.
Abbreviations
CAD: coronary artery disease; T1D: type 1 diabetes; GWAS: genome wide association study; CVD: cardiovascular disease; DN: diabetic nephropathy; SNP: single nucleotide polymorphism; MAF: minor allele frequency; OR: odds ratio; LD: linkage disequilibrium; CI: confidence interval.
Authors’ contributions
RC performed the GWAS for the French cohort as well as the meta‑analyses for the three discovery cohorts and the five replication cohorts. SD performed the GWAS for the Ireland‑UK cohort. SK performed the GWASes for the five replication cohorts. TSA performed the GWAS for the Danish cohort. DAT and SH interpreted the results of the analysis and contributed in writing the manuscript. All authors read and approved the final manuscript.
Author details
1 Institut National pour la Santé et la Recherche Médicale (INSERM), Unité
Mixte de Recherche en Santé (UMR_S) 1166, Team Genomics & Pathophysiol‑ ogy of Cardiovascular Diseases, Sorbonne Universités, UPMC Univ. Paris 06, Paris, France. 2 ICAN Institute for Cardiometabolism and Nutrition, Paris, France. 3 Centre for Public Health, Queen’s University of Belfast, Belfast, Northern
Ireland, UK. 4 Genetics & Genome Biology Program, Hospital for Sick Children, Additional files
Additional file 1: Table S1. Main design and sample characteristics of
the discovery and replication studies.
Additional file 2: Figure S1. Quantile‑Quantile plot representation of
the discovery meta‑GWAS results.
Additional file 3: Figure S2. Manhattan plot representation of the
discovery meta‑GWAS results.
Additional file 4: Figure S3. Regional association plot at the MAP1B
locus.
Additional file 5: Table S2. Imputation quality of SNPs with association
p‑values < 1.0 × 10‑5 in the discovery cohorts.
Additional file 6: Table S3. Imputation quality of the established CAD
associated SNPs in the discovery cohorts.
Additional file 7: Figure S4. Regional association plot at the CKD18
locus.
Additional file 8: Figure S5. Regional association plot at the FAM189A2
locus.
Page 9 of 10 Charmet et al. Cardiovasc Diabetol (2018) 17:61
Toronto, Canada. 5 Départment de Diabétologie, Endocrinologie et Nutri‑
tion, Assistance Publique Hôpitaux de Paris, Hôpital Bichat, DHU FIRE, Paris, France. 6 UFR de Médecine, Université Paris Diderot, Sorbonne Paris Cité, Paris,
France. 7 Steno Diabetes Center Copenhagen, Gentofte, Denmark. 8 University
of Copenhagen, Copenhagen, Denmark. 9 Dalla Lana School of Public Health,
University of Toronto, Toronto, Canada. 10 UFR de Médecine et Pharmacie,
Université de Poitiers, Poitiers, France. 11 INSERM, CIC 1402 & U1082, Poitiers,
France. 12 Service d’Endocrinologie‑Diabétologie and Centre d’Investigation
Clinique, CHU de Poitiers, BP 577, 86021 Poitiers Cedex, France.
Competing interests
The authors declare that they have no competing interests.
Availability of data and materials
Summary statistics of the discovery GWAS are available in the GRASP resources database (https://grasp.nhlbi.nih.gov/FullResults.aspx). The French cohorts details are available in additional files.
Ethics approval and consent to participate
All participating studies were approved by their respective institutional review board/ethics committee and an informed consent was obtained from all participating individuals.
Funding
R.C was supported by a Ph.D. grant from the Region Ile de France (CORDDIM program).
The UK‑ROI component was funded by Diabetes UK, the JDRF, the Health Research Board, Science Foundation Ireland, and Department for the Economy NI 15/IA/3152; this includes the Warren 3/UK GoKinD Study Group, which includes, Belfast: A. P. Maxwell, A. J. McKnight, D. A. Savage; Edinburgh: J. Walker; London: S. Thomas, G. C. Viberti; Manchester: A. J. M. Boulton; Newcas‑ tle: S. Marshall; Plymouth: A. G. Demaine, B. A. Millward; Swansea: S. C. Bain. SD was supported by a Ph.D. studentship from the Northern Ireland Department of Education and Learning.
Publisher’s Note
Springer Nature remains neutral with regard to jurisdictional claims in pub‑ lished maps and institutional affiliations.
Received: 8 January 2018 Accepted: 16 April 2018
References
1. Menke A, Casagrande S, Geiss L, Cowie CC. Prevalence of and trends in diabetes among adults in the United States, 1988–2012. JAMA. 2015;314:1021–9.
2. Kusnik‑Joinville O, Weill A, Ricordeau P, Allemand H. Diabète traité en France en 2007: un taux de prévalence proche de 4% et des disparités géographiques croissantes. BEH. 2008;43:409–13.
3. Daneman D. Type 1 diabetes. Lancet. 2006;367:847–58.
4. Livingstone SJ, Levin D, Looker HC, Lindsay RS, Wild SH, Joss N, et al. Estimated life expectancy in a Scottish cohort with type 1 diabetes, 2008–2010. JAMA. 2015;313:37–44.
5. Lind M, Svensson AM, Kosiborod M, Gudbjörnsdottir S, Pivodic A, Wedel H, et al. Glycemic control and excess mortality in type 1 diabetes. N Engl J Med. 2014;371:1972–82.
6. Yusuf S, Hawken S, Ounpuu S, Dans T, Avezum A, Lanas F, et al. Effect of potentially modifiable risk factors associated with myocardial infarc‑ tion in 52 countries (the INTERHEART study): case‑control study. Lancet. 2004;364:937–52.
7. Nathan DM, Cleary PA, Backlund J‑YC, Genuth SM, Lachin JM, Orchard TJ, et al. Intensive diabetes treatment and cardiovascular disease in patients with type 1 diabetes. N Engl J Med. 2005;353:2643–53.
8. Earle K, Walker J, Hill C, Viberti G. Familial clustering of cardiovascular disease in patients with insulin‑dependent diabetes and nephropathy. N Engl J Med. 1992;326:673–7.
9. Hokanson JE, Cheng S, Snell‑Bergeon JK, Fijal BA, Grow MA, Hung C, et al. A common promoter polymorphism in the hepatic lipase gene (LIPC‑ 480C > T) is associated with an increase in coronary calcification in type 1 diabetes. Diabetes. 2002;51:1208–13.
10. Pettersson‑Fernholm K, Karvonen MK, Kallio J, Forsblom CM, Koulu M, Pesonen U, et al. Leucine 7 to proline 7 polymorphism in the preproneuropeptide Y is associated with proteinuria, coronary heart disease, and glycemic control in type 1 diabetic patients. Diabetes Care. 2004;27:503–9.
11. Kretowski A, Hokanson JE, McFann K, Kinney GL, Snell‑Bergeon JK, Maahs DM, et al. The apolipoprotein A‑IV Gln360His polymorphism predicts pro‑ gression of coronary artery calcification in patients with type 1 diabetes. Diabetologia. 2006;49:1946–54.
12. Pettersson‑Fernholm K, Forsblom C, Hudson BI, Perola M, Grant PJ, Groop P‑H, et al. The functional ‑374 T/A RAGE gene polymorphism is associated with proteinuria and cardiovascular disease in type 1 diabetic patients. Diabetes. 2003;52:891–4.
13. CARDIoGRAMplusC4D Consortium, Deloukas P, Kanoni S, Willenborg C, Farrall M, Assimes TL, et al. Large‑scale association analysis identifies new risk loci for coronary artery disease. Nat Genet. 2013;45:25–33.
14. Nikpay M, Goel A, Won H‑H, Hall LM, Willenborg C, Kanoni S, et al. A comprehensive 1,000 Genomes‑based genome‑wide association meta‑ analysis of coronary artery disease. Nat Genet. 2015;47:1121–30. 15. Association AD. Diagnosis and classification of diabetes mellitus. Diabetes
Care. 2010;33:S62–9.
16. Hadjadj S, Cariou B, Fumeron F, Gand E, Charpentier G, Roussel R, et al. Death, end‑stage renal disease and renal function decline in patients with diabetic nephropathy in French cohorts of type 1 and type 2 diabe‑ tes. Diabetologia. 2016;59:208–16.
17. Lajer M, Jorsal A, Tarnow L, Parving H‑H, Rossing P. Plasma growth differ‑ entiation factor‑15 independently predicts all‑cause and cardiovascular mortality as well as deterioration of kidney function in type 1 diabetic patients with nephropathy. Diabetes Care. 2010;33:1567–72. 18. Sandholm N, Salem RM, McKnight AJ, Brennan EP, Forsblom C, Isakova
T, et al. New susceptibility loci associated with kidney disease in type 1 diabetes. PLoS Genet. 2012;8:e1002921.
19. Li Y, Willer CJ, Ding J, Scheet P, Abecasis GR. MaCH: using sequence and genotype data to estimate haplotypes and unobserved genotypes. Genet Epidemiol. 2010;34:816–34.
20. Purcell S, Neale B, Todd‑Brown K, Thomas L, Ferreira MAR, Bender D, et al. PLINK: a tool set for whole‑genome association and population‑based linkage analyses. Am J Hum Genet. 2007;81:559–75.
21. Willer CJ, Li Y, Abecasis GR. METAL: fast and efficient meta‑analysis of genomewide association scans. Bioinformatics. 2010;26:2190–1. 22. Higgins JPT, Thompson SG. Quantifying heterogeneity in a meta‑analysis.
Stat Med. 2002;21:1539–58.
23. Hsieh FY, Bloch DA, Larsen MD. A simple method of sample size calcula‑ tion for linear and logistic regression. Stat Med. 1998;17:1623–34. 24. Nelson CP, Goel A, Butterworth AS, Kanoni S, Webb TR, Marouli E, et al.
Association analyses based on false discovery rate implicate new loci for coronary artery disease. Nat Genet. 2017;49:1385–91.
25. Howson JMM, Zhao W, Barnes DR, Ho W‑K, Young R, Paul DS, et al. Fifteen new risk loci for coronary artery disease highlight arterial‑wall‑specific mechanisms. Nat Genet. 2017;49:1113–9.
26. Webb TR, Erdmann J, Stirrups KE, Stitziel NO, Masca NGD, Jansen H, et al. Systematic evaluation of pleiotropy identifies 6 further loci associated with coronary artery disease. J Am Coll Cardiol. 2017;69:823–36. 27. Ward LD, Kellis M. HaploReg: a resource for exploring chromatin states,
conservation, and regulatory motif alterations within sets of genetically linked variants. Nucleic Acids Res. 2012;40:D930–4.
28. Okuda T, Cleveland JL, Downing JR. PCTAIRE‑1 and PCTAIRE‑3, two members of a novel cdc2/CDC28‑related protein kinase gene family. Oncogene. 1992;7:2249–58.
29. Bradfield JP, Qu H‑Q, Wang K, Zhang H, Sleiman PM, Kim CE, et al. A genome‑wide meta‑analysis of six type 1 diabetes cohorts identifies multiple associated loci. PLoS Genet. 2011;7:e1002293.
30. Böger CA, Chen M‑H, Tin A, Olden M, Köttgen A, de Boer IH, et al. CUBN is a gene locus for albuminuria. J Am Soc Nephrol. 2011;22:555–70. 31. Song X, Di Giovanni V, He N, Wang K, Ingram A, Rosenblum ND, et al.
•fast, convenient online submission
•
thorough peer review by experienced researchers in your field
• rapid publication on acceptance
• support for research data, including large and complex data types
•
gold Open Access which fosters wider collaboration and increased citations maximum visibility for your research: over 100M website views per year
•
At BMC, research is always in progress. Learn more biomedcentral.com/submissions
Ready to submit your research? Choose BMC and benefit from: (ADPKD): computational identification of gene expression pathways and
integrated regulatory networks. Hum Mol Genet. 2009;18:2328–43. 32. The International Polycystic Kidney Disease Consortium. Polycystic
kidney disease: the complete structure of the PKD1 gene and its protein. Cell. 1995;81:289–98.
33. Min J, Weitian Z, Peng C, Yan P, Bo Z, Yan W, Yun B, Xukai W. Correlation between insulin‑induced estrogen receptor methylation and atheroscle‑ rosis. Cardiovasc Diabetol. 2016;15:156.