HAL Id: inserm-02440583
https://www.hal.inserm.fr/inserm-02440583
Submitted on 15 Jan 2020
HAL is a multi-disciplinary open access
archive for the deposit and dissemination of
sci-entific research documents, whether they are
pub-lished or not. The documents may come from
teaching and research institutions in France or
abroad, or from public or private research centers.
L’archive ouverte pluridisciplinaire HAL, est
destinée au dépôt et à la diffusion de documents
scientifiques de niveau recherche, publiés ou non,
émanant des établissements d’enseignement et de
recherche français ou étrangers, des laboratoires
publics ou privés.
Distributed under a Creative Commons Attribution - NonCommercial - NoDerivatives| 4.0
International License
Genome-wide association study identifies multiple new
loci associated with Ewing sarcoma susceptibility
Mitchell Machiela, Thomas Grünewald, Stéphanie Reynaud, Didier Surdez,
Olivier Mirabeau, Eric Karlins, Rebeca Alba Rubio, Sakina Zaïdi, Sandrine
Grossetete-Lalami, Stelly Ballet, et al.
To cite this version:
Mitchell Machiela, Thomas Grünewald, Stéphanie Reynaud, Didier Surdez, Olivier Mirabeau, et al..
Genome-wide association study identifies multiple new loci associated with Ewing sarcoma
suscepti-bility. Nature Communications, Nature Publishing Group, 2018, 9 (1), �10.1038/s41467-018-05537-2�.
�inserm-02440583�
Genome-wide association study identi
fies multiple
new loci associated with Ewing sarcoma
susceptibility
Mitchell J. Machiela
et al.
#Ewing sarcoma (EWS) is a pediatric cancer characterized by the
EWSR1-FLI1 fusion. We
performed a genome-wide association study of 733 EWS cases and 1346 unaffected
indi-viduals of European ancestry. Our study replicates previously reported susceptibility loci at
1p36.22, 10q21.3 and 15q15.1, and identi
fies new loci at 6p25.1, 20p11.22 and 20p11.23. Effect
estimates exhibit odds ratios in excess of 1.7, which is high for cancer GWAS, and striking in
light of the rarity of EWS cases in familial cancer syndromes. Expression quantitative trait
locus (eQTL) analyses identify candidate genes at 6p25.1 (
RREB1) and 20p11.23 (KIZ). The
20p11.22 locus is near
NKX2-2, a highly overexpressed gene in EWS. Interestingly, most loci
reside near GGAA repeat sequences and may disrupt binding of the EWSR1-FLI1 fusion
protein. The high locus to case discovery ratio from 733 EWS cases suggests a genetic
architecture in which moderate risk SNPs constitute a signi
ficant fraction of risk.
DOI: 10.1038/s41467-018-05537-2
OPEN
Correspondence and requests for materials should be addressed to S.J.C. (email:[email protected])
or to O.D. (email:[email protected]).#A full list of authors and their affliations appears at the end of the paper.
123456789
E
wing sarcoma (EWS) is a rare, aggressive pediatric bone or
soft-tissue tumor that normally occurs during the second
decade of life
1and likely arises from neural crest- or
mesoderm-derived mesenchymal stem cells
2,3. A translocation
between EWSR1 (22q12) and a member of the ETS transcription
factor family, FLI1 (11q24), in ~85% of cases, is pathognomonic
of EWS and provides a distinct and well-defined disease
pheno-type for genomic characterization
4–6. The translocation results in
an aberrant transcription factor that binds to an ETS-like motif or
to GGAA microsatellites and promotes cell transformation
through deregulation of target genes responsible for cell cycle
control, cell death and migration
6–9. Aside from EWSR1-ETS
translocations, there are few other recurrent somatic alterations
observed in EWS
10–12.
In 1970, Fraumeni reported a striking disparity in EWS
inci-dence across human populations
13, suggesting an intriguing
contribution of germline variation to EWS susceptibility
14. EWS
is predominantly observed in Europeans with an estimated
inci-dence of ~1.5 cases per 10
6children and young adults
15. The
estimated incidence in Asian and African populations is
sub-stantially lower with annual rates of 0.8 and 0.2 cases per 10
6children, respectively, implying genetic variants specific to
Eur-opean ancestry could influence EWS risk
13,15–18. Despite the
rarity of EWS, infrequent and anecdotal instances of familial
clustering of EWS in siblings or cousins have also been reported,
further suggesting an important genetic component to EWS
19,20.
However, it is notable that EWS is rarely observed in the
approximately 120 cancer predisposition syndromes described to
date
21.
Our previous genome-wide association study (GWAS)
identi-fied susceptibility loci at 1p36.22, 10q21 and 15q15
22. A follow-up
functional study of the 10q21 region localized the association
signal to variation in a GGAA microsatellite that, when bound by
EWSR1-FLI1, functions as an active regulatory element of
EGR2
23. Specifically, the A risk allele connected adjacent GGAA
repeats by converting an interspaced GGAT motif into a GGAA
motif, increasing the number of consecutive GGAA motifs and
thus, magnifying the EWSR1-FLI1-dependent enhancer activity.
Interestingly, EGR2 knock down inhibits cell proliferation,
clo-nogenicity and tumor growth of EWS cells
23. Collectively, these
findings indicate that germline variation predisposes to EWS risk
and can interact with somatically acquired EWSR1-ETS fusion
proteins to drive carcinogenesis of EWS.
In this report, we perform a GWAS of EWS that combines 401
cases and 682 controls from the previously published EWS
GWAS
22with four new sample sets for a combined total of 733
EWS cases and 1346 unaffected individuals. In total, we
investi-gate EWS associations across 6,876,682 SNPs (genotyped plus
high quality imputed) with an overall meta-analysis lambda value
of 1.035 (Supplementary Figure 1). We replicate prior
associa-tions at 1p36.22, 10q21.3 and 15q15.1 and identify evidence for
three new susceptibility loci: 6p25.1, 20p11.22 and 20p11.23
(Table
1
, Fig.
1
, Supplementary Table 1, Supplementary
Fig-ures 2–3).
Table 1 Magnitude and strength of association for previously published and new EWS susceptibility loci
Region Top SNP Ref Risk Odds Ratio 95% Confidence Interval Assoc P-value HetP-value
1p36.22 rs113663169 C T 2.05 1.71 2.45 4.32E-15 0.58 6p25.1 rs7742053 C A 1.80 1.48 2.18 2.78E-09 0.12 10q21.3 rs10822056 C T 1.76 1.54 2.02 1.92E-16 0.45 15q15.1 rs2412476 C T 1.73 1.48 2.01 1.45E-12 0.93 20p11.22 rs6047482 T A 1.74 1.49 2.04 2.55E-12 0.90 20p11.23 rs6106336 T G 1.74 1.43 2.12 2.33E-08 0.16
Ref reference allele, Risk risk allele, RAF risk allele frequency (CEU), Assoc P-value Meta-analysis combined association P-value for GWAS discovery set, Het P-value P-value from test of heterogeneity for GWAS discovery set
1 2 3 4 5 6 7 8 Chromosome 9 10 11 12 13 15 17 19 21 15 –log10 p -v alue 10 5 0
Fig. 1 Manhattan plot of meta-analysis–log10P-values for the association of each SNP with EWS risk. Association -log10 p-values for each tested genetic
variant are plotted. Chromosomes are plotted sequentially across the x-axis with the scale proportional to chromosomal size. Colors are used to visualize differences in chromosome. The dotted line indicates genome-wide significance (P<5×10⁻⁸)
Results and discussion
Methods Summary. Our analysis was restricted to individuals of
>80% estimated European ancestry based on a principal
com-ponent analysis of population substructure. EWS cases were
confirmed by medical record review, which included checking for
the presence of EWSR1-ETS fusions when data was available.
Principal component matching was performed to select a
genetically homogeneous set of adult controls who were
cancer-free as of age 50 for each EWS case. Sample and SNP quality
control exclusions were carried out to ensure unrelated, high
quality samples for association analysis with accurate genotype
assays. Missing genotypes were imputed using 1000 Genomes
Phase 3 haplotypes as a reference
24. We combined results across
studies using a
fixed effects meta-analysis. Variants with minor
allele frequencies <5% or significant evidence for heterogeneity
were
filtered from the final results. A more detailed description of
our experimental methods and analysis technique is available in
Methods.
Replication of prior EWS GWAS. Our analysis provided strong
replication of three previously discovered EWS susceptibility loci
22and aided in refining the association signals. We observed
rs113663169 as the most significant variant tagging the 1p36.22
locus (OR
= 2.05, 95% CI = 1.71–2.45, P-value
meta= 4.32×10
−15).
This variant is in high linkage disequilibrium (LD) with the original
reported variant rs9430161 (R
2CEU= 0.97, D′
CEU= 1.00;
25OR
=
2.03, 95% CI
= 1.70–2.42, P-value
assoc= 6.3×10
−15)
22and is located
upstream of TARDBP, a transcriptional repressor that shares
structural similarities with EWSR1 and binds RNA regulatory
ele-ments. At the 10q21 locus, we observed rs10822056 with the
strongest association (OR
= 1.76, 95% CI = 1.54–2.02, P-value
meta= 1.92×10
−16). This variant is correlated with the reported variant
from the original GWAS, rs224278 (R
2CEU= 0.52, D′
CEU= 0.92;
25OR
= 1.71, 95% CI = 1.49–1.96, P-value
assoc= 6.9×10
−15)
22, as well
as the putatively functional variant, rs79965208 (R
2CEU= 0.24, D
′
CEU= 0.57;
25OR
= 1.42, 95% CI = 1.24–1.63, P-value
assoc=
5.3×10
−7)
23. Interestingly, as indicated previously
23, the conditional
analysis at 10q21.3 suggests evidence for a residual independent
signal in this region, although larger EWS GWAS are needed to
confirm the presence of multiple independent signals. Finally, at
15q15.1 we observed rs2412476, a tagging variant strongly
asso-ciated with EWS (OR
= 1.73, 95% CI = 1.48–2.01, P-value
meta=
1.45×10
−12). This variant is in moderate LD with rs4924410 from
the original GWAS (R
2CEU
= 0.18, D′
CEU= 1.00
25; OR
= 1.62, 95%
CI
= 1.41–1.86, P-value
assoc= 5.4×10
−12)
22and is located near
several genes including BMF, BUB1B and PAK6.
Newly identified EWS susceptibility loci. Our analysis identified
suggestive evidence for novel genomic associations (P-value
meta<
5 × 10
−7) in four genomic regions (Table
1
, Supplementary
Table 1): 6p25.1, 8q24.23, and 20p11.22 and 20p11.23. To
vali-date signals from imputed variants in these regions, we performed
allele-specific TaqMan PCR for a subset of 335 GWAS samples
on the following variants: rs7744366 (6p25.1), rs7832583
(8q24.23), rs12106193 (20p11.22) and rs6106336 (20p11.23). All
PCR-validated genotypes had over 93–99% concordance with
imputed genotypes indicating high accuracy of imputation in
these regions (Supplementary Table 2). Additionally, these signals
were replicated in two independent series of EWS cases and
controls: a European set from the Institute Curie containing of
480 EWS cases and 576 controls
22, and a German set from LMU
Munich containing 177 EWS cases and 3502 controls. All
com-bined association P-values (GWAS discovery+independent
replication sets) were below genome-wide significance levels
(P-value
meta< 5 × 10
−8, Supplementary Table 1, Supplementary
Figures 2–5) except for the 8q24.23 locus (P-value
meta= 1.44 ×
10
−7). The 6p25.2 and 20p11.22 signals were independently
replicated in both German and European replication sets;
how-ever, the 8q24.23 signal was only significant in the European set
(P-value
assoc= 0.007) and the 20p11.23 signal was only replicated
in the German set (P-value
assoc= 0.036).
EWS susceptibility locus at 6p25. We identified a new locus on
6p25.1 tagged by rs7742053 (OR
= 1.80, 95% CI = 1.48–2.18,
P-value
meta= 2.78×10
−9) with the A allele being the risk associated
allele (Supplementary Table 3). The marker variant rs7742053 is
telomeric to RREB1, SSR1 and CAGE1. Expression quantitative
trait locus (eQTL) analysis using rs1286037, a correlated
surro-gate for rs7742053 (R
2CEU= 0.49, D′
CEU= 1.00)
25, identified
allele specific expression differences in RREB1, with the risk A
allele of rs7742053 corresponding to increased levels of RREB1
expression (P-value
Wald= 0.01, Table
2
). RREB1 encodes the RAS
responsive element (RRE) binding protein 1, a zinc-finger
tran-scription factor that binds to RRE in gene promoters
26. RREB1 is
expressed in EWS tumors at higher levels than other pediatric
sarcomas (Supplementary Figure 6), suggesting regulation of
RREB1 may be particularly important for EWS. In addition, the
6p25.1 locus shows evidence for an interaction between germline
Table 2 Functional associations for newly identi
fied EWS susceptibility loci
Locus SNP Risk Allele Gene eQTL Proxy SNP Proxy R2/D′ eQTL P-value eQTL Direction EWSR1-FLI1 knock down 6p25.1 rs7742053 A CAGE1 rs1286037 0.49/1.00 0.939 — LY86 rs1286037 0.49/1.00 0.727 — LY86-AS1 rs1286037 0.49/1.00 0.487 — RREB1 rs1286037 0.49/1.00 0.010 ↑ ↓ SSR1 rs1286037 0.49/1.00 0.630 — 8q24.23 rs7832583 C none — — — — 20p11.22 rs6047482 A KIZ rs6137387 0.60/1.00 0.478 — ↓ NKX2-2 rs6137387 0.60/1.00 0.127 — ↓ PAX1 rs6137387 0.60/1.00 0.489 — XRN2 rs6137387 0.60/1.00 0.277 — 20p11.23 rs6106336 G KIZ rs6047241 1.00/1.00 0.014 ↑ ↓ NKX2-2 rs6047241 1.00/1.00 0.359 — ↓ XRN2 rs6047241 1.00/1.00 0.260 —
Risk allele is the allele associated with increased EWS risk. eQTLP-value is from a Wald test of the genotype beta value. eQTL direction is the effect the risk allele has on quantitated gene expression. EWSR1-FLI1 knock down indicates the effect of EWSR1-FLI1 knock down on relative gene expression. The up arrow (↑) indicates increased expression and the down arrow (↓) indicates decreased expression
variation and EWSR1-FLI1 fusion proteins. ChIP-seq of
acety-lated H3K27 (H3K27ac) indicates an area of open chromatin that
spans a polymorphic GGAA microsatellite near rs7742053
(Supplementary Figure 7-8, Supplementary Tables 4-5). ChIP-seq
analysis of EWSR1-FLI1 in the A673 and TC-71 EWS cell lines
confirm EWSR1-FLI1 binding to this GGAA microsatellite at
6p25.1. Further, knock down of EWSR1-FLI1 in xenografts
derived from the A673/TR/shEF1 EWS cell line results in strong
downregulation of RREB1 in vivo (Supplementary Figure 9).
Several variants correlated with rs7742053 are in contiguity with
the GGAA repeat and may be candidate functional variants that
disrupt EWSR1-FLI1 binding (Supplementary Table 5). One such
variant, rs10541084, a -/GAAG indel is located at the telomeric
end of the nearest GGAA microsatellite, is in LD with rs7742053
(R
2CEU= 0.15, D′
CEU= 0.92)
25, and is nominally associated with
EWS (OR
= 1.20, 95% CI = 1.04–1.37, P-value
meta= 0.01).
Interestingly, the rs7742053 risk A allele is correlated with the
rs10541084 GAAG allele which is more common in Europeans,
extends the microsatellite GGAA repeat sequence, and could
enhance binding of EWSR1-FLI1. This evidence suggests that a
similar mechanism as in the 10q21 locus
23may be acting at the
6p25.1 locus in which variation of a GGAA repeat affects
EWSR1-FLI1 binding leading to altered expression of RREB1 or
an alternative nearby gene. Further functional work at 6p25.1 is
required to clarify which variants are functionally responsible for
the susceptibility signal.
EWS susceptibility locus at 20p11. We identified an association
signal spanning chromosome 20p11.22-23. The strongest
asso-ciation signal was on 20p11.22 tagged by rs6047482 (OR
= 1.74,
95% CI
= 1.49–2.04, P-value
meta= 2.55×10
−12). The A allele is
the risk allele with a higher frequency observed in 1000 Genome
Europeans than in Africans (Supplementary Table 3). While no
statistically significant eQTL was observed between this locus and
nearby genes (Table
2
), the nearest transcript, NKX2-2, is of high
interest; NKX2-2, NK2 homeobox 2, encodes a homeobox
domain protein that is a likely nuclear transcription factor, which
is overexpressed in the presence of EWSR1-FLI1 fusions in
EWS tumors
27,28. Our analysis did not detect significant allele
specific expression differences for NKX2-2 in association with
rs6047482 (eQTL P-value
Waldwith rs12106193
= 0.17, R
2CEUand
D′
CEUbetween rs6047482 and rs12106193
= 0.67 and 1.00,
respectively)
25. We explored eQTLs for other tissue types in
GTEx with surrogate SNPs in moderate to high linkage
dis-equilibrium with rs6047482, but found no evidence for an eQTL
with NKX2-2 in these tissues likely due to EWS specific
expres-sion of NKX2-2 (Supplementary Table 6)
29. It is plausible that
EWSR1-FLI1-induced elevated NKX2-2 expression levels in EWS
cells hamper our ability to detect allele specific expression
pat-terns of NKX2-2 that may be important for EWS transformation
in the EWS progenitor cells. Further eQTL analyses in a large set
of mesenchymal stem cells, the suspected EWS cell-of-origin,
should enable this hypothesis to be tested. As with the 6p25.1
locus, ChIP-seq data show that EWSR1-FLI1 binds to one or
more polymorphic GGAA microsatellites proximal to the tagging
variants (Supplementary Figure 10) suggesting that variation in
this region could exert an effect through NKX2-2 gene regulation
in EWS progenitors and in turn through EWSR1-FLI1 binding
in EWS cells. Importantly, the six lead SNPs are on average
significantly closer to EWSR1-FLI1 bound elements than
would be expected by chance on a chromosome-wide level
(P-values
Wilcoxon= 0.0025 and 0.0009 in A673 and TC71 cell
lines, respectively) (Supplementary Figure 8, Supplementary
Table 4).
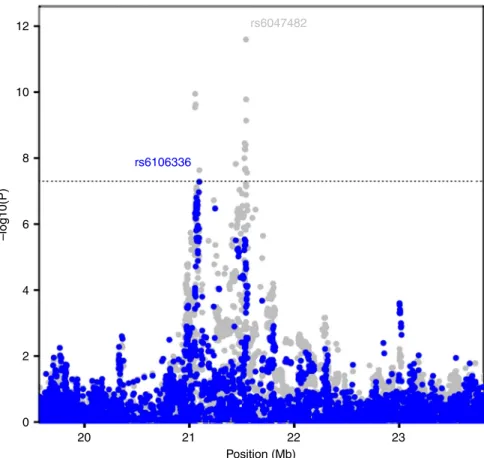
Independent EWS susceptibility signal at 20p11. In the search
for additional independent loci at each EWS susceptibility locus
(Supplementary Figure 4), we identified a second, independent
signal on 20p11.23 tagged by rs6106336 based on a conditional
analysis using the discovery marker, rs6047482 (R
2CEU= 0.003,
D′
CEU= 0.23; OR = 1.74, 95% CI = 1.43–2.12, P-value
meta=
2.33×10
−8, P-value
conditional= 5.2×10
−8, Fig.
2
) with the G allele
acting as the risk associated allele. A distinct eQTL was observed
between a highly correlated surrogate for rs6106336, rs6047241
(R
2CEU
= 1.00, D′
CEU= 1.00), and KIZ, kizuna centrosomal
protein, (also known as PLK1S1) with the risk G allele associated
with increased expression (P-value
Wald= 0.01, Table
2
). This
eQTL at 20p11.23 with KIZ does not appear to be restricted to
EWS and was observed in other GTEx tissues (e.g., artery,
sun-exposed skin, testis and whole blood; Supplementary Table 6).
KIZ localizes to the centrosomes and functions to strengthen and
stabilize the pericentriolar region prior to spindle formation
30.
While limited evidence suggests EWSR1-FLI1 binding in this
region, H3K27ac patterns suggest areas of open chromatin that
may harbor variants important for regulation of nearby gene
products (Supplementary Figure 11).
EWS genetic risk score. In light of the observed set of EWS loci,
all with high estimated effect sizes, we generated a genetic risk
score (GRS) combining risk alleles from the six EWS
suscept-ibility loci to test the ability of an EWS GRS to discriminate
between EWS cases and cancer-free adult controls
(Supplemen-tary Figure 12). On average, EWS cases carried 1.08 more risk
alleles than controls (7.08 average risk alleles in EWS cases, 6.01
average risk alleles in controls; P-value
T-test= 2.44 × 10
−63). Due
to the rarity of EWS and the relatively high frequency of these
common susceptibility alleles, absolute risks of EWS associated
with these six EWS susceptibility loci are low suggesting
population-based screening using these six variants is unlikely to
be effective.
Genetic architecture of EWS. Our new, expanded GWAS of
Ewing sarcoma has identified three new loci and also validated
the three previously reported susceptibility regions. In analyses of
the new loci, there is evidence of informative eQTLs with nearby
biologically plausible candidate genes that could be likely target
genes for future functional investigations. Additionally,
EWSR1-FLI1 ChIP-seq data suggest evidence for potential interactions of
germline variation at the 6p25.1 and 20p11.22 loci with the
EWSR1-FLI1 fusion protein as recently discovered at the 10q21
locus
23. It is remarkable that six independent susceptibility
regions with relatively large effect sizes (estimated OR > 1.7) have
been discovered in a sample of 733 EWS cases. These results
provide a strong contrast to GWAS
findings for the vast majority
of cancers that report estimated effect sizes less than 1.2.
Inter-estingly, GWAS in two highly heritable cancers (e.g., testicular
and thyroid)
31,32have also identified susceptibility alleles with
effect sizes in the range of what is observed for Ewing sarcoma.
The efficiency of our discovery as well as the higher estimated
EWS odds ratios could be related to the lack of tumor
hetero-geneity in our Ewing sarcoma GWAS, because most EWS cases
studied had a pathologically confirmed EWSR1-ETS fusion, a
pathognomonic molecular feature of the EWS diagnosis.
Fur-thermore, our results suggest the underlying EWS genetic
sus-ceptibility architecture harbors a substantial number of moderate
effect common variants, which is striking because Ewing sarcoma
has not been considered to be highly heritable. In conclusion, our
study provides support for a strong inherited genetic component
to EWS risk and suggests interactions between germline variation
and somatically acquired EWSR1-FLI1 translocations are
important etiologic contributors to EWS risk.
Methods
Study populations. EWS cases and controls for this GWAS originated from several contributing studies. A set of published French EWS cases (N= 401) and ancestry matched controls (N= 682) was extracted from the previously published GWAS on EWS22. In addition, we combined a set of 122 French EWS cases from
the Institut Curie, 19 EWS cases from the National Cancer Institute (NCI) Center for Cancer Research (CCR), 29 EWS cases from the NCI Bone Disease and Injury Study33along with 162 EWS cases from the Childhood Cancer Survivor Study
(CCSS)34,35. The SNPWEIGHTS software was used to calculate the percentage of
European ancestry using a set of population inference SNPs36,37. Only EWS cases
with >80% genetically estimated European ancestry were included in the analysis. This resulted in a total of 749 EWS cases combined with 682 cancer-free controls from the original EWS GWAS. To increase the sample size of available controls, we identified a set of adult controls previously genotyped at the NCI Division of Cancer Epidemiology and Genetics who were cancer-free at age 50, of European ancestry and genotyped on a current generation of high-density Illumina geno-typing platform. Controls originated from the Prostate Lung Colorectal and Ovarian Cancer Screening Trial (N= 419), American Cancer Society Cancer Prevention Study II (N= 171), and the Spanish Bladder Cancer Study (N = 74). EWS cases without available controls were split into two groups: (1) the CCSS group and (2) a Curie/NCI group that contained EWS cases from the Institute Curie, NCI CCR and NCI Bone Disease and Injury Study. Principal component matching was performed to identify ancestry matched controls for each EWS case that were close genetic matches (Supplementary Figure 13). Thefirst three prin-cipal components were used as matching factors and a 2:1 matching ratio of controls to cases was carried out based on the availability of close control matches. Matching was performedfirst for the CCSS set to maximize matches with available controls on high-density arrays. In total, ourfinal analysis set contained 733 EWS cases and 1346 cancer-free controls.
All EWS cases were confirmed by medical record review and the presence of a specific EWSR1-ETS translocation were noted when data was available. Adult controls were of European ancestry and cancer-free at time of DNA collection. Each participant provided informed consent and each participating study was approved by the Institutional Review Boards of their study center.
Genome-wide SNP genotyping and quality control assessment. Samples from the previously published EWS GWAS22were derived from bone marrow, blood or
tumor tissue. Genomic DNA was isolated using proteinase K lysis and phenol chloroform extraction method. Genome-wide genotyping was performed on Illu-mina 610 Quadv1 arrays at Integragen (Evry, France). For the CCSS EWS cases, DNA was extracted using standard methods from blood, saliva (Oragene), or buccal cells. For CCSS EWS cases with insufficient DNA, whole genome amplifi-cation was performed38. Genotyping of CCSS EWS cases and quality control
replicates was conducted at the NCI Cancer Genomics Research Laboratory (CGR) on the HumanOmni5Exome array. Genotypes were called using default parameters in GenomeStudio (Illumina).
All de novo genotyping of EWS cases was performed at the NCI CGR on the Illumina OmniExpress-24 v1.1 array. Genotyping was performed according to manufacturer’s guidelines using the Infinium HD Assay automated protocol. For each sample, 400 ng of input DNA was denatured and neutralized then isothermally amplified by whole-genome amplification. The amplified product was enzymatically fragmented, then precipitated and re-suspended before hybridization to the BeadChip. Single-base extension of the oligos on the BeadChip, using the captured DNA as a template, incorporated tagged nucleotides on the BeadChip, which were subsequentlyfluorophore labeled during staining. An Illumina iScan scanned the BeadChips at two wavelengths to create imagefiles. Genotypes were called using default parameters in GenomeStudio. Standard quality control checks were performed to ensure included EWS cases had high genotype completion rates (≥95%), sex concordance, normal rates of heterozygosity and no unexpected duplicates or cases of high relatedness (IBD < 0.1).
Missing genotypes were imputed in three sets: (1) the previously published GWAS set22, (2) the CCSS EWS cases and matched controls and (3) the Curie/NCI
EWS cases and matched controls. For sets 2 and 3, only the common set of shared genotypes between EWS cases and cancer-free controls was used as input for imputation. All samples werefirst phased using SHAPEIT39and subsequently
imputed in IMPUTE240using the 1000 Genomes Phase 3 release as the reference24.
Only SNPs with study info score greater than 0.3 and study minor allele counts greater than or equal to 5 were carried on into the association analysis. Statistical analysis. Association analyses were performed individually in each of the three imputation sets using SNPTEST. Statistical adjustment was carried out for principal components (PCs) used for matching (in the CCSS and Curie/NCI sets) and those PCs significantly associated with EWS risk. PCs were calculated in PLINK41using a set of population inference SNPs36. In the previously published
20 21 22 Position (Mb) 23 12 rs6047482 rs6106336 10 8 6 –log10(P) 4 2 0
Fig. 2 Conditional analysis at the 20p11.22-23 region. Overall meta-analysis–log10P-values are plotted in gray in the background. In the foreground,
meta-analysis–log10p-values when the top tagging SNP is the region (rs6047482) is conditioned on is plotted in blue. A second independent signal, tagged by
set, statistical adjustment was carried out for PC 2, PC 3, PC 6, PC 11 and PC 12. In the CCSS set, PC 1, PC 2, PC 3, PC 5, PC 17 and PC 20 were adjusted for. For the Curie/NCI set, statistical adjustment was carried out for PC 1, PC 2, PC 3, PC 4, PC 9, PC 15, PC 17 and PC 18.
Resulting statistical associations from each of the three sets were combined in PLINK byfixed effects meta-analysis. When performing the meta-analysis, beta estimates and standard errors corresponded to the same reference alleles across all three sets were merged. Resulting associations from the meta-analysis werefiltered to include single nucleotide variants with minor allele frequency greater than 0.05 and P-values for Cochrane’s Q heterogeneity tests greater than 0.01.
Genetic risk scores (GRS) of the three previously discovered and three new independent loci were calculated to investigate the ability of tagging variants from these six loci to discriminate between EWS cases and controls. GRS were constructed by summing the number of risk alleles an individual carried across all six EWS loci. A T-test was used to assess statistical differences in mean risk alleles carried in EWS cases as compared to controls. Area under the receiver operating characteristic curve (AUC) was the metric used to measure discriminative ability of the GRS.
Genotype validation. For each of the four newly discovered EWS loci, a top genome-wide significant SNP was genotyped by TaqMan in a subset of 335 samples to validate signals from imputation. At each locus, genotyping was attempted for the top associated SNP. When assay design failed for the top tagging SNP, the next most highly SNP was sequentially attempted until an appropriate assay design was established. The following SNPs were genotyped by TaqMan for each locus: rs7744366 (6p25.1), rs7832583 (8q24.23), rs12106193 (20p11.23) and rs6106336 (20p11.23). Standard protocols were followed according to manufacturer’s guide-lines when performing the TaqMan assays (Supplementary Table 7). Assays were first tested on HapMap samples to ensure validity before testing on EWS cases and controls included in the GWAS.
Replication study. An independent set from the Institute Curie and European collaborators consisting of 480 EWS cases and 576 controls and an independent German set from LMU Munich containing 177 EWS cases and 3502 population-based controls from the KORA S4 study were used as a replication sets to confirm associations at the 6p25.1, 8q24.23, 20p11.22 and 20p11.23 regions. The following SNPs were genotyped by TaqMan for each locus: rs7744366 (6p25.1), rs7832583 (8q24.23), rs12106193 (20p11.23) and rs6106336 (20p11.23) (Supplementary Table 7). Standard manufacturer’s protocols were followed when performing allele-specific PCRs with these TaqMan assays. The 3502 German controls from the KORA S4 cohort were genotyped with the Affymetrix Axiom array and imputed using the 1000 Genomes phase 3 as well as the Haplotype Reference Consortium (HRC) reference panels.
EWS functional data. All expression quantitative trait loci (eQTL) analyses were performed using previously published expression data from 117 EWS samples22.
Samples were profiled using Affymetrix Human Genome U133 Plus 2.0 gene expression arrays. Expression data are publically available at the Gene Expression Omnibus (GEO) web portal (GSE34620). Affymetrix expression data were nor-malized with the NormalizeBetweenArrays function of the LIMMA package (http://web.mit.edu/~r/current/arch/i386_linux26/lib/R/library/limma/html/ normalizebetweenarrays.html). Wald tests of estimated betas from linear regression models were performed to asses for allele specific differences in gene expression levels.
Chromatin immunoprecipitation (ChIP). ChIP experiments were performed following manufacture instructions using iDeal ChIP-seq kit for transcription factors and for histones (Diagenode) with respectively a rabbit polyclonal anti-FLI1 antibody (Ab15289, Abcam) and a rabbit polyclonal anti-H3K27ac (Ab4729, Abcam). The Ewing sarcoma A673 cell line was obtained from the American Type Culture Collection (ATCC) and the Ewing sarcoma TC-71 cell line was obtained from the German Collection of Microorganisms and Cell Cultures (DSMZ). STR-profiling proved each cell line matched with the reference profile provided by ATCC and DSMZ, respectively; and cells were routinely tested for mycoplasma contamination by PCR. Briefly, the EWS cell lines were fixed for 10 min with 1% of methanol-free formaldehyde (28908, Thermo-Scientific). Chromatin was sonicated (Bioruptor, Diagenode) for 20 cycles (30-sec on, 30-sec off) set at position“high” to generate DNA fragments with an average size around 150–300pb. For ChIP sequencing, the libraries were generated using TruSeq ChIP library preparation kit (Illumina) and sequenced on Illumina HiSeq 2500 (single end, 100 bp). Reads were aligned to hg19 reference genome with Bowtie242. Peaks were called with MACS243
with the option narrow for FLI1 ChIP-seq and broad for H3K27ac ChIP-seq. For each cell line, ChIP-seq results were normalized according to their input sample. Comparison of gene expression levels across cancer types. Publicly available gene expression data for 19 different cancer entities comprising in total 616 tumor samples, which were all profiled on Affymetrix Human Genome U133 Plus 2.0 gene expression arrays, were downloaded from the GEO or the Array Express platform of the European Bioinformatics Institute (EBI) (accession codes:
GSE68015, GSE13433, GSE32569, GSE19404, GSE35493, GSE58697, GSE34620, GSE34800, GSE60740, GSE19348, GSE17743, GSE8167, GSE53224, GSE16476, E-MEXP-3628, GSE14827, GSE33458, E-TABM-1202, GSE29683, GSE20196, GSE21050). Microarray data were simultaneously normalized using Robust Multi-Chip Average (RMA)44using brainarray CDF (v19 ENTREZG) yielding one
optimized probe-set per gene45.
Analysis of EWSR1-FLI1-modulated genes in vivo. For transcriptome-wide analysis of EWSR1-FLI1-modulated genes 5 × 10⁶A673/TR/shEF1 cells46, which
contain a doxycycline (dox)-inducible shRNA against EWSR1-FLI1, were injected subcutaneously in theflanks of immunocompromised NSG (Nod scid gamma) mice. A673/TR/shEF1 cells were authenticated by STR-profiling to match their parental A673 cell line and were routinely tested for mycoplasma contamination by PCR. When tumors reached an average volume of 180 mm3, mice were rando-mized and either received 2 mg/l dox (Sigma) and 5% sucrose in the drinking water (dox+) or only 5% sucrose (dox –). Mice were sacrificed 96 h after beginning of dox-treatment, and tumors were collected for RNA and histological analysis. Total RNA was extracted using the ReliaPrep miRNA Cell and Tissue Miniprep System (Promega). Knock down of EWSR1-FLI1 was confirmed by qRT-PCR as descri-bed23, and proved to be downregulated onto 15% of the control (sucrose only).
Routine histology (H&E stains) of the tumors confirmed high tumor purity (>95%). The transcriptomes of 3 dox(+) and 3 dox (−) were profiled on Affy-metrix Clariom D arrays (RIN > 9). Microarray data were simultaneously nor-malized on gene level using Signal Space Transformation Robust Multi-Chip Average (SST-RMA) and Affymetrix CDF. Animal experiments were conducted in accordance with the recommendations of the European Community (86/609/EEC), the Government of Upper Bavaria (Germany), and UKCCCR (guidelines for the welfare and use of animals in cancer research). The sample size was not pre-determined and no blinding was performed.
Data availability. Data from the newly genotyped individuals in EWS GWAS is available ondbGaPunder accession numberphs001549.v1.p1Data from CCSS is available on dbGaP under accession numberphs001327.v1.p1.
Received: 7 October 2017 Accepted: 12 July 2018
References
1. Delattre, O. et al. The Ewing family of tumors–a subgroup of small-round-cell tumors defined by specific chimeric transcripts. N. Engl. J. Med. 331, 294–299 (1994).
2. von Levetzow, C. et al. Modeling initiation of Ewing sarcoma in human neural crest cells. PLoS ONE 6, e19305 (2011).
3. Tirode, F. et al. Mesenchymal stem cell features of Ewing tumors. Cancer Cell. 11, 421–429 (2007).
4. Delattre, O. et al. Gene fusion with an ETS DNA-binding domain caused by chromosome translocation in human tumours. Nature 359, 162–165 (1992). 5. Aurias, A. et al. Chromosomal translocations in Ewing’s sarcoma. N. Engl. J.
Med. 309, 496–498 (1983).
6. Toomey, E. C., Schiffman, J. D. & Lessnick, S. L. Recent advances in the molecular pathogenesis of Ewing’s sarcoma. Oncogene 29, 4504–4516 (2010). 7. Gangwal, K. et al. Microsatellites as EWS/FLI response elements in Ewing’s
sarcoma. Proc. Natl Acad. Sci. USA 105, 10149–10154 (2008).
8. Guillon, N. et al. The oncogenic EWS-FLI1 protein binds in vivo GGAA microsatellite sequences with potential transcriptional activation function. PLoS ONE 4, e4932 (2009).
9. Boulay, G. et al. Cancer-specific retargeting of BAF complexes by a prion-like domain. Cell 171, 163–178 (2017).
10. Brohl, A. S. et al. The genomic landscape of the Ewing Sarcoma family of tumors reveals recurrent STAG2 mutation. PLoS Genet. 10, e1004475 (2014). 11. Tirode, F. et al. Genomic landscape of Ewing sarcoma defines an aggressive
subtype with co-association of STAG2 and TP53 mutations. Cancer Discov. 4, 1342–1353 (2014).
12. Crompton, B. D. et al. The genomic landscape of pediatric Ewing sarcoma. Cancer Discov. 4, 1326–1341 (2014).
13. Fraumeni, J. F. Jr. & Glass, A. G. Rarity of Ewing’s sarcoma among U.S. Negro children. Lancet 1, 366–367 (1970).
14. Worch, J. et al. Racial differences in the incidence of mesenchymal tumors associated with EWSR1 translocation. Cancer Epidemiol. Biomark. Prev. 20, 449–453 (2011).
15. Jawad, M. U. et al. Ewing sarcoma demonstrates racial disparities in incidence-related and sex-related differences in outcome: an analysis of 1631 cases from the SEER database, 1973–2005. Cancer 115, 3526–3536 (2009). 16. Jensen, R. D. & Drake, R. M. Rarity of Ewing’s tumour in Negroes. Lancet 1,
777 (1970).
17. Linden, G. & Dunn, J. E. Ewing’s sarcoma in Negroes. Lancet 1, 1171 (1970). 18. Li, F. P., Tu, J. T., Liu, F. S. & Shiang, E. L. Rarity of Ewing’s sarcoma in China.
Lancet 1, 1255 (1980).
19. Joyce, M. J. et al. Ewing’s sarcoma in female siblings. A clinical report and review of the literature. Cancer 53, 1959–1962 (1984).
20. Hutter, R. V., Francis, K. C. & Foote, F. W. Jr. Ewing’s sarcoma in siblings: report of the second known occurrence. Am. J. Surg. 107, 598–603 (1964). 21. Rahman, N. Realizing the promise of cancer predisposition genes. Nature 505,
302–308 (2014).
22. Postel-Vinay, S. et al. Common variants near TARDBP and EGR2 are associated with susceptibility to Ewing sarcoma. Nat. Genet. 44, 323–327 (2012).
23. Grunewald, T. G. et al. Chimeric EWSR1-FLI1 regulates the Ewing sarcoma susceptibility gene EGR2 via a GGAA microsatellite. Nat. Genet. 47, 1073–1078 (2015).
24. Genomes Project, C. et al. A global reference for human genetic variation. Nature 526, 68–74 (2015).
25. Machiela, M. J. & Chanock, S. J. LDlink: a web-based application for exploring population-specific haplotype structure and linking correlated alleles of possible functional variants. Bioinformatics 31, 3555–3557 (2015). 26. Thiagalingam, A., Lengauer, C., Baylin, S. B. & Nelkin, B. D. RREB1, a ras
responsive element binding protein, maps to human chromosome 6p25. Genomics 45, 630–632 (1997).
27. Smith, R. et al. Expression profiling of EWS/FLI identifies NKX2.2 as a critical target gene in Ewing’s sarcoma. Cancer Cell. 9, 405–416 (2006).
28. Cheung, I. Y. et al. Novel markers of subclinical disease for Ewing family tumors from gene expression profiling. Clin. Cancer Res. 13, 6978–6983 (2007).
29. Consortium, G. T. The Genotype-Tissue Expression (GTEx) project. Nat. Genet. 45, 580–585 (2013).
30. Oshimori, N., Ohsugi, M. & Yamamoto, T. The Plk1 target Kizuna stabilizes mitotic centrosomes to ensure spindle bipolarity. Nat. Cell Biol. 8, 1095–1101 (2006).
31. Litchfield, K. et al. Identification of four new susceptibility loci for testicular germ cell tumour. Nat. Commun. 6, 8690 (2015).
32. Gudmundsson, J. et al. A genome-wide association study yieldsfive novel thyroid cancer risk loci. Nat. Commun. 8, 14517 (2017).
33. Troisi, R. et al. Perinatal factors, growth and development, and osteosarcoma risk. Br. J. Cancer 95, 1603–1607 (2006).
34. Robison, L. L. et al. The Childhood Cancer Survivor Study: a National Cancer Institute-supported resource for outcome and intervention research. J. Clin. Oncol. 27, 2308–2318 (2009).
35. Morton, L. M. et al. Genome-wide association study to identify susceptibility loci that modify radiation-related risk for breast cancer after childhood cancer. J. Natl Cancer Inst. 1–11https://doi.org/10.1093/jnci/djx058. (2017). 36. Yu, K. et al. Population substructure and control selection in genome-wide
association studies. PLoS ONE 3, e2551 (2008).
37. Chen, C. Y. et al. Improved ancestry inference using weights from external reference panels. Bioinformatics 29, 1399–1406 (2013).
38. Silander, K. & Saarela, J. Whole genome amplification with Phi29 DNA polymerase to enable genetic or genomic analysis of samples of low DNA yield. Methods Mol. Biol. 439, 1–18 (2008).
39. Delaneau, O., Marchini, J. & Zagury, J. F. A linear complexity phasing method for thousands of genomes. Nat. Methods 9, 179–181 (2011).
40. Howie, B. N., Donnelly, P. & Marchini, J. Aflexible and accurate genotype imputation method for the next generation of genome-wide association studies. PLoS Genet. 5, e1000529 (2009).
41. Purcell, S. et al. PLINK: a tool set for whole-genome association and population-based linkage analyses. Am. J. Hum. Genet. 81, 559–575 (2007). 42. Langmead, B. & Salzberg, S. L. Fast gapped-read alignment with Bowtie 2. Nat.
Methods 9, 357–359 (2012).
43. Zhang, Y. et al. Model-based analysis of ChIP-Seq (MACS). Genome Biol. 9, R137 (2008).
44. Irizarry, R. A. et al. Exploration, normalization, and summaries of high density oligonucleotide array probe level data. Biostatistics 4, 249–264 (2003). 45. Dai, M. et al. Evolving gene/transcript definitions significantly alter the
interpretation of GeneChip data. Nucleic Acids Res. 33, e175 (2005). 46. Carrillo, J. et al. Cholecystokinin down-regulation by RNA interference
impairs Ewing tumor growth. Clin. Cancer Res. 13, 2429–2440 (2007).
Acknowledgements
This work was supported by the Intramural Research Program of the U.S. National Cancer Institute and the Intramural Research Program of the American Cancer Society. This work was supported by grants from the Institut Curie, the Inserm, the Ligue Nationale Contre le Cancer (Equipe labellisée, Carte d’Identité des Tumeurs program and Recherche Epidémiologique 2009 program), the ANR-10-EQPX-03 from the Agence Nationale de la Recherche, the European PROVABES (ERA-649 NET TRANSCAN
JTC-2011), and ASSET (FP7-HEALTH-2010-259348) projects. This research was supported by FP7 grant“EURO EWING Consortium” No. 602856 and the following associations: Courir pour Mathieu, Dans les pas du Géant, Les Bagouzamanon, Enfants et Santé, M la vie avec Lisa, Lulu et les petites bouilles de lune, les Amis de Claire, l’Etoile de Martin and the Société Française de lutte contre les Cancers et les leucémies de l’Enfant et de l’adolescent. The laboratory of T. G. P. Grünewald is supported by grants from the ‘Verein zur Förderung von Wissenschaft und Forschung an der Medizinischen Fakultät der LMU München (WiFoMed)’, by LMU Munich’s Institutional Strategy LMU excellent within the framework of the German Excellence Initiative, the‘Mehr LEBEN für kreb-skranke Kinder—Bettina-Bräu-Stiftung’, the Walter Schulz Foundation, the Wilhelm Sander-Foundation (2016.167.1), and by the German Cancer Aid (DKH-111886 and DKH-70112257). D. Surdez is supported by SiRIC (Grant « INCa-DGOS-4654). We thank the following clinicians for providing samples used in this study: C. Alenda, F. Almazán, D. Ansoborlo, L. Aymerich, L. Benboukbher, C. Beléndez, C. Berger, C. Ber-geron, P. Biron, J.Y. Blay, E. Bompas, H. Bonnefoi, P. Boutard, B. Bui-Nguyen, D. Chauveaux, C. Calvo, A. Carboné, C. Clement, T. Contra, N. Corradini, A.S. Defachelles, V. Gandemer-Delignieres, A. Deville, A. Echevarria, J. Fayette, M. Fraga, D. Frappaz, J.L. Fuster, P. García-Miguel, J.C. Gentet, P. Kerbrat, V. Laithier, V. Laurence, P. Leblond, O. Lejars, R. López-Almaraz, B. López-Ibor, P. Lutz, J.F. Mallet, L. Mansuy, P. Marec Bérard, G. Margueritte, A. Marie Cardine, C. Melero, L. Mignot, F. Millot, O. Minckes, G. Margueritte, C. Mata, M.E. Mateos, M. Melo, C. Moscardó, M. Munzer, B. Narciso, A. Navajas, D. Orbach, C. Oudot, H. Pacquement, C. Paillard, Y. Perel, T. Philip, C. Piguet, M.I. Pintor, D. Plantaz, E. Plouvier, S. Ramirez-Del-Villar, I. Ray-Coquard, Y. Reguerre, M. Rios, P. Rohrlich, H. Rubie, A. Sastre, G. Schleiermacher, C. Schmitt, P. Schneider, L. Sierrasesumaga, C. Soler, N. Sirvent, S. Taque, E. Thebaud, A. Thyss, R. Tichit, J.J. Uriz, J. P. Vannier, F. Watelle-Pichon. This work was supported by the Instituto de Salud Carlos III (PI16CIII/00026) and the Asociación Pablo Ugarte, Fundación Sonrisa de Alex, ASION-La Hucha de Tomás, Sociedad Española de Hematología y Oncología Pediátricas. The Childhood Cancer Survivor Study is supported by the National Cancer Institute (CA55727, G.T. Armstrong, Principal Investigator), with funding for genotyping from the Intramural Research Program of the National Institutes of Health, National Cancer Institute. The KORA study was initiated andfinanced by the Helmholtz Zentrum München—German Research Center for Environmental Health, which is funded by the German Federal Ministry of Education and Research (BMBF) and by the State of Bavaria. Furthermore, KORA research was supported within the Munich Center of Health Sciences (MC-Health), Ludwig-Maximilians-Universität, as part of LMUinnovativ.
Author contributions
M.J.M., S.J.C. and O.D. designed the study. M.J.M., T.G.P.G., S.J.C. and O.D. wrote the manuscript. M.J.M., T.G.P.G., O.M., S.G.-L. and F.T. performed the statistical analysis. R. A.R., C.L.D., L.B., K.J., M.M., K.W., W.Z. and M.Y. performed the genotyping and quality control. The following authors provided samples and/or data to the study and commented on the manuscript: T.G.P.G., D.S., S.R., O.M., E.K., R.A.R., S.Z., S.G.-L., S.Ballet, E.L., V.L., J.M., G.P., H.K., N.G., U.K., A.G.-N., P.P., J.A., A.P.-G., N.C., P.M.B., N.D.F., N.R., D.G.C., R.N.H., J.Khan, G.T.A., W.M.L., S.Bhatia, L.L.R., A.E.K., J.Kriebel, T.M., M.Metzler, W.H., K.S., T.K., U.D., L.M.M., L.M., M.A.T., and O.D.
Additional information
Supplementary Informationaccompanies this paper at
https://doi.org/10.1038/s41467-018-05537-2.
Competing interests:The authors declare no competing interests.
Reprints and permissioninformation is available online athttp://npg.nature.com/ reprintsandpermissions/
Publisher's note:Springer Nature remains neutral with regard to jurisdictional claims in published maps and institutional affiliations.
Open Access This article is licensed under a Creative Commons Attribution 4.0 International License, which permits use, sharing, adaptation, distribution and reproduction in any medium or format, as long as you give appropriate credit to the original author(s) and the source, provide a link to the Creative Commons license, and indicate if changes were made. The images or other third party material in this article are included in the article’s Creative Commons license, unless indicated otherwise in a credit line to the material. If material is not included in the article’s Creative Commons license and your intended use is not permitted by statutory regulation or exceeds the permitted use, you will need to obtain permission directly from the copyright holder. To view a copy of this license, visithttp://creativecommons.org/
licenses/by/4.0/.
Mitchell J. Machiela
1, Thomas G.P. Grünewald
2,3,4, Didier Surdez
5,6, Stephanie Reynaud
6,7,
Olivier Mirabeau
5,6, Eric Karlins
1,8, Rebeca Alba Rubio
2, Sakina Zaidi
5,6, Sandrine Grossetete-Lalami
5,6,
Stelly Ballet
6,7, Eve Lapouble
6,7, Valérie Laurence
6, Jean Michon
6, Gaelle Pierron
6,7, Heinrich Kovar
9,
Nathalie Gaspar
10, Udo Kontny
11, Anna González-Neira
12, Piero Picci
13, Javier Alonso
14, Ana Patino-Garcia
15,
Nadège Corradini
16, Perrine Marec Bérard
16, Neal D. Freedman
1, Nathaniel Rothman
1, Casey L. Dagnall
1,8,
Laurie Burdett
1,8, Kristine Jones
1,8, Michelle Manning
1,8, Kathleen Wyatt
1,8, Weiyin Zhou
1,8, Meredith Yeager
1,8,
David G. Cox
17, Robert N. Hoover
1, Javed Khan
18, Gregory T. Armstrong
19, Wendy M. Leisenring
20,
Smita Bhatia
21, Leslie L. Robison
19, Andreas E. Kulozik
22, Jennifer Kriebel
23,24,25, Thomas Meitinger
26,27,
Markus Metzler
28, Wolfgang Hartmann
29, Konstantin Strauch
30,31, Thomas Kirchner
3,4,32, Uta Dirksen
33,
Lindsay M. Morton
1, Lisa Mirabello
1, Margaret A. Tucker
1, Franck Tirode
5,6, Stephen J. Chanock
1&
Olivier Delattre
5,61Division of Cancer Epidemiology and Genetics, National Cancer Institute, Bethesda, MD 20892, USA.2Max-Eder Research Group for Pediatric
Sarcoma Biology, Institute of Pathology, Faculty of Medicine, LMU, 80337 Munich, Germany.3German Consortium for Cancer Research (DKTK),
69120 Heidelberg, Germany.4German Cancer Research Center (DKFZ), 69120 Heidelberg, Germany.5Inserm U830, Équipe Labellisés LNCC, PSL
Université, Institut Curie, 75005 Paris, France.6SIREDO Oncology Centre, Institut Curie, 75005 Paris, France.7Unité de Génétique Somatique,
Institut Curie, Centre Hospitalier, 75005 Paris, France.8Cancer Genomics Research Laboratory, Frederick National Laboratory for Cancer Research,
Leidos Biomedical Research Inc, Frederick, MD 21701, USA.9Children’s Cancer Research Institute, St. Anna Kinderkrebsforschung, 1090 Vienna,
Austria.10Department of Oncology for Child and Adolescent, Institut Gustave Roussy, 94800 Villejuif, France.11Division of Pediatric Hematology
Oncology and Stem Cell Transplantation, Medical Faculty, RWTH Aachen University, 52062 Aachen, Germany.12Human Genotyping Unit-CeGen,
Human Cancer Genetics Programme, Spanish National Cancer Research Centre, 28029 Madrid, Spain.13Laboratorio di Oncologia Sperimentale,
Istituto Ortopedico Rizzoli di Bologna, 40136 Bologna, Italy.14Unidad de Tumores Sólidos Infantiles, Instituto de Investigación de Enfermedades
Raras, Instituto de Salud Carlos III, 28220 Majadahonda, Spain.15Laboratory of Pediatrics, University of Navarra, University Clinic of Navarra,
IdiSNA, 31008 Pamplona, Spain.16Institute for Paediatric Haematology and Oncology, Leon Bérard Cancer Centre, University of Lyon, 69008 Lyon,
France.17Centre Léon Bérard, INSERM U1052, 69008 Lyon, France.18Genetics Branch, Center for Cancer Research, National Cancer Institute,
Bethesda, MD 20892, USA.19Department of Epidemiology and Cancer Control, St. Jude Children’s Research Hospital, Memphis, TN 38105, USA.
20Cancer Prevention and Clinical Statistics Programs, Fred Hutchinson Cancer Research Center, Seattle, WA 98109, USA.21Institute for Cancer
Outcomes and Survivorship, University of Alabama, Birmingham, AL 35294, USA.22University Children’s Hospital of Heidelberg, 69120 Heidelberg,
Germany.23Research Unit of Molecular Epidemiology, Helmholtz Zentrum München, German Research Center for Environmental Health, 85764
Neuherberg, Germany.24Institute of Epidemiology, Helmholtz Zentrum München, German Research Center for Environmental Health, 85764
Neuherberg, Germany.25German Center for Diabetes Research (DZD), München-Neuherberg 85764, Germany.26Institute of Human Genetics,
Helmholtz Zentrum München, German Research Center for Environmental Health, 85764 Neuherberg, Germany.27Institute of Human Genetics,
Technische Universität München, 80333 Munich, Germany.28University Children’s Hospital of Erlangen, 91054 Erlangen, Germany.29
Gerhard-Domagk Institute of Pathology, University Hospital of Münster, 48149 Münster, Germany.30Institute of Genetic Epidemiology, Helmholtz Zentrum
München, German Research Center for Environmental Health, 85764 Neuherberg, Germany.31Chair of Genetic Epidemiology, IBE, Faculty of
Medicine, LMU, Munich 80539, Germany.32Institute of Pathology, Faculty of Medicine, LMU, 80337 Munich, Germany.33University Children’s
Hospital of Essen, 45147 Essen, Germany. These authors contributed equally: Stephen J. Chanock, Olivier Delattre.