HAL Id: inserm-00166908
https://www.hal.inserm.fr/inserm-00166908
Submitted on 13 Aug 2007
HAL is a multi-disciplinary open access
archive for the deposit and dissemination of
sci-entific research documents, whether they are
pub-lished or not. The documents may come from
teaching and research institutions in France or
abroad, or from public or private research centers.
L’archive ouverte pluridisciplinaire HAL, est
destinée au dépôt et à la diffusion de documents
scientifiques de niveau recherche, publiés ou non,
émanant des établissements d’enseignement et de
recherche français ou étrangers, des laboratoires
publics ou privés.
is correlated with cognitive decline in Alzheimer disease.
Alireza Kashani, Eve Lepicard, Odile Poirel, Catherine Videau, Jean Philippe
David, Catherine Fallet-Bianco, Axelle Simon, André Delacourte, Bruno
Giros, Jacques Epelbaum, et al.
To cite this version:
Alireza Kashani, Eve Lepicard, Odile Poirel, Catherine Videau, Jean Philippe David, et al.. Loss
of VGLUT1 and VGLUT2 in the prefrontal cortex is correlated with cognitive decline in Alzheimer
disease.. Neurobiol Aging, 2008, 29 (11), pp.1619-30. �10.1016/j.neurobiolaging.2007.04.010�.
�inserm-00166908�
Loss of VGLUT1 and VGLUT2 in the prefrontal cortex is correlated with
cognitive decline in Alzheimer disease
Alireza Kashania,b, Ève Lepicarda,b, Odile Poirela,b, Catherine Videauc,d, Jean Philippe Davide, Catherine Fallet-Biancof,d, Axelle Simonc,d, André Delacourteg, Bruno Girosa,b, Jacques Epelbaumc,d,
Catalina Betancura,b, Salah El Mestikawya,b, *
a INSERM U513, 94000 Créteil, France
b Université Paris 12, Faculté de Médecine, 94000 Créteil, France c INSERM U549, IFR 77 Broca-Sainte Anne, 75014 Paris, France d Université Paris Descartes, Faculté de Médecine, 75014 Paris, France e AP-HP, Hôpital Emile Roux, Gérontologie 3, 94056 Limeil-Brévannes, France
f INSERM U752, IFR 77 Broca-Sainte Anne, 75014 Paris, France g INSERM U422, Bâtiment INSERM Gérard Biserte, 59000 Lille, France
* Corresponding author: Dr. Salah El Mestikawy, INSERM U513, Faculté de Médecine, 8 rue du Général Sarrail, Créteil 94010 Cedex, France. Tel: + 33 1 49 81 36 06; Fax: +33 1 49 81 36 85; Email: salah.elmestikawy@creteil.inserm.fr
HAL author manuscript inserm-00166908, version 1
Abstract
Several lines of evidence suggest that the glutamatergic system is severely impaired in Alzheimer disease (AD). Here, we assessed the status of glutamatergic terminals in AD using the first available specific markers, the vesicular glutamate transporters VGLUT1 and VGLUT2. We quantified VGLUT1 and VGLUT2 in the prefrontal dorsolateral cortex (Brodmann area 9) of controls and AD patients using specific antiserums. A dramatic decrease in VGLUT1 and VGLUT2 was observed in AD using Western blot. Similar decreases were observed in an independent group of subjects using immunoautoradiography. The VGLUT1 reduction was highly correlated with the degree of cognitive impairment, assessed with the Clinical Dementia Rating (CDR) score. A significant albeit weaker correlation was also observed with VGLUT2. These findings provide evidence indicating that glutamatergic systems are severely impaired in the A9 region of AD patients and that this impairment is strongly correlated with the progression of cognitive decline. Our results suggest that VGLUT1 expression in the prefrontal cortex could be used as a valuable neurochemical marker of dementia in AD.
Keywords: Human; Alzheimer disease; vesicular glutamate transporters; VGLUT1; VGLUT2;
prefrontal cortex; Western blot; immunoautoradiography; clinical dementia rating scale
1. Introduction
Alzheimer disease (AD) is the major and most severe form of dementia in the elderly. Synaptic loss, together with cholinergic deficits, intraneuronal neurofibrillary tangles and extracellular beta-amyloid (Aβ) peptide deposits, are considered the landmarks of AD (Braak and Braak, 1991; DeKosky and Scheff, 1990). Numerous observations have also accumulated suggesting a glutamatergic deficit in the pathophysiologic mechanisms underlying AD (Francis, 2003). Glutamate is the major excitatory neurotransmitter of the brain; in particular, it is the main neurotransmitter of cortical and hippocampal pyramidal neurons and is thus involved in higher mental functions such as cognition, learning and memory. In AD, tau protein hyperphosphorylation, which leads to neurofibrillary tangle formation and amyloid precursor protein conversion to Aβ, occurs mainly in glutamatergic pyramidal cells (Lewis et al., 1987). Consequently, AD is associated with a selective loss of pyramidal neurons and their synapses in the cerebral cortex, leading to cortical atrophy (DeKosky and Scheff, 1990; Francis, 2003; Morrison and Hof, 2002; Pearson et al., 1985). The level of cognitive impairment in AD correlates more strongly with the loss of cortical pyramidal cells than with counts of neurofibrillary tangles or senile plaques or with the level of cholinergic markers in the cerebral cortex (Masliah et al., 1993; Neary et al., 1986; Terry et al., 1991).
In addition to these histopathological findings, numerous biochemical studies also support the notion of altered glutamatergic transmission in AD (Bell et al., 2006; Francis, 2003). The disease is associated with decreased concentration of glutamate in vivo (Antuono et al., 2001; Hattori et al., 2002) as well as in post-mortem brain tissue (Arai et al., 1985). Likewise, glutamate transport both at the plasma membrane and in synaptic vesicles is reduced in the cerebral cortex of AD patients (Hardy
et al., 1987; Westphalen et al., 2003). Moreover, the glutamate transporter EAAT1, which is normally found in astrocytes, is atypically expressed by degenerating pyramidal cells in the cortex of AD patients (Scott et al., 2002).
Until recently, research on glutamatergic neurons was hindered by the lack of specific markers. Lately, three vesicular glutamate transporters (VGLUT1-3) have been identified (Fremeau et al., 2004a). These proton-dependent transporters upload glutamate into synaptic vesicles, and despite their distinct and complementary distribution in the central nervous system, share similar biochemical and pharmacologic characteristics (Fremeau et al., 2004a). Vesicular glutamate transporters confer to neurons the capacity to exocytotically release glutamate, and are the first available specific markers of glutamatergic neurons. In the human neocortex, pyramidal neurons express VGLUT1 mRNA in all layers, whereas VGLUT2 transcripts are expressed only in layers II and III (McCullumsmith and Meador-Woodruff, 2003). Thus, both VGLUT1 and VGLUT2 positive terminals account for the flow of information in higher cognitive functions. In contrast, thalamo-cortical terminals, which represent the main sensory afference to the cerebral cortex, express only VGLUT2 (Fujiyama et al., 2001).
In the current study we analyzed VGLUT1 and VGLUT2 expression in the prefrontal cortex of AD patients and controls using subtype specific antiserums. We also examined whether VGLUT1 and VGLUT2 levels were correlated with cognitive deterioration, as assessed by the Clinical Dementia Rating (CDR) scale.
2. Methods
2.1. Human brain samples
Brain samples were obtained from 17 patients and 11 controls from the geriatric department of the Emile Rous Hospital at Limeil-Brévannes, France (Table 1) (Delacourte et al., 1999; Grouselle et al., 1998). Subjects underwent a neuropsychological assessment every six months with the Mini-Mental State Examination (Folstein et al., 1975) and the Clinical Dementia Rating (CDR) scale (Hughes et al., 1982) to evaluate their cognitive status. The CDR scores are as follows: 0=no dementia, 0.5=questionable, 1=mild, 2=moderate, and 3=severe dementia.
Autopsy was performed by authorized pathologists after obtaining informed consent. One hemisphere was deep-frozen for biochemical studies and the other one was formalin-fixed for neuropathological examination. Amyloid deposits and tau pathology were quantified in brain samples and subjects were ranked according to the biochemical extent of the degenerating processes. Amyloidosis was ranked into ten stages (S0-S10), according to the cortical concentration of Aβ peptides x-42 and x-40 amino acids long, as previously described (Deramecourt et al., 2006; Permanne et al., 1995). Tau pathology was categorized into ten stages (S0-S10) according to the brain regions affected by neurofibrillary tangles (Delacourte et al., 1999). The cortical levels of Aβx-42 and the tau stage were used for correlation analyses between VGLUT expression and CDR scores. In addition, the apolipoprotein E genotype was recorded when available (Delacourte et al., 1999; Grouselle et al., 1998).
Subjects were stratified on the basis of neuropathological and clinical findings, as: i) control, ii) mild cognitive impairment (MCI), iii) early stage Alzheimer and iv) confirmed Alzheimer. The clinical diagnosis was confirmed by histopathology (Delacourte et al., 1999). Patients with neuropathological lesions other than those of AD were excluded from the study.
VGLUT1 and VGLUT2 expression was assessed by immunoautoradiography in sections of the dorsolateral prefrontal cortex (Brodmann area 9, A9) of 5 AD patients (mean age 70.8 ± 1.6 years) and 5 controls (mean age 68.6 ± 5.5 years), including one individual with MCI (Table 1). VGLUT1 immunohistochemistry was performed on frontal cortical sections (A9) of two controls and two AD patients (Table 1). In addition, levels of VGLUT1 and VGLUT2 were quantified by Western blot using fresh frozen brain samples from the A9 region of 11 patients (mean age 90.5 ± 2.1 years) and 5 controls (mean age 83.8 ± 2.1 years) (Table 1). One control and one patient were included both in Western blot and immunohistology experiments (Table 1).
2.2. Antiserums
Selective antibodies against VGLUT1 and VGLUT2 were obtained by immunization of rabbits with the corresponding peptides, as described previously (Herzog et al., 2001; Kashani et al., 2007). For immunoblotting, the following concentrations were used: anti-VGLUT1 1:8000 (Kashani et al., 2007); anti-VGLUT2 affinity purified antiserum 1:500 (Kashani et al., 2007); anti-synaptophysin 1:50000 (mouse monoclonal; Chemicon, Temecula, CA); and anti-α-tubulin 1:20000 (mouse monoclonal antiserum recognizing all isoforms of α-tubulin; Sigma-Aldrich, St Louis, MO, USA). For immunoautoradiography, both the anti-VGLUT1 and anti-VGLUT2 antiserums were used at 1:2000 (Kashani et al., 2007). The specificity of the anti-VGLUT1 and anti-VGLUT2 antiserums was reported previously (Kashani et al., 2007).
2.3. Immunoautoradiography
Immunoautoradiographic labeling was performed on fresh frozen sections (10 µm) of the prefrontal cortex, as already described (Herzog et al., 2001; Kashani et al., 2007). Briefly, on the day of the experiment, sections were air dried and immersed in paraformaldehyde (4%) in PBS. Non-specific binding was saturated with PBS containing bovine serum albumin (3%), goat serum (1%) and NaI 1 mM (buffer A). Sections were incubated overnight at 4°C with buffer A supplemented with anti-VGLUT1 or -VGLUT2 serums and with anti-rabbit [125I]IgG (0.25 µci/ml; Amersham). After rinsing and drying, sections were exposed to X-ray films (Biomax, Kodak) for 4-7 days at room temperature. For each biomarker (VGLUT1 or VGLUT2), all patients and controls were analyzed in the same experiment, using 2-4 sections per individual.
2.4. Immunohistochemistry
Paraffin embedded sections (5 µm) of the A9 region were obtained from formalin-fixed brains as already described (Delacourte et al., 1999; Grouselle et al., 1998). VGLUT1 immunostaining was performed with the anti-VGLUT1 antiserum at a 1:5000 dilution as described previously (Herzog et al., 2004) and then processed with biotinylated donkey anti-goat IgG antibodies and ABC reagents (Vector Laboratories, Burlingame, CA).
2.5. Western blot
To prepare aliquots for Western blot, a 1 cm-thick section from the dorsolateral prefrontal cortex (A9) was dissected at –20°C, taking care not to include the white matter, then crushed to powder and stored at –80°C until use (Grouselle et al., 1998). Twenty mg of tissue were homogenized by sonication in PBS containing protease inhibitors (Complete, Roche, France). Protein concentration was measured using the Bio-Rad Protein Assay Kit (Bio-Rad, France). There were no significant differences in protein concentration in brain extracts between controls and patients.
Western blot experiments were performed as already described (Kashani et al., 2007). Equal concentrations of protein (5 µg per lane) were separated by SDS-PAGE (NuPage Bis-Tris 10%, InVitrogen, France) and transferred onto a nitrocellulose membrane (0.4 µm pore size, InVitrogen). Protein loading was controlled by reversible Ponceau Red staining. Non-specific sites on nitrocellulose membranes were blocked for 1 h at room temperature with either: i) PBS 1% containing Tween 20 (0.1%), and 5% nonfat dry milk for VGLUT1, synaptophysin and α-tubulin detection, or ii) PBS 1% containing Tween 20 (0.5%), 5% nonfat dry milk and 5% bovine serum albumin for VGLUT2. Membranes were incubated overnight with primary antibodies at 4°C in PBS containing Tween 20 (0.1%), and 1% nonfat dry milk for VGLUT1, synaptophysin and α-tubulin, or in PBS containing Tween 20 (0.5%), 1% nonfat dry milk and 1% bovine serum albumin for VGLUT2. Bound antibodies were detected with horseradish peroxidase-conjugated anti-rabbit or anti-mouse IgG antibodies (Sigma-Aldrich; 1:20000) and visualized by enhanced chemiluminescent detection (ECL plus Western Blotting detection system, Amersham Biosciences). VGLUT1, VGLUT2, synaptophysin and α-tubulin were detected by single labeling in independent experiments. For each biomarker (VGLUT1, VGLUT2, synaptophysin or α-tubulin), all patients and controls were analyzed in the same experiment, and all experiments were performed in triplicate.
2.6. ChAT assay
The choline acetyl cholinesterase (ChAT) assay was performed in frontal cortex extracts according to the method of Fonnum (Fonnum, 1975), as already described (Dournaud et al., 1994).
2.7. Western blot and immunoautoradiography quantification
Western blots and immunoautoradiograms were scanned and converted to 16-bit images using an Umax PowerLook 1100 scanner (Willich, Germany). The resultant images were analyzed using the MCID software (Imaging Research, St. Catharines, ON, Canada) and optical density (O.D.) was measured as already described (Kashani et al., 2007). Film exposures were selected in order to maintain the grey levels of the tissue within the dynamic range of the film. Similarly, for Western blot experiments, exposure time of the film after the ECL reaction was selected in order to avoid saturation of the signal. In addition, MCID has a special function to verify if any part of the quantified region is saturated. The background density was determined at the level of the white matter for immunoautoradiograms and on the film for Western blots, and was automatically subtracted. In Western blot experiments, densities of various bands were normalized to that obtained for the α-tubulin band for the same tissue sample. Results are expressed as means of optical density (in arbitrary units) ± SEM.
2.8. Statistical analysis
Comparisons between group means were performed using Student’s t test. Correlation analyses were performed using the Pearson’s coefficient. All statistical analyses were performed using the Statview software package (SAS, Cary, NC, USA). Results are expressed as means ± SEM.
3. Results
3.1. Expression of VGLUT1 and VGLUT2 in the prefrontal cortex of AD patients
3.1.1. Immunoautoradiography
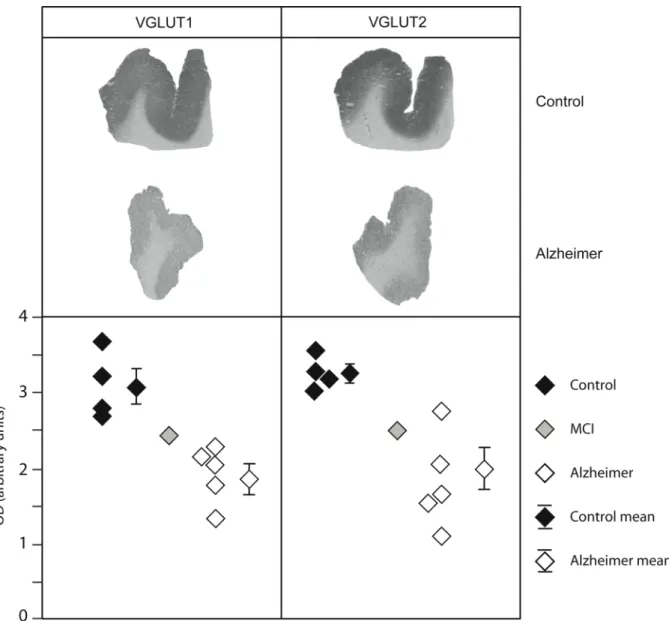
VGLUT1 and VGLUT2 were first analyzed by immunoautoradiography in the prefrontal cortex (A9) of five matched controls and patients. In both controls and patients, VGLUT1-positive terminals appeared to be homogeneously distributed in the cortex, in agreement with previous studies (Fig. 1 and Alonso-Nanclares and Defelipe, 2005). For the first time, we report the immunodistribution of VGLUT2 in the human cerebral cortex (Fig. 1). Unlike what is seen in rodents (Kaneko et al., 2002), VGLUT2 was uniformly distributed in the human neocortex.
As illustrated in Fig. 1 for one representative control and one AD patient, a severe decrease in both VGLUT1 and VGLUT2 protein levels was observed in the prefrontal cortex. Densitometric analysis of autoradiograms confirmed that VGLUT1 and VGLUT2 levels were lower in patients compared to controls (Fig. 1, lower panel). VGLUT1 and VGLUT2 expression in AD subjects was decreased by –39% and –44%, respectively (p=0.003 in both cases, Table 2). This decrease was uniformly distributed and not localized in particular layers of the cerebral cortex, as shown in Fig. 1 and further confirmed by immunohistochemistry (Fig. 2). Interestingly, very low levels of VGLUT1 and VGLUT2 proteins were observed for an individual initially included as a control (Fig. 1). Verification of his medical records revealed that this subject suffered from MCI, suggesting that the decline in vesicular glutamate carriers could occur very early in the disease process.
3.1.2. Immunohistochemistry
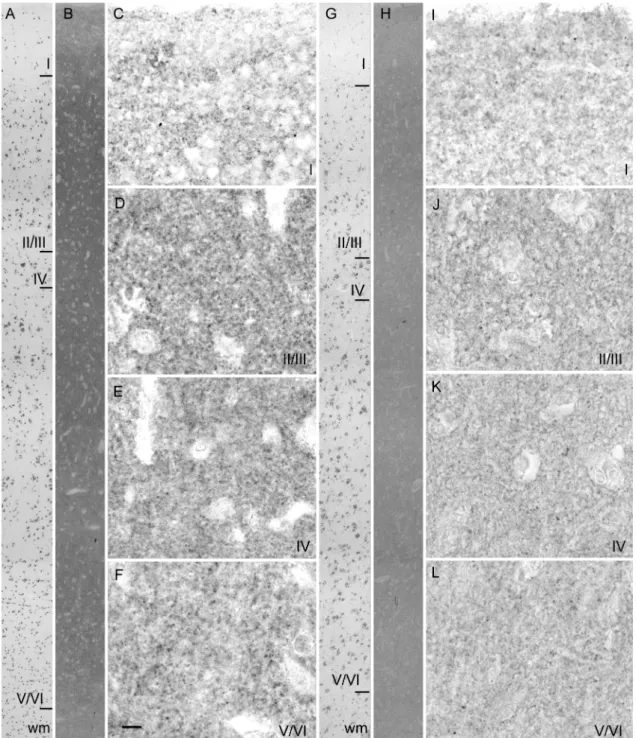
As shown in Fig. 2 (B and H), VGLUT1 immunoreactivity was uniformly distributed in the neuropil of all cortical layers, in agreement with previous reports (Alonso-Nanclares and Defelipe, 2005). On low magnification images, the VGLUT1 decrease in the neocortex of one representative AD patient (Fig. 2H) appeared uniformly distributed. The noise/signal ratio of the anti-VGLUT1 serum on formalin fixed paraffin embedded sections was not sufficient to distinguish individual terminals even at high magnification, so we were not able to quantify VGLUT1-positive terminals in the different layers (Fig. 2C-F and I-L). However, upon visual inspection, the concentration of VGLUT1 seemed to be reduced in these preparations. No dystrophic bulbous glutamatergic terminals were visible in layer II of the AD frontal cortex (Fig. 2J), in contrast to the findings of Bell et al. (2006) in the midfrontal gyrus of late staged AD patients.
3.1.3. Western Blot
The observation in the immunoautoradiography analyses of decreased expression of VGLUT1 and VGLUT2 in a subject initially included as a control who was later shown to have MCI (Fig. 1)
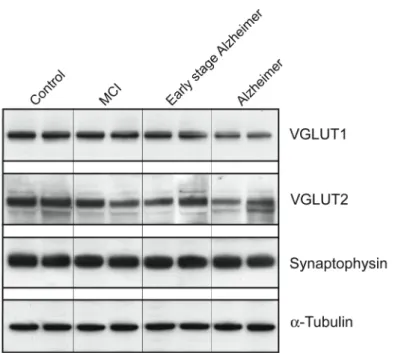
prompted us to quantify VGLUT1 and VGLUT2 in A9 by Western blot at different pathological stages (MCI, early stage Alzheimer and confirmed AD). In addition, we studied the expression of synaptophysin, a synaptic marker, and α-tubulin, a key structural cellular protein.
Representative Western blots of two subjects within each group are shown in Fig. 3. VGLUT1 and VGLUT2 appear to decline progressively with each stage of the disease. The early decline in the expression of both vesicular glutamate carriers observed with immunoautoradiography was confirmed in patients with milder lesions (MCI and early stage Alzheimer, Fig. 3 and Table 2). In MCI subjects, only VGLUT2 was significantly reduced (–28%, p=0.05). Conversely, only VGLUT1 was diminished in early stage Alzheimer patients (–35%). However, since only two subjects were included in this group, this last result should be interpreted with caution.
In AD patients, VGLUT1 and VGLUT2 levels were significantly reduced by –43% (p=0.0001) and – 54% (p=0.002), respectively, when compared to controls (Table 2). Furthermore, synaptophysin was diminished by 24% in AD patients (p=0.007) (Table 2). In contrast, α-tubulin levels remained unchanged regardless of the stage of the disease (not shown), suggesting that modifications of VGLUT1, VGLUT2, and synaptophysin immunolabelling were not due to altered tissue conservation. Recent data indicates that synaptophysin is often associated with VGLUT1-positive terminals but is virtually absent from VGLUT2-positive nerve endings (Herzog et al., 2006). We therefore compared the levels of VGLUT1 and synaptophysin expression in controls and in AD. The VGLUT1/synatpophysin ratio was 6.35 in controls and 4.77 in AD patients. Thus, the VGLUT1/synaptophysin ratio was reduced by only 25% while VGLUT1 was decreased by 43% in AD.
In addition, we assessed the activity of ChAT, the enzyme catalyzing acetylcholine synthesis, in the frontal cortex (Table 2). ChAT activity was stable in MCI and early stage Alzheimer patients. A 30% reduction was observed in patients with confirmed AD, but this difference was not statistically significant.
3.2. Correlation between VGLUT1/VGLUT2 levels in the prefrontal cortex and cognitive status
As shown in Fig. 4 and Table 3, there was a very strong negative correlation between cognitive decline, assessed with the CDR score, and VGLUT1 levels in A9 assessed by Western blot. VGLUT2, tau stage, and Aβx-42 content were also significantly correlated with CDR scores, although less strongly than VGLUT1. No significant correlation was found between the levels of synaptophysin, α-tubulin and ChAT activity in the prefrontal cortex and the cognitive status. It should be noted, however, that in a previous report using the same cohort, Dournaud et al. (1995) found a positive correlation between the intellectual status and ChAT activity in the temporal cortex. These observations suggest that the modulation of VGLUTs described here is region specific.
In order to perform correlation analyses in a larger sample, we combined the results obtained by Western blot (n=16) and immunoautoradiography (n=10). As density values obtained with immunoautoradiography are lower than those obtained with Western blot (Table 2), immunoautoradiography VGLUT1 values were multiplied by a constant value, 25.4, determined from comparing relative density values in immunoautoradiography and Western blot control samples (7.87/0.31). Similarly, VGLUT2 values determined by immunoautoradiography were multiplied by 25.2 (8.07/0.32). Correlation analyses were then performed in 26 subjects (Table 4). In this larger sample,
VGLUT1 and VGLUT2 levels were highly correlated with CDR scores ranging from 0 to 3 (p<0.0001 and 0.0009, respectively), thus confirming what was observed with Western blot only (Table 3). In order to gain insight on earlier steps of cognitive decline, the correlation analyses were then performed with a population of subjects with CDR score ranging from 0 to 2 (moderate dementia) or 0 to 1 (mild dementia). In these two groups of subjects, VGLUT1 and VGLUT2 levels were still significantly correlated with the cognitive status (Table 4).
The decrease in VGLUT1 and VGLUT2 levels determined by Western blot was significantly correlated with disease duration, although the correlation with VGLUT2 was weaker (Table 3). Synaptophysin levels were also correlated with disease duration. VGLUT1 and VGLUT2 expression was correlated with tau stage and β-amyloid levels, although as before, VGLUT2 was less strongly correlated than VGLUT1. In contrast, neither α-tubulin nor ChAT activity were significantly correlated with disease duration, tau stage or β-amyloid levels.
Age, post-mortem delay or gender were not correlated with the levels of VGLUT1, VGLUT2, synaptophysin and α−tubulin detected by Western blot in control cortical samples (data not shown), confirming the results of our previous study performed in human striatal extracts (Kashani et al., 2007).
4. Discussion
4.1. VGLUT1 and VGLUT2 are severely decreased in the prefrontal cortex of AD patients
In the present study, we quantified VGLUT1 and VGLUT2 immunodistribution in the A9 region of the prefrontal cortex from controls and AD patients. Using three different methods (Western blot, immunoautoradiography and immunohistochemistry) we showed a dramatic decline of both vesicular glutamate transporters in the prefrontal cortex of AD patients.
AD is characterized by a progressive and severe decline of cognitive functions whereas sensory-motor functions are affected only at late stages of the disease. Pathological changes are characterized by accumulation of neurofibrillary tangles and senile plaques, which extend progressively to neocortical brain areas during the course of AD. The most severely and precociously affected regions are the entorhinal, hippocampal, and temporal lobes, whereas motor, somatosensory, and primary visual areas are affected later and only slightly. A recent study reported that VGLUT1 protein expression is not affected in the temporal cortex (A21) but is decreased in the parietal (A39) and occipital (A17) cortices of patients with AD (Kirvell et al., 2006). No decrease in VGLUT2 expression was observed in any of these regions (Kirvell et al., 2006). These findings imply an asynchronous pattern of decline of VGLUTs and AD neuropathological changes. In particular, the reductions in VGLUT1 and synaptophysin observed by Kirvell et al. (2006) in the parietal and occipital cortex, together with our results showing decreased expression in VGLUT1, VGLUT2 and synaptophysin in the prefrontal cortex, suggest that the disruption of synaptic functions is an early event in the disease process and can occur even before extensive loss of neurons. In support of this hypothesis, previous studies have shown that synapse loss is an early event in the frontal cortex of AD patients (Masliah et al., 1993, 2001; Neary et al., 1986; Terry et al., 1991). These data reinforce the notion that
components that mediate glutamatergic transmission exhibit specific and complex patterns of variations in AD (Tannenberg et al., 2004). Further studies are needed to confirm these findings in independent datasets, and to better characterize the loss of VGLUTs in different brain regions during the course of the disease.
4.2. Cellular events leading to the loss of VGLUT1 and VGLUT2
Pyramidal cells express VGLUT1 and constitute 70% of the neuronal population in the mammalian cerebral cortex (Winfield et al., 1980). In the prefrontal lobes, large pyramidal cells make long cortico-cortical bundles connecting different cortico-cortical areas. Some subpopulations of these glutamatergic neurons are particularly vulnerable to AD (Bussiere et al., 2003). Large pyramidal neurons in layers IIIc and Va of A9 express high somatodendritic levels of nonphosphorylated neurofilament protein (Bussiere et al., 2003). Using immunohistological detection coupled to stereological analysis, Bussière et al. showed that up to 90% of these pyramidal neurons are lost in the A9 area of the prefrontal cortex of AD patients (Bussiere et al., 2003). Glutamatergic terminals have also been reported to be severely affected by AD (DeKosky and Scheff, 1990). Furthermore, vesicular exocytotic proteins such as synaptobrevin and synaptophysin are selectively and differentially reduced before plasma membrane proteins in the brain of AD patients (Heinonen et al., 1995; Shimohama et al., 1997; Sze et al., 2000). Synaptophysin is a major component of small synaptic vesicles containing classical neurotransmitters such as glutamate. Thus, the involvement of vesicular proteins appears as a central event in the development of AD pathology and the loss of VGLUT1 and VGLUT2 in the prefrontal cortex further supports this notion.
The ~50% reduction of VGLUT1 and VGLUT2 expression in the prefrontal dorsolateral cortex of AD patients could reflect: i) a destruction of cortical glutamatergic neurons and terminals, and/or ii) a specific loss of these vesicular proteins in physically intact terminals. In favor of the first hypothesis, a recent study reported the presence of large dystrophic bulbous VGLUT1-positive terminals in the vicinity of amyloid plaques in the midfrontal gyrus of AD patients (Bell et al., 2006). Also supporting the first hypothesis, loss of pyramidal neurons from layers IIIc and Va as well as terminals is observed in the neocortex in AD (Bussiere et al., 2003; Davies and Wolozin, 1987; DeKosky and Scheff, 1990; Francis, 2003; Hof et al., 1990; Masliah et al., 1994). However, the extent of local pyramidal cell loss (-90%) exceeds the decrease in synapse number (-40%, DeKosky and Scheff, 1990), as well as the decrease in VGLUT protein levels reported here (-50%). Furthermore, the decrease in synaptophysin we observed was only moderate (-24%). Recent reports of the literature suggest that synaptophysin is mainly associated with VGLUT1-positive terminals (De Gois et al., 2005; Herzog et al., 2006). Comparison of the ratio VGLUT1/synaptophysin in the prefrontal cortex of controls and AD patients suggest i) that our results reflect a loss of synaptic protein rather than a loss of nerve ending and ii) that surviving terminals express lower levels of VGLUT1. However, the use of synaptophysin as an index of the number of terminals should be interpreted with caution.
The use of animal models as well as higher resolution anatomical techniques such as electron microscopy could help to clarify the molecular mechanisms underlying the decrease in VGLUT1 and VGLUT2 levels. Interestingly, in mice over-expressing a doubly-mutated form of amyloid protein, the
overall expression of VGLUT1 is decreased by 30% but is increased in areas surrounding the plaques in dystrophic terminals (Bell et al., 2006; Wong et al., 1999).
4.3. Functional consequences of VGLUT1 and VGLUT2 loss
The strength of synaptic transmission is controlled both at the pre- and post-synaptic levels. Recent converging evidence indicates that in contrast to the prevailing idea, glutamate receptors are generally far from saturation during quantal transmission (Liu et al., 1999; Yamashita et al., 2003). Consequently, the variation of glutamate concentration in the synaptic cleft could contribute significantly to the variability of the excitatory current. Glutamate concentration in the synaptic cleft depends on the number of synaptic vesicles, the vesicular concentration of glutamate and changes in the activity of the vesicular transporters (Williams, 1997). Only a small fraction of synaptic vesicles are directly involved at the active zone of the synapse (Murthy and Stevens, 1999). Consequently, after exocytotic release of the neurotransmitter, these active vesicles have to rapidly reload glutamate for the next release. These functional considerations reflect the essential role of vesicular glutamate transporters in glutamatergic transmission. Indeed, recent studies have documented that the concentration of vesicular transporters directly impacts on the strength of synaptic transmission (De Gois et al., 2005; Fremeau et al., 2004b; Wilson et al., 2005; Wojcik et al., 2004).
The prefrontal cortex (A9) is the target of massive intra- and subcortical afferents from almost all sensory modalities, motor cortex and thalamus (Middleton and Strick, 2002; Petrides and Pandya, 1999). This area is profoundly implicated in memory and cognition and is connected by convergent inputs from widespread intra- and subcortical areas. Therefore, massive loss of VGLUT1 and VGLUT2 in the prefrontal cortex of AD patients is likely to dramatically reduce the intensity of glutamatergic transmission and hence exert devastating consequences on cognitive functions by disconnecting this area from other supplying cortical and subcortical regions.
4.4. VGLUT proteins in normal aging, MCI and early stage Alzheimer
MCI is a transitional cognitive stage between normal aging and early dementia, characterized by a slight impairment of cognitive functions (for review see Levey et al., 2006). Although MCI can remain stable or revert to normal, patients with the amnestic subtype of MCI are more likely to develop AD than healthy subjects. The annual conversion rate to AD in patients with amnestic MCI is 16%, compared to 1%-2% in healthy controls (Petersen et al., 2005). Thus, MCI is considered a major risk factor for the development of AD. A key challenge for future studies will be to determine VGLUT levels in the cerebral cortex and hippocampus of subjects with different MCI subtypes. Notably, our results show that VGLUTs are not affected in normal aging, as indicated by the lack of correlation between VGLUT levels and age in control subjects. Ultimately, VGLUTs could be used as biomarkers to differentiate normal aging from MCI and early steps of dementia.
4.5. Correlation between VGLUT1 and VGLUT2 levels and cognitive decline
Numerous correlation studies have tried to link the cognitive decline in AD with various biochemical markers (for review see Francis, 2003). Here we showed that VGLUT1 and VGLUT2 expression in A9 was strongly correlated with CDR scores and that this correlation was stronger than that observed for other conventional markers of AD neuropathology. This result suggests that
glutamatergic neurotransmission in the A9 region is critically involved in the progression of dementia observed in AD. Of particular interest, the loss of VGLUT1 and VGLUT2 in the prefrontal cortex was correlated with cognitive status even at early phases of cognitive decline, in subjects with mild dementia (CDR score = 1) and moderate dementia (CDR score = 2). In the frontal cortex, the synaptophysin loss precedes the cholinergic deficiency (Tiraboschi et al., 2000) and, in our patients, was less pronounced than the loss of VGLUT1 and VGLUT2. Altogether, these observations suggest that altered VGLUT1 and VGLUT2 expression occurs early in the time course of the disease. Consequently, VGLUTs represent a novel and informative biochemical index of the start and progression of dementia in AD. It should be noted, however, that the sample size for this study was small, so the results should be viewed cautiously and will need to be replicated in larger samples with varying degrees of cognitive decline before any definite conclusions can be drawn.
In their recent report, Kirvel and colleagues (2006) observed no significant correlation between VGLUT1 levels in the temporal, parietal and occipital cortices and the cognitive status assessed with the Mini-Mental State Examination. However, a negative correlation was noted between VGLUT1 levels and depression in the temporal and parietal cortices. These findings suggest that the correlation between VGLUT levels and the progression of dementia we observed in the A9 region could be specific to the prefrontal cortex.
AD can be diagnosed only after several years of neurodegenerative process and only post-mortem histopathological investigation can fully confirm this diagnosis. Delay in diagnosis and lack of certainty when patients are still alive hinders the progress of ameliorative therapies. The major finding of our study is the highly significant correlation between VGLUT1 loss and cognitive impairment. This result supports an important role for VGLUTs in AD dementia and suggests that the concentration of VGLUT1 in the prefrontal cortex could be used as an early marker of cognitive decline.
Acknowledgments
This work was supported by grants from Institut National de la Santé et de la Recherche Médicale (INSERM), Fédération pour la Recherche sur le Cerveau (FRC) and Association France Parkinson. AK was supported by a fellowship from Association France Alzheimer. The authors wish to thank the families who generously donated the brain samples for the present research program.
Disclosure Statement
The authors declare that they have no actual or potential conflicts of interest.
References
Alonso-Nanclares L, Defelipe J. Vesicular glutamate transporter 1 immunostaining in the normal and epileptic human cerebral cortex. Neuroscience 2005;134:59-68.
Antuono PG, Jones JL, Wang Y, Li SJ. Decreased glutamate + glutamine in Alzheimer's disease detected in vivo with (1)H-MRS at 0.5 T. Neurology 2001;56:737-42.
Arai H, Kobayashi K, Ichimiya Y, Kosaka K, Iizuka R. Free amino acids in post-mortem cerebral cortices from patients with Alzheimer-type dementia. Neurosci Res 1985;2:486-90.
Bell KF, Ducatenzeiler A, Ribeiro-da-Silva A, Duff K, Bennett DA, Claudio Cuello A. The amyloid pathology progresses in a neurotransmitter-specific manner. Neurobiol Aging 2006;2:1644-57. Braak H, Braak E. Neuropathological stageing of Alzheimer-related changes. Acta Neuropathol (Berl)
1991;82:239-59.
Bussiere T, Giannakopoulos P, Bouras C, Perl DP, Morrison JH, Hof PR. Progressive degeneration of nonphosphorylated neurofilament protein-enriched pyramidal neurons predicts cognitive impairment in Alzheimer's disease: stereologic analysis of prefrontal cortex area 9. J Comp Neurol 2003;463:281-302.
Davies P, Wolozin BL. Recent advances in the neurochemistry of Alzheimer's disease. J Clin Psychiatry 1987;48 Suppl:23-30.
De Gois S, Schafer MK, Defamie N, Chen C, Ricci A, Weihe E, Varoqui H, Erickson JD. Homeostatic scaling of vesicular glutamate and GABA transporter expression in rat neocortical circuits. J Neurosci 2005;25:7121-33.
DeKosky ST, Scheff SW. Synapse loss in frontal cortex biopsies in Alzheimer's disease: correlation with cognitive severity. Ann Neurol 1990;27:457-64.
Delacourte A, David JP, Sergeant N, Buee L, Wattez A, Vermersch P, Ghozali F, Fallet-Bianco C, Pasquier F, Lebert F, Petit H, Di Menza C. The biochemical pathway of neurofibrillary degeneration in aging and Alzheimer's disease. Neurology 1999;52:1158-65.
Deramecourt V, Bombois S, Maurage CA, Ghestem A, Drobecq H, Vanmechelen E, Lebert F, Pasquier F, Delacourte A. Biochemical staging of synucleinopathy and amyloid deposition in dementia with Lewy bodies. J Neuropathol Exp Neurol 2006;65:278-88.
Dournaud P, Delaere P, Hauw JJ, Epelbaum J. Differential correlation between neurochemical deficits, neuropathology, and cognitive status in Alzheimer's disease. Neurobiol Aging 1995;16:817-23.
Dournaud P, Gautron JP, Pattou E, Bons N, Mestre N, Petter A, Kordon C, Epelbaum J. Choline acetyltransferase and somatostatin levels in aged Microcebus murinus brain. Neurobiol Aging 1994;15:727-31.
Folstein MF, Folstein SE, McHugh PR. "Mini-mental state". A practical method for grading the cognitive state of patients for the clinician. J Psychiatr Res 1975;12:189-98.
Fonnum F. A rapid radiochemical method for the determination of choline acetyltransferase. J Neurochem 1975;24:407-9.
Francis PT. Glutamatergic systems in Alzheimer's disease. Int J Geriatr Psychiatry 2003;18:S15-21. Fremeau RT, Jr., Voglmaier S, Seal RP, Edwards RH. VGLUTs define subsets of excitatory neurons
and suggest novel roles for glutamate. Trends Neurosci 2004;27:98-103.
Fremeau RT, Jr., Kam K, Qureshi T, Johnson J, Copenhagen DR, Storm-Mathisen J, Chaudhry FA, Nicoll RA, Edwards RH. Vesicular glutamate transporters 1 and 2 target to functionally distinct synaptic release sites. Science 2004;304:1815-9.
Fujiyama F, Furuta T, Kaneko T. Immunocytochemical localization of candidates for vesicular glutamate transporters in the rat cerebral cortex. J Comp Neurol 2001;435:379-87.
Grouselle D, Winsky-Sommerer R, David JP, Delacourte A, Dournaud P, Epelbaum J. Loss of somatostatin-like immunoreactivity in the frontal cortex of Alzheimer patients carrying the apolipoprotein epsilon 4 allele. Neurosci Lett 1998;255:21-4.
Hardy J, Cowburn R, Barton A, Reynolds G, Lofdahl E, O'Carroll AM, Wester P, Winblad B. Region-specific loss of glutamate innervation in Alzheimer's disease. Neurosci Lett 1987;73:77-80.
Hattori N, Abe K, Sakoda S, Sawada T. Proton MR spectroscopic study at 3 Tesla on glutamate/glutamine in Alzheimer's disease. Neuroreport 2002;13:183-6.
Heinonen O, Soininen H, Sorvari H, Kosunen O, Paljarvi L, Koivisto E, Riekkinen PJ, Sr. Loss of synaptophysin-like immunoreactivity in the hippocampal formation is an early phenomenon in Alzheimer's disease. Neuroscience 1995;64:375-84.
Herzog E, Takamori S, Jahn R, Brose N, Wojcik SM. Synaptic and vesicular co-localization of the glutamate transporters VGLUT1 and VGLUT2 in the mouse hippocampus. J Neurochem 2006;99:1011-8.
Herzog E, Gilchrist J, Gras C, Muzerelle A, Ravassard P, Giros B, Gaspar P, El Mestikawy S. Localization of VGLUT3, the vesicular glutamate transporter type 3, in the rat brain. Neuroscience 2004;123:983-1002.
Herzog E, Bellenchi GC, Gras C, Bernard V, Ravassard P, Bedet C, Gasnier B, Giros B, El Mestikawy S. The existence of a second vesicular glutamate transporter specifies subpopulations of glutamatergic neurons. J Neurosci 2001;21:RC181.
Hof PR, Cox K, Morrison JH. Quantitative analysis of a vulnerable subset of pyramidal neurons in Alzheimer's disease: I. Superior frontal and inferior temporal cortex. J Comp Neurol 1990;301:44-54.
Hughes CP, Berg L, Danziger WL, Coben LA, Martin RL. A new clinical scale for the staging of dementia. Br J Psychiatry 1982;140:566-72.
Kaneko T, Fujiyama F, Hioki H. Immunohistochemical localization of candidates for vesicular glutamate transporters in the rat brain. J Comp Neurol 2002;444:39-62.
Kashani A, Betancur C, Giros B, Hirsch E, El Mestikawy S. Altered expression of vesicular glutamate transporters VGLUT1 and VGLUT2 in Parkinson disease. Neurobiol Aging 2007;28:568-78.
Kirvell SL, Esiri M, Francis PT. Down-regulation of vesicular glutamate transporters precedes cell loss and pathology in Alzheimer's disease. J Neurochem 2006;98:939-50.
Levey A, Lah J, Goldstein F, Steenland K, Bliwise D. Mild cognitive impairment: an opportunity to identify patients at high risk for progression to Alzheimer's disease. Clin Ther 2006;28:991-1001. Lewis DA, Campbell MJ, Terry RD, Morrison JH. Laminar and regional distributions of neurofibrillary
tangles and neuritic plaques in Alzheimer's disease: a quantitative study of visual and auditory cortices. J Neurosci 1987;7:1799-808.
Liu G, Choi S, Tsien RW. Variability of neurotransmitter concentration and nonsaturation of postsynaptic AMPA receptors at synapses in hippocampal cultures and slices. Neuron 1999;22:395-409.
Masliah E, Miller A, Terry RD. The synaptic organization of the neocortex in Alzheimer's disease. Med Hypotheses 1993;41:334-40.
Masliah E, Mallory M, Hansen L, DeTeresa R, Alford M, Terry R. Synaptic and neuritic alterations during the progression of Alzheimer's disease. Neurosci Lett 1994;174:67-72.
Masliah E, Mallory M, Alford M, DeTeresa R, Hansen LA, McKeel DW, Jr., Morris JC. Altered expression of synaptic proteins occurs early during progression of Alzheimer's disease. Neurology 2001;56:127-9.
McCullumsmith RE, Meador-Woodruff JH. Expression of transcripts for the vesicular glutamate transporters in the human medial temporal lobe. Ann N Y Acad Sci 2003;1003:438-42.
Middleton FA, Strick PL. Basal-ganglia 'projections' to the prefrontal cortex of the primate. Cereb Cortex 2002;12:926-35.
Morrison JH, Hof PR. Selective vulnerability of corticocortical and hippocampal circuits in aging and Alzheimer's disease. Prog Brain Res 2002;136:467-86.
Murthy VN, Stevens CF. Reversal of synaptic vesicle docking at central synapses. Nat Neurosci 1999;2:503-7.
Neary D, Snowden JS, Mann DM, Bowen DM, Sims NR, Northen B, Yates PO, Davison AN. Alzheimer's disease: a correlative study. J Neurol Neurosurg Psychiatry 1986;49:229-37.
Pearson RC, Esiri MM, Hiorns RW, Wilcock GK, Powell TP. Anatomical correlates of the distribution of the pathological changes in the neocortex in Alzheimer disease. Proc Natl Acad Sci U S A 1985;82:4531-4.
Permanne B, Buee L, David JP, Fallet-Bianco C, Di Menza C, Delacourte A. Quantitation of Alzheimer's amyloid peptide and identification of related amyloid proteins by dot-blot immunoassay. Brain Res 1995;685:154-62.
Petersen, R.C., Thomas, R.G., Grundman, M., Bennett, D., Doody, R., Ferris, S., Galasko, D., Jin, S., Kaye, J., Levey, A., Pfeiffer, E., Sano, M., van Dyck, C.H., Thal, L.J., 2005. Vitamin E and donepezil for the treatment of mild cognitive impairment. N. Engl. J. Med. 352, 2379–2388.
Petrides M, Pandya DN. Dorsolateral prefrontal cortex: comparative cytoarchitectonic analysis in the human and the macaque brain and corticocortical connection patterns. Eur J Neurosci 1999;11:1011-36.
Scott HL, Pow DV, Tannenberg AE, Dodd PR. Aberrant expression of the glutamate transporter excitatory amino acid transporter 1 (EAAT1) in Alzheimer's disease. J Neurosci 2002;22:RC206. Shimohama S, Kamiya S, Taniguchi T, Akagawa K, Kimura J. Differential involvement of synaptic
vesicle and presynaptic plasma membrane proteins in Alzheimer's disease. Biochem Biophys Res Commun 1997;236:239-42.
Sze CI, Bi H, Kleinschmidt-DeMasters BK, Filley CM, Martin LJ. Selective regional loss of exocytotic presynaptic vesicle proteins in Alzheimer's disease brains. J Neurol Sci 2000;175:81-90.
Tannenberg RK, Scott HL, Westphalen RI, Dodd PR. The identification and characterization of excitotoxic nerve-endings in Alzheimer disease. Curr Alzheimer Res 2004;1:11-25.
Terry RD, Masliah E, Salmon DP, Butters N, DeTeresa R, Hill R, Hansen LA, Katzman R. Physical basis of cognitive alterations in Alzheimer's disease: synapse loss is the major correlate of cognitive impairment. Ann Neurol 1991;30:572-80.
Tiraboschi P, Hansen LA, Alford M, Masliah E, Thal LJ, Corey-Bloom J. The decline in synapses and cholinergic activity is asynchronous in Alzheimer's disease. Neurology 2000;55:1278-83.
Westphalen RI, Scott HL, Dodd PR. Synaptic vesicle transport and synaptic membrane transporter sites in excitatory amino acid nerve terminals in Alzheimer disease. J Neural Transm 2003;110:1013-27.
Williams J. How does a vesicle know it is full? Neuron 1997;18:683-6.
Wilson NR, Kang J, Hueske EV, Leung T, Varoqui H, Murnick JG, Erickson JD, Liu G. Presynaptic regulation of quantal size by the vesicular glutamate transporter VGLUT1. J Neurosci 2005;25:6221-34.
Winfield DA, Gatter KC, Powell TP. An electron microscopic study of the types and proportions of neurons in the cortex of the motor and visual areas of the cat and rat. Brain 1980;103:245-58. Wojcik SM, Rhee JS, Herzog E, Sigler A, Jahn R, Takamori S, Brose N, Rosenmund C. An essential
role for vesicular glutamate transporter 1 (VGLUT1) in postnatal development and control of quantal size. Proc Natl Acad Sci U S A 2004;101:7158-63.
Wong TP, Debeir T, Duff K, Cuello AC. Reorganization of cholinergic terminals in the cerebral cortex and hippocampus in transgenic mice carrying mutated presenilin-1 and amyloid precursor protein transgenes. J Neurosci 1999;19:2706-16.
Yamashita T, Ishikawa T, Takahashi T. Developmental increase in vesicular glutamate content does not cause saturation of AMPA receptors at the calyx of held synapse. J Neurosci 2003;23:3633-8.
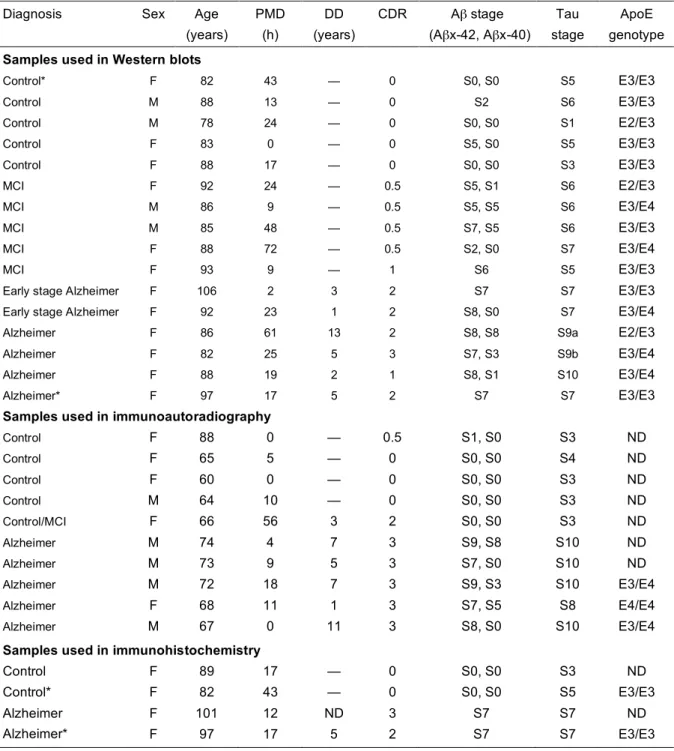
Table 1. Clinical and neuropathological characteristics of patients and controls Diagnosis Sex Age
(years) PMD (h) DD (years) CDR Aβ stage (Aβx-42, Aβx-40) Tau stage ApoE genotype
Samples used in Western blots
Control* F 82 43 — 0 S0, S0 S5 E3/E3 Control M 88 13 — 0 S2 S6 E3/E3 Control M 78 24 — 0 S0, S0 S1 E2/E3 Control F 83 0 — 0 S5, S0 S5 E3/E3 Control F 88 17 — 0 S0, S0 S3 E3/E3 MCI F 92 24 — 0.5 S5, S1 S6 E2/E3 MCI M 86 9 — 0.5 S5, S5 S6 E3/E4 MCI M 85 48 — 0.5 S7, S5 S6 E3/E3 MCI F 88 72 — 0.5 S2, S0 S7 E3/E4 MCI F 93 9 — 1 S6 S5 E3/E3
Early stage Alzheimer F 106 2 3 2 S7 S7 E3/E3
Early stage Alzheimer F 92 23 1 2 S8, S0 S7 E3/E4
Alzheimer F 86 61 13 2 S8, S8 S9a E2/E3
Alzheimer F 82 25 5 3 S7, S3 S9b E3/E4
Alzheimer F 88 19 2 1 S8, S1 S10 E3/E4
Alzheimer* F 97 17 5 2 S7 S7 E3/E3
Samples used in immunoautoradiography
Control F 88 0 — 0.5 S1, S0 S3 ND Control F 65 5 — 0 S0, S0 S4 ND Control F 60 0 — 0 S0, S0 S3 ND Control M 64 10 — 0 S0, S0 S3 ND Control/MCI F 66 56 3 2 S0, S0 S3 ND Alzheimer M 74 4 7 3 S9, S8 S10 ND Alzheimer M 73 9 5 3 S7, S0 S10 ND Alzheimer M 72 18 7 3 S9, S3 S10 E3/E4 Alzheimer F 68 11 1 3 S7, S5 S8 E4/E4 Alzheimer M 67 0 11 3 S8, S0 S10 E3/E4
Samples used in immunohistochemistry
Control F 89 17 — 0 S0, S0 S3 ND
Control* F 82 43 — 0 S0, S0 S5 E3/E3
Alzheimer F 101 12 ND 3 S7 S7 ND
Alzheimer* F 97 17 5 2 S7 S7 E3/E3
Abbreviations: Aβ, amyloid β peptide; ApoE, apolipoprotein E; CDR, Cognitive Dementia Rating; DD, disease
duration; F, female; M, male; MCI, mild cognitive impairment, ND, not documented; PMD, post-mortem delay. * One control and one Alzheimer patient were analyzed both by Western blot and immunohistochemistry.
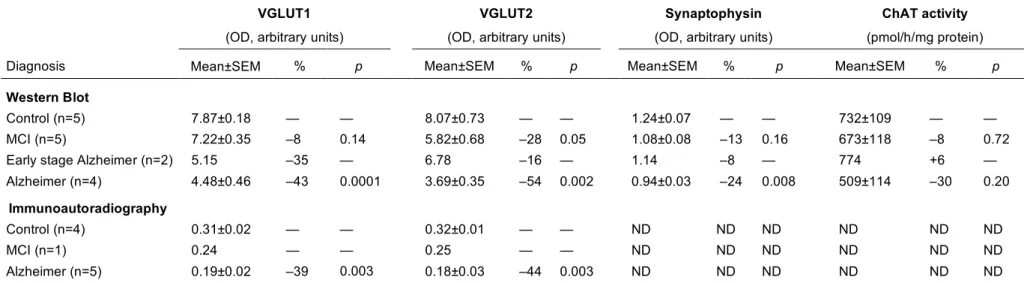
Table 2. Quantification of VGLUT1, VGLUT2 and synaptophysin immunoreactivity and ChAT activity in the prefrontal cortex of controls and patients at different stages of AD
VGLUT1
(OD, arbitrary units)
VGLUT2
(OD, arbitrary units)
Synaptophysin
(OD, arbitrary units)
ChAT activity
(pmol/h/mg protein)
Diagnosis Mean±SEM % p Mean±SEM % p Mean±SEM % p Mean±SEM % p
Western Blot
Control (n=5) 7.87±0.18 — — 8.07±0.73 — — 1.24±0.07 — — 732±109 — —
MCI (n=5) 7.22±0.35 –8 0.14 5.82±0.68 –28 0.05 1.08±0.08 –13 0.16 673±118 –8 0.72
Early stage Alzheimer (n=2) 5.15 –35 — 6.78 –16 — 1.14 –8 — 774 +6 —
Alzheimer (n=4) 4.48±0.46 –43 0.0001 3.69±0.35 –54 0.002 0.94±0.03 –24 0.008 509±114 –30 0.20
Immunoautoradiography
Control (n=4) 0.31±0.02 — — 0.32±0.01 — — ND ND ND ND ND ND
MCI (n=1) 0.24 — — 0.25 — — ND ND ND ND ND ND
Alzheimer (n=5) 0.19±0.02 –39 0.003 0.18±0.03 –44 0.003 ND ND ND ND ND ND
%, percentage of decrease compared to respective control. P values were calculated using Student's t test. Abbreviations: ChAT, choline acetyl transferase; MCI, mild cognitive impairment; ND, not determined; OD, optical density.
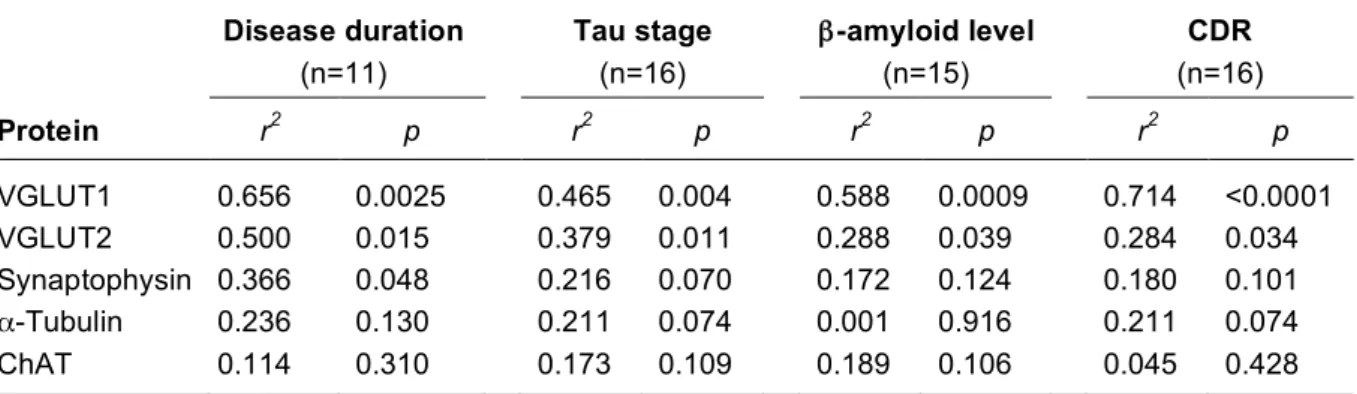
Table 3. Influence of disease duration, tau stage, β-amyloid level, and dementia on protein levels in samples of the prefrontal cortex of AD patients
Disease duration (n=11) Tau stage (n=16) β-amyloid level (n=15) CDR (n=16) Protein r2 p r2 p r2 p r2 p VGLUT1 0.656 0.0025 0.465 0.004 0.588 0.0009 0.714 <0.0001 VGLUT2 0.500 0.015 0.379 0.011 0.288 0.039 0.284 0.034 Synaptophysin 0.366 0.048 0.216 0.070 0.172 0.124 0.180 0.101 α-Tubulin 0.236 0.130 0.211 0.074 0.001 0.916 0.211 0.074 ChAT 0.114 0.310 0.173 0.109 0.189 0.106 0.045 0.428
VGLUT1, VGLUT2, synaptophysin, and α-tubulin levels were quantified by Western blot in Brodmann area 9 (A9). Aβx-42 levels and ChAT activity were also determined in A9. Correlation analyses were performed with the Pearson's test in the 16 samples used in Western blot and listed in Table 1 (5 controls, 5 MCI, 2 early Alzheimer and 4 Alzheimer).The β-amyloid level was not available for one early AD patient (n=15). The correlation with the disease duration was only performed in the patient group, i.e., MCI, early AD and AD patients (n=11).
Abbreviations: ChAT, choline acetyl transferase; CDR, clinical dementia rating.
Table 4. Correlation of CDR score with VGLUT1 and VGLUT2 levels determined by Western blot and by immunoautoradiography in the total sample
CDR Score 0-3 (n=26) CDR Score 0-2 (n= 20) CDR Score 0-1 (n= 15) Protein r2 p r2 p r2 p VGLUT1 0.655 <0.0001 0.583 <0.0001 0.257 0.054 VGLUT2 0.377 0.0009 0.276 0.017 0.303 0.033
VGLUT1 and VGLUT2 levels were determined by Western blot (n=16) or immunoautoradiography (n=10) and the results were combined for correlation analyses. As density values obtained with immunoautoradiography are lower, in order to combine the datasets, immunoautoradiography values were multiplied by a constant, determined from comparing relative density values in immunoautoradiography and Western blot control samples. Correlation analyses with CDR scores ranging between 0-3, 0-2 or 0-1 were performed with the Pearson's test.
Figure 1. Detection of VGLUT1 and VGLUT2 expression by immunoautoradiography in the prefrontal cortex from
post-mortem tissues of one representative control and one AD patient. The lower panels show the scatter diagrams of VGLUT1 and VGLUT2 levels quantified on autoradiograms in controls, AD patients and in one subject with MCI (mild cognitive impairment). Results are expressed as optical density (OD) in arbitrary units. Each point represents the mean of 3 or 4 determinations per subject. Mean group values and standard error of means are also shown.
Figure 2. Immunohistological detection of VGLUT1 in the prefrontal cortex of a representative control subject
(B-F) and an AD patient (H-L). A and G) low power photomicrographs of a Cresyl violet stained section: cortical layers can be clearly identified. Adjacent sections were immunostained with anti-VGLUT1 antiserum and photomicrographs were taken at low (B and H) or high magnification (C-F and I-L) at the level of layer I (C, I), II/III (D, J), IV (E, K) and V/VI (F, L). Scale bar in F = 40 µm in A, B, G and H; 10 µm in C-F and I-L. Abbreviations: wm, white matter; I-VI, layers I to VI of the cerebral cortex.
Figure 3. VGLUT1, VGLUT2, synaptophysin and α-tubulin levels assessed by Western blot in the prefrontal
cortex of controls, MCI, early stage Alzheimer or AD patients. Representative Western blots of 2 individuals within each group are shown.
Figure 4. Correlations between cognitive status assessed with the Clinical Dementia Rating (CDR) scores and
VGLUT1, VGLUT2, tau stage, Aβx-42 levels, synaptophysin, and ChAT activity. Higher CDR scores are indicative of cognitive impairment. Correlation analyses were performed with the Pearson’s test.