Groundwater dynamics and streamflow
generation in a mountainous headwater
catchment
Process understanding from field experiments and
modeling studies
Thèse présentée à la Faculté Science, Centre d’hydrogéologie et
géothermie (CHYN), Université de Neuchâtel
Pour l’obtention du grade de docteur ès Science
Par
Jana von Freyberg
Acceptée sur proposition du jury:
Prof. Mario Schirmer
University of Neuchâtel, Switzerland, directeur de these
Prof. Daniel Hunkeler
University of Neuchâtel, Switzerland, co-directeur de these
Prof. Philip Brunner
University of Neuchâtel, Switzerland, rapporteur
Prof. P. Suresh C. Rao
Purdue University, USA, rapporteur
Dr. Ilja van Meerveld
University of Zurich, Switzerland, rapporteur
Soutenue le 14 Janvier 2015
Université de Neuchâtel 2015
2000 Neuchâtel - Suisse Tél: + 41 (0)32 718 2100 E-mail: [email protected]
IMPRIMATUR POUR THESE DE DOCTORAT
La Faculté des sciences de l'Université de Neuchâtel
autorise l'impression de la présente thèse soutenue par
Madame Jana von FREYBERG
Titre:
“
Groundwater dynamics and streamflow generation
in a mountainous headwater catchment –
Process understanding from field experiments and
modeling studies
”
sur le rapport des membres du jury composé comme suit:
- Prof. ass. Mario Schirmer, Université de Neuchâtel, directeur de thèse
- Prof. Daniel Hunkeler, co-directeur de thèse, Université de Neuchâtel
- Prof. Philip Brunner, Université de Neuchâtel
- Prof. Suresh Rao, Purdue University, USA
- Dr Ilja van Meerveld, Université de Zürich
Neuchâtel, le 2 mars 2015
Le Doyen, Prof. B. Colbois
Mots clés: décharge, nappe phréatique, propriétés de la terre, modélisation, versant amont, chute de pluie – ruissellement, recharge, génération de débits, seuils, domaines contribuant variable
Keywords: discharge, groundwater, landscape properties, modeling, mountainous headwater catchment, rainfall-runoff, recharge, streamflow generation, thresholds, variable contributing areas
i
S
UMMARY
Mountainous headwater catchments are often characterized by a high intrinsic variability of climatic and physiographic properties with steep gradients. As temperature, precipitation as well as soil types, vegetation cover and surface topography change with altitude, complex interrelations between the different variables of the water cycle occur and a broad range of hydro(geo)logical regimes and can be found on a rather small scale. In many regions of the world, small headwater catchments in mountainous regions are one of the most important sources of freshwater. However, environmental changes due to human interference, such as agriculture, pollution and water consumption, are likely to negatively affect quality and quantity of ground- and surface water is such catchments. In order to protect and sustainably manage these fragile hydro(geo)logic systems in high elevations, not only does our mechanistic understanding of groundwater flow and streamflow-generation processes in mountainous headwater catchments has to be improved, but also the complex land-atmosphere interactions with groundwater have to be understood.
In order to close that research gap, four particular aspects of the hydro(geo)logic processes in mountainous catchment systems were investigated within this PhD project. These aspects relate the first-order controls on groundwater recharge (i.e., climatic forcing and landscape properties) and the responses driven by groundwater discharge (i.e., streamflow generation and solute transport). In order to adequately describe hydrogeologic processes in mountainous headwater catchments, a holistic approach was pursued, which involved field experiments and analytical modeling. Hydro-climatic data from a dense observation network in the Swiss pre-Alpine upper Rietholzbach Research Catchment (URHB, ~1km2) were used,
where the major variables of the water cycle are continuously monitored at high temporal and spatial resolution.
The processes of groundwater recharge (GR) were investigated through a systematic assessment of of six frequently used GR estimation methods that differ in terms of the underlying concepts and complexity. These methods utilize experimental data (lysimeter, river streamflow, groundwater-table variations) as well as soil-water-balance and physically-based modeling concepts. From the inconsistencies among the applied GR estimation methods
first-ii
order controls of GR were identified that helped to better understand GR mechanisms. It could be shown that the effects of snowmelt-driven GR and water losses through evapotranspiration are very pronounced in the shallow aquifer in the valley bottom (unconsolidated Moraine deposits). Compared to this, GR recharge into the deep, fractured-rock aquifer at higher elevations is less affected by climatic variability. In essence, this project illustrates that a correct interpretation of the GR estimates requires knowledge about the dominant hydro(geo-)logical properties of the catchment because a direct evaluation with detailed GR observations at the plot scale (e.g., lysimeter data) is often not possible.
A more detailed analysis of groundwater dynamics at the event-time scale revealed that groundwater from the shallow aquifer in the valley bottom of the URHB represents the dominant fraction of peak flow during most rainfall periods. When high-intensity rainfall events coincide with wet antecedent moisture conditions, the shallow groundwater table intersects the upper, generally more permeable soil layers at the bottom of the hillslopes, leading to return flow and shallow subsurface stormflow. In addition, surface runoff is generated at the saturated, flat areas in the valley bottom of the catchment (riparian zones). Since the hillslopes are also agricultural areas, nutrient concentrations in river water largely reflect the hydrochemical signal of the groundwater from the shallow aquifer. The riparian zones, however, likely act as sink for solutes (e.g., phosphorous), which are discharged from the agriculturally used hillslopes. During rainfall events, flushing of solutes from the riparian zone can be expected, which may alter the chemograph of the RHB-river.
The conceptual description of the hydro(geo)logic system in the URHB was evaluated with an analytical model that consists of two linear reservoirs for event-flow generation and a baseflow storage with relatively constant discharge rates. Here, rainfall-driven event flow is generated in the riparian zones and the adjacent hillslopes, while baseflow was assumed to originate from the deep fractured-rock aquifer and to be rather constant. The model adequately reproduced the observed streamflow signal, however, the performance improved after implementation of the variable contributing area concept. Although the shrinking/expansion of the riparian zones is small compared to the total catchment area (up to 14 %), this process strongly controls the streamflow hydrograph when wet antecedent moisture conditions coincide with high-intensity rainfall periods.
This PhD project compiles various a practical approaches to analyze and characterize groundwater systems and streamflow-generation mechanisms in mountainous headwater catchments. By focusing on the two dominant drivers, climate and subsurface properties, an important foundation for future research is provided that deals with potential negative effects of climate change and land use on water quality and quantity in mountainous headwater catchments.
iii
Z
USAMMENFASSUNG
Einzugsgebiete in Gebirgen sind häufig durch eine grosse Variabilität klimatischer und physiografischer Einflussgrössen mit steilen Gradienten charakterisiert. Die höhenabhängige Veränderung von Temperatur- und Niederschlagsregimen, Bodentypen und –bedeckung, als auch der Topographie führen zu komplexen Wechselwirkungen mit den verschiedenen Grössen des Wasserkreislaufs und somit einer weiten Bandbreite hydro(geo)logischer Systeme auf kleinem Raum. Weltweit bilden solche Kopfeinzugsgebiete in Gebirgen eine bedeutende Trinkwasserressource für die dicht besiedelten Regionen in den tiefer gelegenen Ebenen. Die hohe Qualität und Quantität dieser Ressourcen ist jedoch häufig bedroht durch zunehmende Umwelteinflüsse, wie zum Beispiel Landwirtschaft ,Verschmutzung oder Wasserentnahme. Es ist daher notwendig, ein umfassendes mechanistisches Verständnis der Grundwasserfliessprozesse und der Abflussbildung unter Einbeziehung der Land-Atmosphären-Wechselwirkungen zu entwickeln, um diese (potentiellen) Probleme richtig zu erfassen und eine nachhaltige Nutzung dieser fragilen hydro(geo)logischen Systeme zu ermöglichen.
Das Ziel dieser Doktorarbeit war es somit, vier verschiedene Aspekte der Hydrogeologie von Kopfeinzugsgebieten im Gebirge zu untersuchen, welche sich auf die wichtigsten Einflussfaktoren auf die Grundwasserneubildung (d.h. Klima und Landschaftseigenschaften) und den Auswirkungen von Grundwasserabfluss (d.h. Prozesse der Abflussbildung und Stofftransport) konzentrieren. Um eine repräsentative und genaue Beschreibung hydrogeologische Prozesse zu ermöglichen, wurde ein holistischer Forschungsansatz verfolgt, der feld-basierte Experimente und numerische Modellierung kombiniert. Im vor-Alpinen Kopfeinzugsgebiet des Rietholzbachs (RHB, ,~3km2) wurde ein
dichtes hydrogeologisches Beobachtungsnetzwerk installiert, welches die bereits existierende meteorologische und hydrologische Messstation erweitert. Dieser Aufbau ermöglicht eine simultane Beobachtung der wesentlichen Variablen des Wasserkreislaufs in sehr hoher zeitlicher und räumlicher Auflösung.
Durch die systematische Auswertung verschiedener Verfahren zur Abschätzung der Grundwasserneubildung unter Einbeziehung von Langzeitmessdaten eines Wägelysimeters
iv
konnten die relevanten Einflussfaktoren auf Infiltrationsprozesse identifiziert und beschrieben werden. Es konnte gezeigt werden, dass die Hydrogeologie im RHB-Einzugsgebiet durch einen tiefen (verfestigte Molassesedimente) und einen flachen (unverfestigte Moränenschotter) Grundwasserleiter geprägt ist, was sich in einer grossen Variabilität der Verweilzeiten im Untergrund niederschlägt. Grundwasserneubildung in den unverfestigten Moränenschottern in der Talebene und den unteren Hängen wird meistens durch vertikale Versickerung durch die Bodenmatrix bestimmt. Dieser Teil der Doktorarbeit demonstrierte zudem, dass eine richtige Interpretation von Grundwasserneubildungsraten nur gewährleistet werden kann, wenn die wesentlichen hydraulischen Eigenschaften des Einzugsgebiets bekannt sind.
Eine detaillierte Untersuchung von Niederschlagsereignissen über einen Zeitraum von zwei Jahren zeigte, dass ein wesentlicher Anteil des Gebietsabflusses der flachen Talsohle sowie den angrenzenden Hängen entstammt. Schneller Grundwasserabfluss in den oberen, besser durchlässigen Bodenschichten tritt jedoch häufig erst dann auf, wenn Starkniederschläge mit einer hohen Vorfeuchte einhergehen. Zusätzlich kommt es zum Oberflächenabfluss auf den gesättigten Flächen in der Talsohle Kopfeinzugsgebietes. Da diese Hänge auch landwirtschaftlich genutzt werden, zum Beispiel als Weideland oder Mähwiesen, spiegeln sich die Nährstoffkonzentrationen im flachen Grundwasserleiter auch im Flusswasser während mittlerer Fliessraten wider. Die angrenzende Talsohle hingegen wirkt vermutlich als Speicher für Nährstoffe (z. Bsp. Phosphor) durch das kontinuierlich anströmende Grundwasser von den Hängen. Während Niederschlagsereignissen kann es daher verstärkt zu einer Auswaschung dieser Substanzen in das Gewässer kommen.
Die konzeptionelle Beschreibung des Grundwasserregimes und der beteiligten Prozesse bei der Abflussbildung im RHB-Einzugsgebiet wurde mithilfe eines numerischen Modells überprüft. Es besteht in Wesentlichen aus zwei linearen Speichern (Hänge und flache Talsohle), die während eines Niederschlagsereignisses nur wenig verzögert zum Abfluss beitragen. Zudem wurde angenommen, dass der Basisabfluss dem tiefen Grundwasserleiter entspringt und daher nur eine geringe zeitliche Variabilität aufweist. Auf der Grundlage von unveränderlichen Flächenanteilen der beiden Speicher relativ zum Gesamteinzugsgebiet gaben die Modellberechnungen das beobachtete Abflussregime relativ gut wieder. Jedoch verbesserte sich die Simulation deutlich, wenn das Konzept der variablen beitragenden Flächen in das Modell implementiert wurde. Mit Hilfe des Modells konnte eine maximale Ausdehnung der gesättigten Flächen in der Talsohle um 14% bestimmt werden, was somit die feldbasierten Beobachtungen bestätigte und quantifizierte.
Die Ergebnisse dieser Doktorarbeit stellen einen möglichen Arbeitsansatz vor, welcher der Erfassung von hydrogeologischen Systemen und relevanter Abflussbildungsprozesse in Kopfeinzugsgebieten mit ähnlichen Landschaftsmerkmalen dient. Die gewonnenen Erkenntnisse leisten zudem einen wesentlichen Beitrag zu einem besseren Verständnis der beteiligten Faktoren (z. Bsp. Klima, Eigenschaften des Untergrundes), welche die hydrogeologischen Prozesse in solchen Gebieten steuern. Dieses Prozessverständnis bildet die notwendige Grundlage für ein nachhaltiges Wasserressourcenmanagement in gebirgigen Einzugsgebieten.
v
A
CKNOWLEDGEMENTS
First of all, I wish to express my sincere thanks to my main supervisor, Prof. Mario Schirmer, who initiated this project, raised the financial support and invited me to work in his group at Eawag. I very much appreciate his trust in my work, his positivity and the scientific freedom that allowed me to develop my own ideas.
I would also like to thank my second supervisor, Prof. Suresh Rao for all the interesting discussions and new ideas, his kindness and contagious curiosity. Further, I wish to thank Prof. Daniel Hunkeler for his help and Prof. James Kirchner for supporting me during the last months of this project. Thank you Dr. Ilja van Meerveld and Prof. Philip Brunner for joining the jury and for taking the time to read this thesis.
I wish to acknowledge the financial support from the Swiss National Science Foundation for the project “Alpine Hydrogeology and Climate Change” and the Doc-Mobility grant that allowed me to visit the Universities of Purdue and PennState.
For sharing the data sets from Rietholzbach and valuable scientific feedback, I would like to thank the groups of Prof. Sonia Seneviratne from ETH Zurich, especially Dr. Irene Lehner and Dr. Martin Hirschi, as well as of Prof. Jan Seibert from the University of Zurich. Very helpful support during fieldwork and in the lab was generously provided by Andy Raffainer, Roger Mégroz, Armand Rochat, Julien Nikiéma, Bahareh Kianfar, Marco Fleischmann, Numa Pfenninger and the AuA-lab team, in particular Denise Freudemann and Madlene Langmeier. I highly appreciate the generosity of the family Sennhauser in Gähwil, who allowed me to conduct the field experiments in the Rietholzbach catchment.
This PhD would not have been possible without the support and the positive spirit I received from so many colleagues and friends at Eawag, ETH Zurich and Purdue University! Thanks a lot to all of you: Ann-Kathrin and Chris McCall, Bas Vriens, Nina Franz, Natallia Zaremba, Lina Tyroller, Elham Rouholahnejad, David Machac, Rebekka Gulde, Vidhya Chittoor Viswanathan, Sabine Hoffmann, Behnam Doulatyari, Stefano Basso, Anna Senn, Anne-Marie Kurth and Mehdi Ghasemizade! Special thanks to Dirk Radny and Christian Möck, whose jokes made my day even in the most stressful situations. For making me feel at home and for being a great flat mate, many thanks to Anja Bretzler. Thanks to Heather Gall, who showed me how to achieve true greatness by inviting me into her life.
I am very grateful to my grandparents, my parents and my brother Henri for always being there for me. I gained most of my confidence from their love and proudness that makes me feel very lucky.
For endless encouragement and companionship and for beeing a unique part of this journey: Tim, let me say thank you with all of my heart!
vii
T
ABLE OF CONTENTS
S
UMMARY...
IZ
USAMMENFASSUNG...
IIIA
CKNOWLEDGEMENTS...
VT
ABLE OF CONTENTS...
VIIF
IGURES...
IXT
ABLES...
XIIIL
IST OF SYMBOLS...
XIVI
NTRODUCTION... 1
RESEARCH OBJECTIVES ... 3
STRUCTURE OF THE THESIS ... 3
P
ARTI ... 5
I -‐ 1
INTRODUCTION ... 6
I -‐ 2
MATERIALS AND METHODS ... 7
I -‐ 2.1
Study site and observed data ... 7
I -‐ 2.2
Recharge estimation methods ... 9
I -‐ 2.3
Drought characteristics ... 12
I -‐ 3 RESULTS ... 13
I -‐ 3.1 Comparison of annual GR estimates ... 13
I -‐ 3.2
Comparison of monthly recharge estimates ... 15
I -‐ 3.3
Comparison of drought characteristics ... 17
I -‐ 3.3.1
Drought deficit and duration ... 17
I -‐ 3.3.2
Historical most severe dry periods ... 19
I -‐ 4 STRENGTHS AND LIMITATIONS OF THE GR ESTIMATION METHODS ... 22
I -‐ 5 SUMMARY AND CONCLUSIONS ... 27
S
UPPLEMENTARY INFORMATION OFP
ARTI ... 29
P
ARTII ... 37
II – 1
INTRODUCTION ... 38
II -‐ 2
MATERIALS AND METHODS ... 39
II -‐ 2.1
Site description and Instrumentation ... 39
II -‐ 2.2
Rainfall characteristics and antecedent moisture conditions (AMC) ... 42
II – 2.3
Topographic analysis and groundwater flow directions ... 43
II -‐ 3
RESULTS AND DISCUSSION ... 43
viii
II – 3.1.1
The role of antecedent moisture conditions (AMC) and rainfall
characteristics ... 44
II -‐ 3.1.2
Towards a conceptual model at the hillslope-‐scale ... 47
II -‐ 3.2
Streamflow response to rainfall events ... 47
II -‐ 3.3 Seasonal variability of hydrometric parameters and solute concentrations in riparian zone, hillslope and URHB-‐river ... 49
II -‐ 3.4
Synthesis of hillslope-‐ and catchment-‐scale hydrological responses: implications for nutrient export ... 52
II -‐ 4
CONCLUSIONS ... 54
S
UPPLEMENTARY INFORMATION OFP
ARTII ... 57
P
ARTIII ... 63
III – 1 INTRODUCTION ... 64
III -‐ 2 SITE DESCRIPTION ... 65
III -‐ 3 METHODS ... 67
III -‐ 3.1 Monitoring and data processing ... 67
III -‐ 3.2
A minimalistic, threshold-‐based model for the simulation of groundwater dynamics and event flow ... 68
III -‐ 3.3 Estimation of hillslope groundwater recharge and discharge ... 70
III -‐ 4 RESULTS AND DISCUSSION ... 71
III -‐ 4.1 Dominant flow processes and delineation of hydrological landscape units ... 71
III -‐ 4.1.1 Streamflow analysis at the catchment scale ... 71
III -‐ 4.1.2 Groundwater dynamics at the Büel site ... 71
III -‐ 4.2 Estimation of hillslope groundwater recharge and discharge from observed groundwater table data ... 73
III -‐ 4.3 Simulation of hillslope groundwater dynamics ... 75
III -‐ 4.4 Simulation of event-‐flow hydrographs at the catchment scale ... 77
III -‐ 4.4.1 Constant contributing areas (CCA) ... 77
III -‐ 4.4.2 Variable contributing areas (VCA) ... 78
III – 5 CRITICAL EVALUATION OF THE MODELING RESULTS AND IMPLICATIONS FOR THE CONCEPTUALIZATION OF MOUNTAINOUS CATCHMENT HYDROLOGY ... 79
III -‐ 5.1 Sensitivity analysis ... 80
III -‐ 5.2 Total event-‐flow generating area ... 80
III – 6 CONCLUSIONS ... 81
S
UPPLEMENTARY INFORMATION OFP
ARTIII ... 83
G
ENERALC
ONCLUSIONS ANDO
UTLOOK... 95
GENERALIZATION OF THE RESULTS ... 96
PERSPECTIVES ... 98
A
PPENDIXA ... 101
ix
F
IGURES
Figure 1 The upper Rietholzbach catchment (URHB) in the western part of the Rietholzbach research catchment (RHB) and location of the meteorological station (black box) and the river gauge (black cross) near the outlet of the URHB; (a) Schematic description of the lysimeter system (modified after SENEVIRATNE et al. (2012)): (1) Container, (2) concrete wall, (3) cellar, (4) soil, (5) filter (sand and gravel), (6) electronic scales, (7) drainage outlet, (8) grass; (b) Location of the URHB in the Thur basin in north-east Switzerland. . 8
Figure 2 Drought characteristics (modified after MISHRA and SINGH (2010)). ... 12
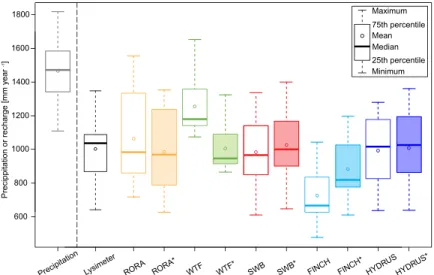
Figure 3 (a) Boxplots of annual sums of snow water equivalent (SWE), observed and simulated groundwater recharge for the observation period 2000-2012; (b) Mean annual sums of lysimeter seepage (grey bars) and groundwater recharge estimates (colored lines) based on daily data for the observation period 2000-2012, plotted on the left-hand axis. The right-hand axis shows values of annual mean sums of SWE (solid grey line) and the long-term average of SWE (dashed grey line). ... 13
Figure 4 Yearly GR estimates (lysimeter: black, RORA: orange, WTF: green, SWB: red, FINCH: light blue, HYDRUS: dark blue) for the observation period 2000-2012 with GR-values on the left-hand axis. The right-hand axis shows GR-values of yearly precipitation (solid grey line) and the long-term average of precipitation (dashed grey line). (a) GR estimation methods with uncalibrated model parameters, (b) GR estimation methods with calibrated parameters (“*”). ... 15
Figure 5 Mean-monthly GR estimates (lysimeter: black, RORA: orange, WTF: green, SWB: red, FINCH: light blue, HYDRUS: dark blue) for the observation period 2000-2012 with GR-values on the left-hand axis. The right-hand axis shows values of mean-monthly actual evapotranspiration (AET, dashed grey line) and mean-monthly precipitation (solid grey line). (a) GR estimation methods with uncalibrated model parameters, (b) GR estimation methods with calibrated parameters (“*”). ... 16
Figure 6 Cumulative distribution plots of deficit volumes of dry period for the six GR estimation methods and precipitation. The line colors and GR estimation methods are: lysimeter: black, RORA: orange, WTF: green, SWB: red, FINCH: light blue, HYDRUS: dark blue. (a) and (b) Deficit volume per month for GR estimates with uncalibrated and calibrated (“*”) model parameters, respectively; (c) and (d) deficit volume per event for GR estimates with uncalibrated and calibrated (“*”) model parameters, respectively. The respective threshold values and the number of events are provided in Table 3. ... 18
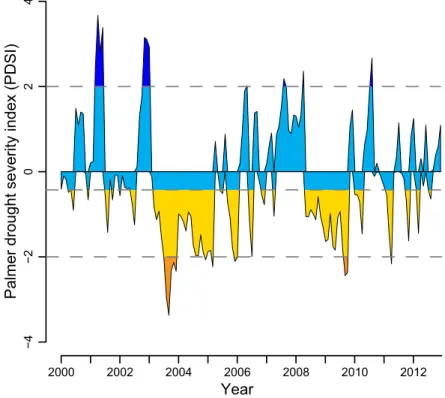
Figure 7 Palmer drought severity index (PDSI) for the URHB, 2000-2012. ... 20
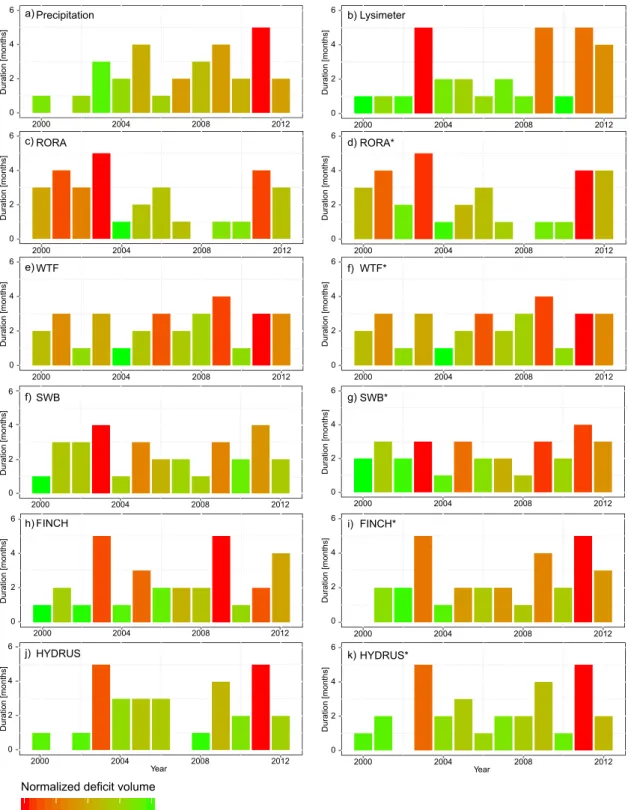
Figure 8 Drought duration and normalized deficit volumes for all GR estimation methods for each year of the observation period based on monthly data. The length of the bar indicates the number of dry periods (months) per year. The color scale represents the severity of the droughts per year, i.e. high or low deficit volumes are indicated by a reddish or greenish color, respectively. ... 21
x
Figure 9 (a) Location of the Upper Rietholzbach sub-catchment (URHB) as part of the Thur catchment in NE Switzerland; (b) Field site Büel with meteorological (MET) station and piezometers; (c) Cross section along the piezometer transect P1 – P8 of the field site Büel in the URHB sub-catchment. Depth of the lithological units are based on electrical resistivity tomography surveys and soil core sampling. Box-plots of groundwater table variations during 1 June 2011 and 31 August 2013 along the transect P1-P8 (red line: median, box: 10th and 90th percentile, whiskers: 25th and 75th percentile). ... 40
Figure 10 Schematic description of calculated event features. ... 42
Figure 11 (a) Initial discharge versus lag times of groundwater tables at the hillslope (P1) and riparian zone (P5, P8); (b) Response times of discharge versus response times of groundwater levels at P1 and P5 for rainfall events with Qini ≥ 20 L s-1 ... 44
Figure 12 (a) Cumulative rainfall versus absolute rise of groundwater level at piezometer location P1; (b) Cumulative rainfall versus event discharge. ... 45
Figure 13 Groundwater flow directions at the field site Büel, (a) locations of the piezometer triangles with average initial groundwater flow directions before the 7 events: 110° (A), 99° (B), 103° (C), 72° (D); (b) Maximum ranges of groundwater flow directions for triangles A, C, D and E during 7 rainfall events in 2012 (12 April, 7 June, 9 June, 18 June, 21 June, 25 June, 29 July). ... 46
Figure 14 Correlation of AMC and runoff coefficients for all rainfall events. (a) Initial discharge (Qini); (b) antecedent precipitation index (AP7). ... 48
Figure 15 Runoff coefficient versus mean rainfall intensity for events with very wet and dry antecedent moisture conditions (AMC). (a) AMC represented by antecedent precipitation index (AP7); (b) AMC represented by initial discharge (Qini). ... 49
Figure 16 Seasonal variability of hydro-climatic variables and solutes in ground- and river water in the Upper Rietholzbach sub-catchment (URHB); (a-i) (Box) plots of monthly average values or sums from 1 July 2011 till 31 August 2013, with values for 2011 (yellow), 2012 (green) and 2013 (red): a) Rainfall (standard rain gauge at 1.5 m, Dec 2011: 667 mm is not shown); (b) Actual evapotranspiration (lysimeter); (c) Air temperature (2m); (d) Total streamflow; e-f) Groundwater table depth at the riparian zone and hillslope, respectively (due to logger failure there were no data recorded at P8 between 1 May to 30 May 2013 and 16 June to 13 September 2013); (g-i) Electrical conductivity; (j-l) Calcium, chloride and silicit acid concentrations during 2012 (chloride concentrations in river water on 6 December 2011: 64.7 mg L-1 and 22 February 2011: 18.1 mg L-1 are not shown); m-o) Nitrate and total phosphorous concentrations during 2012. ... 50
Figure 17 Surface and landscape properties in the Upper Rietholzbach sub-catchment (URHB) and at the Büel site; (a) Geological units (Upper Freshwater Molasse: UFM, quaternary moraine deposits: QMD)) and Gleysol distribution; (b) Slope and riparian zone (yellow-framed area); (c) Topographic wetness Index (TWI); a paved street crosses the catchment on the south-facing slope, which causes locally artificially high TWI-values. ... 53
xi Figure 18 (a) Location of the Rietholzbach catchment (RHB) as part of the Thur basin in NE Switzerland; (b) Boundary of the Upper Rietholzbach sub-catchment (URHB) (white line) as the western part of the RHB and location of the Büel site (black square); (c) Büel site with observation network and main soil types (modified after KUHN (1980)); the side
channel joins the URHB-river downstream of the gauging station. ... 66
Figure 19 Schematic description of the minimalistic modeling concept consisting of two parallel, event-flow generating linear reservoirs (hillslope, riparian zone) and a baseflow reservoir. Following model parameters are presented: root zone depth (zr); depth to
groundwater table (zgw ); depth of the groundwater table (zr); depth to the confining layer
(zconf); precipitation (P); actual evapotranspiration (ET); groundwater recharge (R);
groundwater discharge (D); event flow (Qe); total river streamflow (Q). ... 68
Figure 20 Cumulative probabilities of daily groundwater table dynamics at piezometer locations P1 to P6 and P8 during 1 July-31 October 2011 and 1 March-31 October 2012. (a) Groundwater tables below the ground surface (zgw); (b) saturated thickness above the
confining layer (zconf - zgw). Due to the shallow slope of the confining layer zconf – zgw was
largest around the middle of the transect (P2, P3) and not at the uppermost location (P1), where zconf – zgw was on average 0.6 m smaller. ... 72
Figure 21 Daily streamflow of the URHB (Q, including baseflow) versus estimated hillslope groundwater volume Vgw (φ = 0.075) during 1 July-31 October 2011 and 1 March-31
October 2012. The grey shaded areas indicate baseflow (Q < 1.4 mm d-1, dark grey) and
conditions below median flow (Q < 2.8 mm d-1, light grey). The same ranges of flow conditions are valid for porosities of φ = 0.05 and 0.1, respectively. ... 74
Figure 22 Estimated monthly mean hillslope groundwater recharge during 1 July-31 October 2011 and 1 March-31 October 2012. Whiskers of groundwater recharge describe the uncertainties for effective porosities (φ) ranging between 0.05 and 0.1 and for the lysimeter seepage a 10 % measurement uncertainty (SENEVIRATNE et al., 2012). The dashed line indicates the linear regression function with a slope of 1.62. The data point of March 2012 was excluded from the analysis due to logger failure at the lysimeter set-up. Further, the lysimeter seepage in August 2012 was considered unrepresentative since the physical properties of the weighting lysimeter lead to an anomalous high soil moisture deficit in this month compared to the surrounding environment (GURTZ et al., 2003a). Due to the absence of a groundwater table and the prevention of lateral groundwater flow into the lysimeter cylinder, a soil moisture deficit caused by evapotranspiration cannot be replenished by capillary rise and may persist over longer time periods. It is assumed that such a high soil moisture deficit developed in the lysimeter in July 2012, leading to very low seepage rates in August 2012, where only 12 % of the average seepage rate (59 mm month-1) was measured. ... 75
Figure 23 Comparison of cumulative sums of (a) estimated (R, grey) with simulated groundwater recharge (R’, blue) and (b) estimated (D, grey) with simulated (D’, blue) groundwater discharge per day and unit area from the hillslope reservoir during 15 July-31 October 2011 (dashed line) and 15 March-July-31 October 2012 (continuous line); the first 15 days of each simulation year were neglected; (c) Time series of estimated (Vgw, grey)
xii
observed minimum Vgw(t) for each year (t = 7 July 2011 and t = 7 April 2012,
respectively); effective porosity of the aquifer (φ) is 0.075. ... 76
Figure 24 (a) Daily rainfall; (b) Event hydrograph predictions with CCA and VCA: Observed (grey shaded areas) and simulated event hydrographs with constant (blue dashed) and variable (red solid) portions of hydrological landscape during 15/3-31 October 2011 and 15/3-31 October 2012; event flow is streamflow minus baseflow, which was estimated by the recursive filter method of NATHAN and MCMAHON (1990); (c) Portion of riparian zone relative to the total catchment area. ... 77
Figure 25 Comparison of flow duration curves (fdc) of observed (black line with uncertainty bounds of 15 % in grey) and simulated event flow assuming constant contributing areas (CCA, blue line) and variable contributing areas (VCA, red line); please note the logarithmic x-axis; (a) Whole observation period (1 March-31 October 2011 and 1 March-31 October 2012), each first month was used as initialization period in the model and was excluded from the analysis, the inset figure shows the fdc for the upper 20th percentile of event flow rates (linear x-axis); (b) 2011 observation period; (c) 2012 observation period. ... 79
xiii
T
ABLES
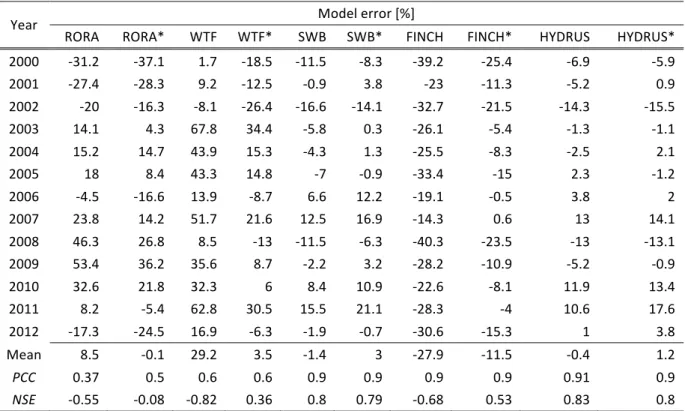
Table 1 Yearly sums of lysimeter seepage and model performance criteria (model error, Pearson’s correlation coefficient (PCC), Nash-Sutcliffe efficiency (NSE)) of yearly GR estimates relative to observed lysimeter data. Calibrated GR estimation methods are marked with a “*”-sign. ... 14
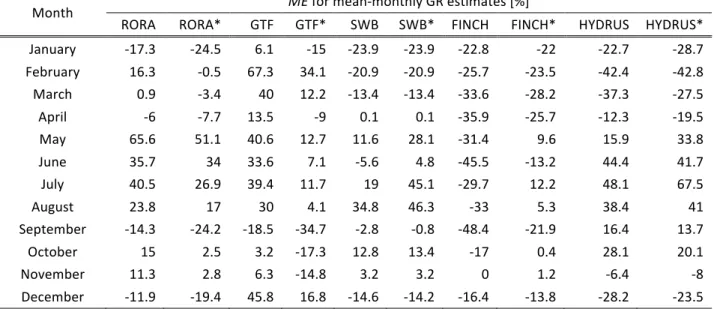
Table 2 Mean-monthly sums of lysimeter seepage and model performance criteria (model error, Pearson’s correlation coefficient (PCC), Nash-Sutcliffe efficiency (NSE)) of mean-monthly GR estimates relative to observed lysimeter data for the observation period 2000-2012. Calibrated GR estimation methods are marked with a “*”-sign. ... 16
Table 3 Drought characteristics for the hydrological time series precipitation and GR estimates based on monthly data. ... 19
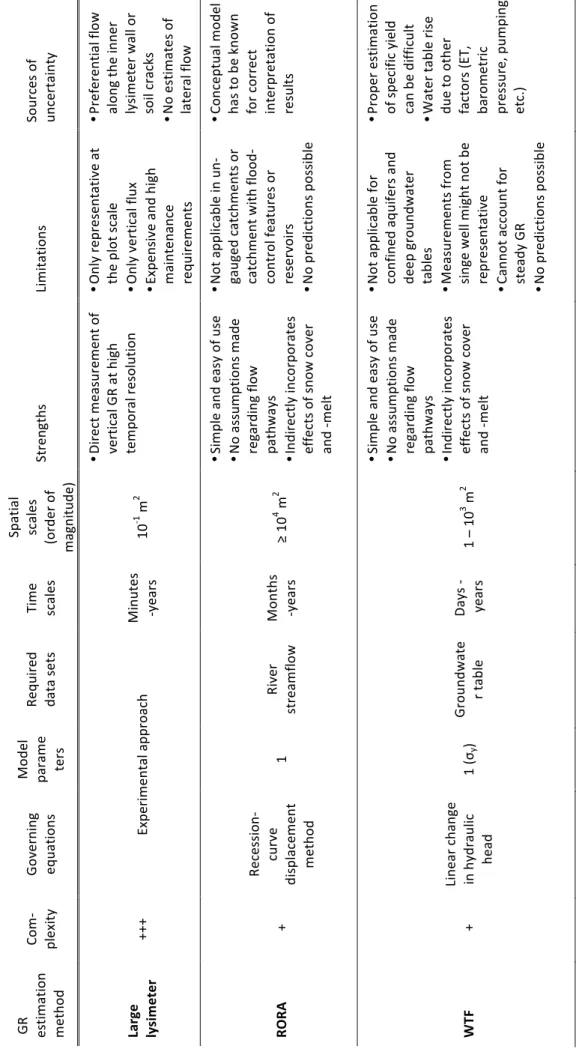
Table 4 Evaluation of six established GR estimation methods ... 25
Table 6 Properties of piezometers at the Büel site in the URHB. Local slopes were computed with the “Local Morphometry” module in the open source software SAGA GIS based on a 2 m x 2 m digital elevation model (DEM) with vertical resolution of 0.5 m (SwissALTI3D, swisstopo) ... 41
Table 6 Properties of the piezometers installed at the Büel site in the URHB. The top edges of all piezometer pipes are between 8 cm to 22 cm below the ground surface (bsf). ... 67
xiv
L
IST OF SYMBOLS
Latin symbols
Ae Event-flow generating area %
Ah Areal portion of the hillslopes %
Arz Areal portion of the riparian zones %
Atot Total catchment area L3
CR Runoff coefficient -
D Drought duration T
Dh Estimated hillslope groundwater discharge L T-1
Dh' Simulated hillslope groundwater discharge L T-1
ECQ Electrical conductivity of the river water µS cm-1
ECGW Electrical conductivity of the groundwater µS cm-1
ET, AET Actual evapotranspiration L T-1
GR Groundwater recharge L T-1
GWmax Maximum groundwater table elevation L
h Depth to groundwater table L
kgw Hillslope groundwater recession constant T-1
P Rainfall L T-1
Pe Effective rainfall L
PET Potential evapotranspiration L T-1
Psum Cumulative rainfall during one event L
Q Total URHB-river streamflow L T-1
Qe Event flow (streamflow minus baseflow) L T-1
Qe’ Simulated event flow L T-1
Qini Initial river streamflow L T-1
Qmax Maximum river streamflow L T-1
Rh Estimated hillslope groundwater recharge L T-1
Rh' Simulated hillslope groundwater recharge L T-1
R2 Coefficient of determination for simple linear regression -
S Storage L
Tlag Lag time between GWmax and Qmax T
Tres Response time T
V Drought deficit volume L
Vgw Estimated hillslope groundwater volume L3 T-1
Vgw’ Simulated hillslope groundwater volume L3 T-1
zconf Depth to confining layer L
xv
zr Depth of active soil layer L
zgw Depth to groundwater table L
Greek symbols
α Direction of flow °
φ Aquifer effective porosity -
σy Specific yield -
θ Soil moisture content -
θdef Soil moisture deficit -
θ* Soil moisture threshold -
1
I
NTRODUCTION
Water is involved fundamentally in many physical, chemical and socio-economic processes and thus is essential for the development of all life. One of the most important sources of freshwater are small headwater catchments in mountainous regions whose river discharge significantly sustains water bodies in the lowlands (WOODWELL, 2004; VIVIROLI et al., 2003). In Switzerland, around 80 % of the total river network is comprised by high-elevation catchments (MUNZ et al., 2012) that serve as a major resource for drinking water
production from spring discharge and groundwater aquifers (FREIBURGHAUS, 2012).
Mountainous headwater catchments also provide essential habitats for unique, highly adapted species (MEYER et al., 2007).
Many mountainous environments are characterized by a high intrinsic variability of climatic and physiographic properties with steep gradients, where temperature, precipitation as well as soil types, vegetation cover and surface topography change with altitude (BURLANDO
et al., 2002). Hence, a broad range of hydro(geo)logical regimes and feedback mechanisms can be found on a rather small scale (WEINGARTNER et al., 2003). Mountainous headwater catchments are thus inherently interesting study sites that allow for a holistic investigation of surface and subsurface water flow processes and land-atmosphere interactions. This is of particular importance for the evaluation of possible effects of climate- and land use change on these environments.
Hydro(geo)logical systems in mountainous regions are known to be very sensitive to environmental changes associated with human interference such as agriculture, pollution and water consumption (e.g., HEILLWELL et al., 2008; PLATE, 1998). For instance, small rivers
from Swiss pre-Alpine headwater catchments were found to exhibit much higher peak concentrations of pesticides during rainfall events compared to larger catchments (MUNZ et al.,
2012). This is attributed to the extensive use of small catchments for agriculture and as pastureland (STRAHM et al., 2013) in combination with generally quick streamflow responses
due to short groundwater residence times and overland flow.
Further, climate change is likely to accelerate the hydrologic cycle, which would affect nutrient and bio-geochemical cycles and have negative impacts on water quality and aquatic
2
ecosystems (e.g., BENISTON and FOX, 1996; JASPER et al., 2004; ZIERL and BUGMANN, 2005). For instance, the Intergovernmental Panel on Climate Change predicted an increase in runoff of 10 - 40 % by mid-century at higher latitudes (IPCC, 2007). Higher air temperatures in spring cause earlier snow- and glacier melt in the mountains that may lead to destructive floods in the lowlands (e.g., BARNETT et al., 2005; ECKHARDT and ULBRICH, 2003; MAXWELL
and KOLLET, 2008). On the other hand, mountainous catchments are expected to be very vulnerable to reduced precipitation rates and droughts, which can have cascading effects on local and downstream freshwater bodies (CALANCA, 2007).
A sustainable management of freshwater resources, however, requires an integrated understanding of the dominant physical feedback mechanisms between components of the hydrologic cycle. Over the last decades, numerous studies have focused dominantly on near-surface processes, for instance spatio-temporal variability of soil moisture, streamflow dynamics or water quality in rivers. However, groundwater is known to contribute a large fraction of the streamflow hydrograph (SKLASH and FARVOLDEN, 1979), especially in
mountainous catchments where steep hydraulic gradients form effluent river systems. Groundwater discharge also affects the chemical composition of river streamflow. For example, during precipitation events the hydrochemical signal of the stream may not necessarily reflect the hydrological response because ‘old’ groundwater with a very different composition becomes mobile (BISHOP et al., 2004; KIRCHNER, 2003). Such highly non-linear
interactions between ground- and surface water are a major feature of hydro(geo)logic systems in mountainous regions that are often correlated to the exceedance of site-specific thresholds of antecedent moisture conditions or rainfall intensity (e.g., MCGRATH et al., 2007; TROMP -VAN MEERVELD and MCDONNELL, 2006b).
Despite the importance of groundwater to hydrological responses and water quality, investigations of groundwater dynamics in high-altitude catchment systems are comparably rare. Because of steep terrain, missing infrastructure or extreme weather conditions in such areas, the development and implementation of comprehensive hydrogeological investigation and monitoring strategies remains challenging (BURLANDO et al., 2002). Most of the relevant
previous work in mountainous catchment hydrogeology is related to fractured rock (e.g., MILLARES et al., 2009; LAUDON and SLAYMAKER, 1997; GABRIELLI et al., 2012), although a number of research groups have also worked on unconsolidated aquifers (ALLEN et al., 2010b; ROY and HAYASHI, 2009).
The description and simulation of hydrologic connectivity between groundwater dynamics and climate drivers in mountainous watersheds require long-term datasets and integrated field experimentation (JENCSO and MCGLYNN, 2011). Due to the fact that
hydro(geo)logical functions and patterns cover a wide range of scales (TROCH et al., 2009),
measurements at different spatiotemporal scales have to be integrated. For instance, at the catchment scale SIMONI et al. (2011) observed a significant impact of spatial variability of meteorological forcing (precipitation and temperature) on streamflow generation in a field-based study in the Swiss Alps. This observation is further supported by the findings of ZLOTNIK et al. (2011) that indicate that small- and large-scale anisotropy of hydraulic
conductivity strongly control the structure of topography driven groundwater flow. Frequently, a threshold dependent connectivity between the valley bottom and the hillslopes can be
3 observed in mountainous catchments, which also affects small-scale flow dynamics like groundwater-surface water-interaction in the riparian zone (e.g., BENCALA et al., 2011; DETTY
and MCGUIRE, 2010; TETZLAFF et al., 2007). The water flow through the very last meters of
the valley bottom before entering the stream is seen as a significant first-order control on stream water chemistry and ecosystem functioning (SEIBERT et al., 2009). These examples emphasize the necessity of a general framework for monitoring and describing subsurface flow processes in mountainous headwater catchments. However, many studies mention a lack of detailed long-term data that allow the investigation of the natural wide range of control factors on groundwater dynamics and streamflow responses (JAMES and ROULET, 2009).
R
ESEARCH OBJECTIVES
This PhD thesis investigates groundwater dynamics and its role for river water quantity and quality in mountainous headwater catchments under consideration of four particular aspects. These aspects refer to the first-order controls of groundwater recharge (i.e., climate forcing and landscape properties) as well as to the responses driven by groundwater discharge (i.e., streamflow generation and solute transport). By applying field and modeling techniques at an experimental site in the Swiss pre-Alps, this PhD thesis addresses some of the many complexities of hydrogeology in mountainous environments at different spatio-temporal scales. Specifically, the research objectives of this research are the following:
• Investigation of groundwater recharge mechanisms through the systematic comparison of groundwater recharge estimation methods at different spatio-temporal scales and for average and extreme climatic conditions;
• Identification of dominant streamflow-generating mechanisms and threshold-responses with focus on groundwater discharge;
• Evaluation of the impact of agricultural land use and related transport of solutes and nutrients towards the river by groundwater discharge.
• Development of a conceptual rainfall-runoff model at the hillslope- and the catchment scale, which is validated with an analytical model;
S
TRUCTURE OF THE THESIS
According to the research objectives stated above, this PhD thesis consists of three parts, which focus on four different aspects of hydro(geo)logic processes in mountainous headwater catchments.
Part I GROUNDWATER RECHARGE
Various established groundwater estimation methods were compared among each other and against lysimeter seepage measurements at different time scales in order to systematically evaluate the implications of model complexity and initial assumptions on their
4
predictive strengths. From the model performances, important physical mechanisms regarding catchment functioning and groundwater recharge processes were identified.
Part II STREAMFLOW-‐GENERATING MECHANISMS AND NUTRIENT TRANSPORT
This chapter presents an extensive analysis of continuous time series of groundwater table depth, rainfall, streamflow and water quality at the hillslope- and the catchment scale at an experimental site in the Swiss pre-Alps. In particular, short-term responses to rainfall events were investigated in order to identify site-specific threshold responses. Based on this assumption, a conceptual model of streamflow generation and nutrient transport from the agricultural areas into the stream were developed.
Part III
E
VALUATION OF THEC
ONCEPTUALM
ODEL ANDS
IMULATION OFE
VENT-‐F
LOWG
ENERATION The conceptual model developed in parts I and II was evaluated by means of a semi-distributed, minimalistic modeling scheme that consists of two parallel linear storage reservoirs. These reservoirs represent the main hydrologic landscape elements at the experimental site that differ in terms of their dominant streamflow-generating properties. The application of the analytical model revealed the importance of variable contributing areas for peak flow rates. Particularly, during long and high-intensity rainfall events the area of saturation-overland-flow generation increases, which has implications on peak flow rates and nutrients export.In the CONCLUSIONS AND OUTLOOK section at the end of this thesis the key findings are summarized and conclusions are drawn. This also includes an outlook on possible challenges for future research that arise from this thesis.
5
P
ART
I
G
ROUNDWATER
R
ECHARGE
A reliable quantification of groundwater recharge (GR) is essential for sustainable water resources management. This is particularly relevant when considering climate change and predicted increase in the duration and frequency of drought events. Although there exists a large variety of GR estimation methods, their results can differ considerably for a site due to the spatio-temporal scales and complexities they represent. Therefore, it is crucial to evaluate the potential range of GR estimates to allow for consistency and objective inter-comparison of modeling results among different sites. This motivates the present study, which systematically assesses the performance of six frequently used GR estimation methods that differ in terms of the underlying concepts and complexity. These methods utilize experimental data (lysimeter, river streamflow, groundwater-table variations) as well as soil-water-balance and physically-based modeling concepts. 13 years of hydro-climatic data were analyzed from the Swiss Rietholzbach research catchment under consideration of different temporal resolutions and extreme climatic conditions (i.e., dry periods). The major limitations and strengths of the six methods were identified and summarized in a comprehensive overview that may assist future studies to choose an adequate technique for the estimation of GR.
JANA VON FREYBERG,CHRISTIAN MOECK,MARIO SCHIRMER,Estimation of groundwater recharge and drought severity with varying model complexity, Journal of
Hydrology (submitted1).
1 Please note that this is the revised version of an article submitted to Journal of Hydrology in February
6
I
-‐
1 I
NTRODUCTION
Groundwater recharge (GR) is a driver of many hydrologic processes, which makes it an important variable in the water cycle (BAKKER et al., 2013). Thus, for sustainable water resources management a reliable quantification of GR is essential, particularly considering the effects of climate change on water resources (e.g., GREEN et al., 2011; MIDDELKOOP et al., 2001; VAN ROOSMALEN et al., 2009). A large number of methods exist, which aim at the
quantification of GR from available hydro(geo-)logic and climatic measurements (BAKKER et
al., 2013). Frequently used physical techniques for GR estimation utilize direct measurements of lysimeters (e.g., HEPPNER et al., 2007; RISSER et al., 2005; XU and CHEN, 2005), temporal variations of river streamflow (e.g., ARNOLD and ALLEN, 1999; COMBALICER et al., 2008;
NATHAN and MCMAHON, 1990; RORABAUGH, 1964) or groundwater-table (e.g. CROSBIE et
al., 2005; HEALY and COOK, 2002; MARÉCHAL et al., 2006). Furthermore, unsaturated-zone
modeling can be applied to estimate GR, such as analytic soil water balance models (e.g., BOND, 1998; FINCH, 1998; RODRIGUEZ-ITURBE et al., 1999) or numerical modeling using
Richards’ equation (e.g., CROSBIE et al., 2011; JYRKAMA and SYKES, 2007; KEESE et al.,
2005; SIMUNEK and VAN GENUCHTEN, 2008; VAN ROOSMALEN et al., 2009). Because GR
estimation is very sensitive to the underlying climatic forcing functions and the parameters of the chosen method (RISSER et al., 2005; SAVENIJE, 2004; SCANLON et al., 2002), it is generally recommended to apply several techniques and to compare the GR estimates among each other (NIMMO, 2003; HEALY and COOK, 2002). This, however, is not always practicable because of
limited data availability. For example, many climate change impact studies apply solely one GR estimation method (e.g., ALLEN et al., 2010a; GODERNIAUX et al., 2009; ORDENS et al., 2014; VAN ROOSMALEN et al., 2009). Typically, the uncertainty, which is introduced by the
chosen GR estimation method, cannot be evaluated objectively and may lead to controversy results. This might be of importance also for drought risk assessment studies in hydrological systems where GR is closely linked to catchment storage and the streamflow regime (e.g., BENISTON and FOX, 1996; CALANCA, 2007; JASPER et al., 2004; VANHAM et al., 2009).
Therefore, GR estimation methods should also be analyzed with respect to both, mean and extreme climatic conditions to allow for an accurate assessment. This could be achieved, for instance, by comparing different GR time series during very dry climatic conditions by means of drought characteristics (e.g., duration and severity, MISHRA and SINGH, 2010). Although
there are several comparison studies focusing on GR (e.g., ALLISON et al., 1994 FLINT et al.,
2002; GEE and HILLEL, 1988; LERNER et al., 1990; SCANLON et al., 2002; SIMMERS, 1998;
SOPHOCLEOUS, 1991; SORENSEN et al., 2014; XU and CHEN, 2005), still little research work systematically evaluated the accuracy and the validity of the applied GR estimation techniques under this important aspect.
In addition, a comprehensive comparison of GR estimation methods can serve as a valuable learning tool that helps to identify first-order controls on GR recharge and to improve our mechanistic understanding of the involved hydro(geo)logic processes (e.g., BEVEN, 2007;
DUNN et al., 2008; FENICIA et al., 2014). As a reference for estimated GR, experimental data
from large lysimeters (>2 m depth, >1-2 m2 area) can be used. Despite certain limitations of lysimeters (SCANLON et al., 2002), they provide a unique technology for direct measurements of the soil water balance that is also representative for larger scales (SENEVIRATNE et al., 2012;
7 YOUNG et al., 1996). These systems that extend below the rooting depth of plants, are assumed to provide reliable estimates of GR that will reach the groundwater table without further loss mechanisms (HEPPNER et al., 2007). To our knowledge, there only exists one study in which
data from a large lysimeter were compared against GR estimates based on evapotranspiration models used in water balance equations (XU and CHEN, 2005). Since appropriate systems are difficult to construct and require high maintenance, there are only a few comparison studies employing long-term lysimeter data, however, from smaller systems (e.g., HEPPNER et al.,
2007; RISSER et al., 2005).
In order to provide a comprehensive evaluation of six widely established GR estimation methods, the main objectives of this study are: (i) to identify the major strengths and limitations of the methods at different time scales and climatic conditions by using measurements from a large lysimeter system and to employ drought characteristics; (ii) to learn from the inconsistencies among the applied GR estimation methods to identify first-order controls and to better understand GR mechanisms.
The GR estimation methods tested in this study span a large variety of approaches and complexities (i.e., number of model parameters and type of input variables) as well as different spatial scales (i.e., plot to catchment scale). These methods are: (a) large lysimeter measurements; (b) streamflow-based automated recession-curve displacement method (RORA, RUTLEDGE and DANIEL, 1994); (c) groundwater-table fluctuation method (WTF, HEALY and COOK, 2002); soil water balance models with (d) one (SWB, RODRIGUEZ-ITURBE et al., 1999)
and (e) four soil layers (FINCH, FINCH, 1998) and (f) a physically-based, one-dimensional
model (HYDRUS, SIMUNEK and VAN GENUCHTEN, 2008). Daily hydro-climatic data from the
Swiss Rietholzbach research catchment were used, spanning a 13-year period (2000-2013) that coves a sufficiently large variability of climatic conditions.
First, all methods were compared on an annual and monthly basis against each other by using field and literature data as initial model parameters. The same analysis was carried out after calibrating methods (b) to (f) against lysimeter data (calibrated models are marked with a “*”-sign). This allows for a more robust assessment of the performance and meaningful comparison of the methods, despite the differences in the underlying modeling concepts. In the second part of this chapter, drought characteristics were calculated from monthly GR time series to systematically evaluate the performance of the different methods during very dry climatic conditions. These results are then discussed to identify the main strengths and limitations of the six methods. From this, conclusions about flow processes and streamflow generation in the studied catchment are derived and recommendations for the effective estimation of GR at different spatio-temporal scales are provided.
I
-‐
2 M
ATERIALS AND METHODS
I -‐ 2.1 Study site and observed data
The Rietholzbach research catchment is located in the pre-Alpine headwaters of the Thur river in north-east Switzerland (Figure 1c). Its western sub-catchment (upper
8
Rietholzbach, URHB, red line in Figure 1a) covers an area of 0.94 km2, from which around 72 % is pastureland, 19 % is forested, 4 % is settlement and pavement and 5 % is a wetland located in the central valley bottom. Elevations in the URHB range from 744 to 910 masl with a more gentle topography in the valley bottom, which is underlain by Pleistocene glacial moraine deposits (Figure 1a).
Figure 1 The upper Rietholzbach catchment (URHB) in the western part of the Rietholzbach research catchment (RHB) and location of the meteorological station (black box) and the river gauge (black cross) near the outlet of the
URHB; (a) Schematic description of the lysimeter system (modified after SENEVIRATNE et al. (2012)): (1) Container, (2)
concrete wall, (3) cellar, (4) soil, (5) filter (sand and gravel), (6) electronic scales, (7) drainage outlet, (8) grass; (b) Location of the URHB in the Thur basin in north-‐east Switzerland.
The moraine deposits are a heterogeneous composition of unconsolidated conglomerates and Quaternary gravel pockets that form a shallow, unconfined groundwater aquifer with an average hydraulic conductivity of 2x10⁻³ m s-1 (BALDERER, 1980). The bedrock
is formed by the Upper Freshwater Molasse, that is layers of consolidated conglomerates, sandstone, marl and freshwater limestone, with hydraulic conductivities between 1.5x10⁻⁶ m s-1 and 1.1x10⁻⁴ m s-1 (BALDERER, 1983). Vertical groundwater flow between the two aquifers is assumed to be minor due to a confining low-permeability layer of clay and silt beneath the
9 moraine deposits (VON FREYBERG et al., 2014). The soils in the valley bottom areas are mainly peaty soils and Gleysols, whereas on the hills and slopes Cambisols and Regosols are dominant (GERMANN, 1981).
All hydro-climatic variables (such as river streamflow, precipitation, groundwater-table depth) are measured at the experimental field site ‘Büel’ that is located near the URHB-catchment outlet (Figure 1a). Further details about the instrumentation of the Büel site and data post-processing are provided in the supplementary information of part I (Table SI- 1) and in Seneviratne et al. (2012). Data used in this study span from 1 January 2000 to 31 December 2012 and cover variable climatic conditions from very wet to very dry periods (Figure SI- 1). For instance, in the year 2003, an extreme summer heat wave occurred that affected large parts of central Europe (CASTY et al., 2005). Other years with less severe dry periods in the Swiss north-eastern pre-Alps were 2009 and 2011 (METEOSWISS, 2009; METEOSWISS, 2011). Wet periods with several high-intensity precipitation events or a significant accumulation of snow occurred in 2001, 2002 and 2007 (Figure SI- 1a). During the 13-year period, average annual values of precipitation, actual evapotranspiration, river streamflow and lysimeter seepage were 1465 mm, 649 mm, 1188 mm and 1003 mm, respectively. The hydroclimatology of the catchment is representative for the eastern Swiss Plateau (SENEVIRATNE et al., 2012).
I -‐ 2.2 Recharge estimation methods
Large lysimeter
The large weighting lysimeter (2.5m deep, 2m diameter) is located at the experimental field site ‘Büel’ near the URHB-catchment outlet (Figure 1a,b). The lysimeter cylinder was filled with an undisturbed soil column from the same location in 1976. The system imitates the surrounding surface and subsurface properties, which allows a direct measurement of actual evapotranspiration and drainage through the unsaturated zone at the plot scale (e.g., SENEVIRATNE et al., 2012; STUMPP and MALOSZEWSKI, 2010). Since groundwater table depths at the site are generally shallow (< 5 m beneath ground surface, Figure SI- 1d) and the average rooting depth is around 0.3 m (GERMANN, 1981) it is assumed that measured lysimeter
drainage is a good indicator for GR at daily temporal resolution. Uncertainties might be introduced by a distorted soil-moisture and pressure-head profile due to the open drainage collection system (SCANLON et al., 2002) and preferential flow along the inner lysimeter wall.
However, considering the size and age of the lysimeter, these effects are likely to be minor. Although, only local processes at the plot scale are captured within the lysimeter, the observed recharge correlates well with the RHB river-streamflow signal (SENEVIRATNE et al., 2012).
RORA model
The computer program RORA (RUTLEDGE and DANIEL, 1994; RUTLEDGE, 2007)
estimates GR from daily streamflow records by using the recession-curve displacement method after Rorabaugh (1964). The method is based on a one-dimensional analytical model that assumes streamflow recessions to represent instantaneous groundwater discharge in a
10
homogeneous aquifer with uniform recharge. The hydraulic soil properties are indirectly represented through the recession index (K), which is defined as the average time required for groundwater discharge to recede by one log cycle (RUTLEDGE and DANIEL, 1994). An initial
K-value of 25.6 days was obtained for the nearly linear parts of the streamflow hydrographs of
the URHB river. For this, the automated master recession curve separation tool of Posavec et al. (2010) was applied. For the calibrated RORA* model, a value of K of 13 days was calculated from the lysimeter data instead. As recommended by Rutledge and Daniel (1994) daily data from September to April in 2000-2002 were used for the calculation of K, when the effect of evapotranspiration on streamflow recession rates is likely to be small. Because of the simplifying assumptions inherent in the RORA model it is generally recommended to apply the program at time scales not shorter than one month (RUTLEDGE, 2002).
Water table fluctuation method (WTF)
The groundwater-table fluctuation method (WTF) is a widely established procedure for the estimation of GR in unconfined aquifers (HEALY and COOK, 2002). It presumes a linear correlation between groundwater-table rise (∆h) and GR with the coefficient σy (specific yield):
GR=∆h·σy (1)
The absolute value of ∆h was approximated by fitting an exponential function to the receding limbs of the site-specific groundwater table time series (HEPPNER et al., 2007). With an automated fitting procedure in the “MRCR” computer program of Heppner and Nimmo (2005) GR was then estimated from daily groundwater table depths accordingly. An initial value of 0.075 was used for σy, which is the average of pumping-test results in a neighboring catchment with a similar geology (BALDERER, 1984). A calibration of σy for the first two years of the observation period was carried out. However, model performance did not improve considerably and therefore, σy was calibrated through fitting cumulative GR to lysimeter seepage over the entire observation period (WTF*). This resulted in a value of 0.0601 that still lies well within the range of the field-based observations. It also has to be noted that the location of the groundwater observation well at a gentle hillslope might bias the GR estimation due to lateral drainage. Nevertheless, this effect is assumed to be small because of a significantly larger vertical hydraulic gradient compared to the lateral hydraulic gradient at the site.
Simplistic soil water balance model (SWB)
Estimation of daily GR with a frequently applied simplistic soil-water balance model (SWB, e.g. BASU et al., 2010; RODRIGUEZ-ITURBE et al., 1999; VON FREYBERG et al., 2015) is
based on the following equation for the unsaturated zone:
∆S = P – AET - GR (2)
It is assumed that the water budget of an isotropic and homogeneous soil column is solely governed by the change in soil water storage (∆S) in an uppermost “active” soil layer, which generally corresponds to the average depth of the plant roots. GR occurs when infiltrating rainfall (P) overcomes the soil moisture deficit in this zone, i.e., when the soil