Design, Data Mining and Analysis of Hyperactive
Environments
by
Michael M. Kashambuzi
B.S. Civil Engineering
Massachusetts Institute of Technology, 1997
Submitted to the Department of Mechanical Engineering
in Partial Fulfillment of the Requirements for the Degree of
Master of Science in Mechanical Engineerin2
at the
Massachusetts Institute of Technology
June, 1999
©
1999, Massachusetts Institute of Technology. All Rights Reserved.
Signature of Author ...
Michael M. Kashambuzi
May 24, 1999
Certified by ...
Nishikant Sonwalkar
Director, Hypermedia Teaching Facility
Thesis Supervisor
Accepted by ...
Ain Sonin
Chairman, Graduate Committee
Design, Data Mining, and Analysis of Hyperactive Environments
by
Michael Kashambuzi
Submitted to the Department of Mechanical Engineering
on May 24, 1999, in Partial Fulfillment of the
Requirements for the Degree of
Master of Science in Mechanical Engineering
ABSTRACT
As the Internet and the World Wide Web continue to grow, new and emerging capabilities have made it possible to design and utilize concepts that were never before imaginable in such an environment. With these new capabilities, the use of the World Wide Web has become applicable in several fields including education.
In this thesis, we present a framework for designing and analyzing web-based, hyperactive learning environments. The proposed present preliminary requirements to assess the utility of hyperactive environments for the particular application, design techniques for the creation of these hyperactive environments using the latest web technologies, and analytical tests and evaluations for scrutinizing the adequacy and performance of such environments in a learning setting.
The model developed was then used in the design, development, and testing of several hyperactive environments. The conclusions of our studies indicate that:
1. Student performance is the same through the use of a web-based environment as it is
through the use of an actual lab environment.
2. Students'performance is independent of past exposure to the material of a simulation, year in school, or preference for a lab environment.
3. A majority of students prefer the use of the hyperactive environment on the grounds
of flexibility, ease of use, and ease of operation.
4. Students strongly agree that the hyperactive environment is suitable for achieving its predefined learning objectives.
5. Students strongly agree that the hyperactive environment performs well at the interfacial level making it easy to navigate between the instructions and experiment and facilitating the collection of data.
Thesis Supervisor: Nishikant Sonwalkar Title: Director, Hypermedia Teaching Facility
Acknowledgements
I would like to thank my advisor, Dr. Nishikant Sonwalkar, for providing me with an atmosphere
in which I could pursue and achieve my goals and his valuable contributions during the stages of
this thesis. Additional thanks go to Dr. Nishikant Sonwalkar, Professor Richard Larson and the
Sloan Foundation for their generosity in sponsoring me. Many thanks go to the Hypermedia
Teaching Facility staff and students for their daily support.
Above all, this thesis is dedicated to my family which has always encouraged me to do all I can to
the best of my abilities, supported me in all the decisions I have made, and sacrificed all else to
Table of Contents
Acknowledgem ents...3 Table of Contents ... 4 List of Tables ... 9 List of Figures...12 Chapter 1 Introduction...13Chapter 2 W eb-Based Technologies... 18
2.1 Introduction...18
2.2 Hypertext M arkup Language (HTM L)... 18
2 .3 S c rip tin g ... 19
2.3.1 Comm on Gateway Interface (CGI) Scripting ... 20
2.3.2 JavaScript...21 2.3.2.1 Client-side JavaScript... 21 2.3.2.2 Server-side JavaScript ... 22 2.4 W eb Applications...24 2 .4 .1 Ja v a ... 2 4 2.5 Plug-In Technologies ... 25 2.6 Choice of Technology... 26 2.7 Application of W eb Technologies ... 26
2.7.1 Carnot Cycle Sim ulation... 26
2.7.1.1 Objective...26
2.7.1.2 Technology ... 29
2.7.2 Yield M anagement Simulation ... 29
2.7.2.2 Technology ... 30
2.7.3 Rotam eter Experiment ... 31
2.7.3.1 Objective...31
2.7.3.2 Technology ... 31
Chapter 3 Data Variables, Collection and Storage Mechanisms... 33
3.1 Introduction...33
3.2 D ata V ariables...33
3.2.1 Characterization of the End User... 34
3.2.2 Performance Measures of the Hyperactive Teaching Tool... 34
3.2.3 The Relationship between Student Performance, Usage and Evaluation of the H yperactive Teaching Tool ... 35
3.3 D ata Storage...36 3.3.1 D atabase...36 3.3.2 D ata M odel ... 36 3.3.2.1 Entity-Relationship M odel ... 37 3.3.2.2 M odel Application... 38 3.4 D ata Collection ... 41 3.4.1 Collection M echanism ... 41 3.4.2 Storage M echanism ... 41 3.4.3 D ata Cleaning ... 41 3.4.4 D ata Coding ... 42
3.4.5 D ata Enrichm ent ... 43
3.5 Integration of D ata Collection and Storage M echanism s ... 43
Chapter 4 Statistical Analyses and Data M ining... 44
4 .2 .1.1 P u rp o se ... 4 5
4.2.1.2 Interpretation of Results ... 46
4.2.2 Chi-Squared (X2) Test ... 46
4.2.2.1 Purpose ... 46
4.2.2.2 Interpretation of Results ... 46
4.2.3 Choice of Statistical Test to Perform ... 47
4 .3 D ata M in in g ... 4 8 4.3.1 Association Rules ... 48 4 .3 .1.1 P urp o se ... 4 8 4.3.1.2 Interpretation of Results ... 48 4.3.2 Decision Trees ... 49 4 .3 .2 .1 P urp o se ... 4 9 4.3.2.2 Interpretation of Results ... 49
Chapter 5 Application of Statistical Tests and Data Mining to Hyperactive Environments 50 5 .1 In tro d uctio n ... 50
5.2 General Statistics ... 51
5.2.1 Characterization of the End User... 51
5.2.2 Performance M easures of the Hypermedia Teaching Tool ... 53
5.2.2.1 Satisfaction of the Learning Objectives... 54
5.2.2.2 Performance of the Human-M achine Interface ... 58
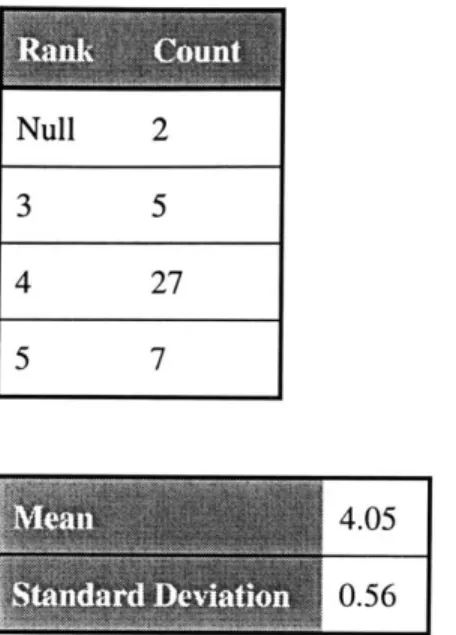
5.2.2.3 Overall Ranking of the Tool... 60
5.3 M ann W hitney Tests ... 62
5.3.1 Test for Independence of Hypermedia Environment Ranking with Student Prior Exposure to Calibration as the Population... 62
5.3.2 Test for the Independence of Hypermedia Environment Ranking with Student Year as the Population...63
5.3.3 Test for the Independence of Hypermedia Environment Ranking with Student Preference of Lab Environment as the Population ... 64
5.3.4 Test for the Independence of Student Performance with Student Prior Exposure to
Calibration as the Population... 65
5.3.5 Test for Independence of Student Performance with Student Year as the Population66 5.3.6 Test for Independence of Student performance with Student Preference of Lab Environment as the Population... 67
5.4 Chi-Squared (X2) Tests... 69
5.4.1 Test for Student Experience with Calibration Regarding Ranking of the Hyperactive Environment ... 69
5.4.2 Test for Student Year in School with Calibration Regarding Ranking of the Hyperactive Environment ... 70
5.4.3 Test for Student Preference for Environment Regarding Ranking of the Hyperactive E n v iro n m en t ... 7 2 5.4.4 Test for Student Experience with Calibration Regarding Student Performance...73
5.4.5 Test for Student Year in School Regarding Student Performance... 75
5.4.6 Test for Student Preference for Environment Regarding Student Performance...76
5.5 Association Rules...78
5.6 Decision Trees ... 82
5.6.1 Determination of How W ell the End Users Perform ... 82
5.6.2 Determination of How W ell the Environment is Ranked ... 85
Chapter 6 Conclusions and Further W ork ... 88
Appendix A ... 90
A. 1 Carnot Cycle Simulation... 90
A.2 Airline Yield M anagement Simulation ... 91
A.3 Chemical Engineering Rotameter Experiment... 92
Appendix B ... 93
B. 1 M ann-W hitney Test...93
B.2.1 Variable Requirem ents... 94
B.2.2 Calculation of X2 ... . . . .. . . .. . . .. . . .. . . .. . . .. .. . . 95
B.3 A ssociation Rules ... 96
B.3. 1 Description... 96
B.3.2 Determ ination of Desired A ssociation Rules... 96
B.3.3 D ata Structure and Algorithm ... 97
B.4 D ecision Trees...98
B.4.1 D escription... 98
B.4.2 D ata Structure and Algorithm ... 100
References ... 103
List of Tables
T able 3-1 Student A ttributes ... 38
Table 3-2 Student Perform ance Attributes... 38
Table 3-3 Content of the Evaluation Survey... 39
Table 3-4 Entity Representations using Primary Key ... 40
Table 3-5 Entity Representations using a Foreign Key... 40
Table 5-1 Responses in Favor of the Use of the Hyperactive Lab...53
Table 5-2 Count and Measure Of Responses to Agreement Concerning Objectives...55
Table 5-3 Count and Measure of Responses to Agreement Concerning Procedures...55
Table 5-4 Count and Measure of Responses to Agreement Concerning Schematic Drawing...56
Table 5-5 Count and Measure of Responses to Agreement Concerning the Plotting of the C alib ration C urve ... 56
Table 5-6 Count and Measure of Responses to Interpretation of the Calibration Curve ... 57
Table 5-7 Count and Measure of Responses to Identification of Systematic Error ... 57
Table 5-8 Count and Measure of Responses to Identification of Random Error ... 57
Table 5-9 Count and M easure of Clarity of Instructions... 59
Table 5-10 Count and Measure of Navigation between Experiment and Instructions...59
Table 5-11 Count and Measure of Ease of Use of Interface ... 60
Table 5-12 Count and Measure of Ease of Data Collection... 60
Table 5-13 Count and Measure of Overall Rank of Hyperactive Teaching Tool ... 62
Table 5-14 Results of a Mann Whitney Test for Independence of Hypermedia Environment Ranking with Student Prior Exposure to Calibration as the Population...63
Table 5-15 Results of a Mann Whitney Test for Independence of Hypermedia Environment
Ranking with Student Year as the Population ... 64
Table 5-16 Results of a Mann Whitney Test for Independence of Hypermedia Environment
Ranking with Student Preference of Lab Environment as the Population ... 65
Table 5-17 Results of a Mann Whitney Test for Independence of Student Performance with
Student Prior Exposure to Calibration as the Population ... 66
Table 5-18 Results of a Mann Whitney Test for Independence of Student Performance with
Student Y ear as the Population... 67
Table 5-19 Results of a Mann Whitney Test for Independence of Hypermedia Environment
Ranking with Student Preference of Lab Environment as the Population ... 68
Table 5-20 Chi Squared (x2
) Test for Student Experience with Calibration Regarding Ranking of
the H yperactive Environm ent... 70
Table 5-21 Chi Squared (x2
) Test for Student Year in School with Calibration Regarding Ranking
of the H yperactive Environm ent... 71
Table 5-22 Chi Squared (x2
) Test for Student Preference for Environment Regarding Ranking of
the H yperactive Environm ent... 73
Table 5-23 Chi Squared (x2
) Test for Student Experience with Calibration Regarding Student
P erfo rm an ce ... 74
Table 5-24 Chi Squared (X2
) Test for Student Year in School with Calibration Regarding Student
P erform ance ... 76
Table 5-25 Chi Squared (X2) Test for Student Preference for Environment Regarding Student
P erform ance ... 7 8
Table 5-26 Association Rules Relevant to Student Year, Student Experience with Rotameter
Calibration, Student Preference for a Laboratory Environment, Student ranking of the
Table A.1-1 Files Used by the Carnot Cycle Simulation... 90
Table A.2-2 Files used by the Airline Yield Management Simulation ... 91
Table A.3-3 Files used by the Chemical Engineering Rotameter Experiment...92
Table B. 1-1 Steps used in calculating the U-value for a Mann-Whitney Test...94
Table B.2-2 Steps used in calculating the X2 value for the Mann-Whitney Test ... 96
List of Figures
Figure 1-1 Design Methodology for Hyperactive Environments... 15
Figure 2-1 Client- and Server-Side JavaScript... 23
Figure 2-2 Carnot Cycle as Seen in Conventional Media...28
Figure 2-3 Screen Shot of the Carnot Cycle Simulation...28
Figure 2-5 Screenshot of the Chemical Engineering Rotameter Experiment ... 32
Figure 3-1 Entity-Relationship Model for Hyperactive Environment Evaluations...39
Figure 3-2 Entity-Relationship M odel ... 40
Figure 3-3 Integration of Data Collection and Storage Mechanisms ... 43
Figure 5-2 Histogram of Ranking of the Hyperactive Environment with Gaussian Distribution S up erim p o sed ... 6 1 Figure 5-3 Decision Tree for Determination of Student Performance with Student Year, Preference for Lab Environment, Experience with Rotameter Calibration, and Supposed E ase of U se as C ategories... 84
Figure 5-4 Decision Tree for Determination of Hyperactive Environment Rank with Student Year, Preference for Lab Environment, Experience with Rotameter Calibration, and Supposed Ease of U se as Categories ... 87
Figure A. 1-1 Interactions between Files in the Carnot Cycle Simulation...90
Figure A. 3-2 Interactions between Files in the Chemical Engineering Rotameter Experiment ...92
Figure B.3-1 Data Structure Used in Determining Association Rules...98
Figure B.4-1 Data Structure Used in Building Trees ... 101
Chapter 1
Introduction
As the Internet and the World Wide Web continue to grow, new and emerging capabilities have
made it possible to design and utilize concepts that were never before imaginable in such an
environment. With these new capabilities, the use of the World Wide Web has become
applicable in numerous fields including education.
In this thesis, we present a framework for designing and analyzing web-based, hyperactive
learning environments. We present preliminary requirements to assess the utility of hyperactive
environments for the particular application, design techniques for the creation of these
hyperactive environments, and analytical tests and evaluations for scrutinizing the adequacy and
performance of such environments in a learning setting.
Designers of web simulations tend not to perform an analysis to determine the utility of their
work in such learning environments. In order to benefit fully and to understand the efficacy of
the World Wide Web in an educational setting, such an analysis needs to be carried out on several
levels. First, it is important to understand if the Web environment and its associated capabilities
are applicable for the particular learning application. By defining the learning objectives of the
application, we step closer to identifying which capabilities are useful for our intended learning
determination, the appropriate tools are then used to design the application. After this stage, the
ever-crucial stage of evaluation is carried out to assess the adherence of the hyperactive
environment to the initial learning objectives. The simulation is then deployed for use by its
expected audience. During this stage, data is collected regarding performance of the hyperactive
environment as well as characteristics related to its end users. This data is then analyzed to assess
the ability of the hyperactive environment to fulfill its intended learning goal(s). As should be
expected, the above methodology is recursive in nature in that each stage must be revised if it
fails to meet the desired objectives.
Figure 1-1 Design Methodology for Hyperactive Environments
As shown in Figure 1-1, the process of developing a hyperactive environment starts with the
identification of the learning objectives. Knowledge of the objectives this early in development is
critical for subsequent stages. If the objectives cannot be made through the use of a web-based
environment, the choice is made to cease development. The second step involves the
identification of the available technologies that may be suitable for development purposes. If no
completion of the design, testing is carried out to assess the ability of the environment to perform
on a functional level. If the environment fails to meet the requirements at this stage, a
re-evaluation of the chosen technologies and design methods used is carried out. If adjustments to
the technologies and design methodologies can be made, they are carried out. Otherwise, an
unsatisfactory environment leads to the cessation of development. If the fifth stage, the
deployment stage, is reached, the hyperactive environment has satisfied the requirements at a
purely functional level. Once deployed to end users, data is collected to perform a more detailed
analysis of the hyperactive environments. The analysis of this detailed data marks the end of the
methodology for the design of hyperactive environments. However, results from the analysis
should be used for future development.
The directional arrows represent the sequence of steps between the identification of needs and the
analysis of the hyperactive environment. Upward-pointing arrows represent a revision of the step
at which the arrow points; forward-pointing arrows represent a completion of the step at their tail.
Arrows that point horizontally represent a decision to end the design. The lowest box in the
diagram represents a successful completion of the design of a hyperactive environment.
The remainder of this thesis is organized as follows. Chapter 2 provides an overview of
programming standards and techniques available for use on the World Wide Web. These
techniques will be described and cases of their use will be provided. Chapter 3 describes the data
that will be used in the analysis of the hyperactive environments along with the methods of
collection and storage. Chapter 4 concerns the statistical analyses and data mining techniques
that will be used on the data collected for analysis of the hyperactive environment. Chapter 5
employs a case study to highlight the proposed methodology with an example of a hyperactive
The conclusions of our studies indicate that:
1. The hyperactive environment is well rated by its end users
2. The ranking of the hyperactive environment is independent of student year, student
experience, and student preference for lab environment implying that end user experience
does not affect the ranking of the hyperactive environments.
3. The end users' performances through the use of the hyperactive environments are
comparable to those using actual lab environments.
4. The end users' performances are independent of student year, student experience, and
student preference for lab environment implying that all end users are capable of using
Chapter 2
Web-Based Technologies
2.1 Introduction
The number of technologies available for use on the World Wide Web has grown substantially
since its beginning in 1994-1995. Some of the technologies most commonly available include
HTML, JavaScript, Java and plug-ins. Several of these technologies can be applied to hypermedia
teaching environments. In order to properly choose which technology suits an application, it is
important to understand the capabilities of the technology. With such knowledge in mind, it is
easier to determine which technology is most suitable. This chapter describes some web
technologies used in the design of hyperactive environments followed by three educational
implementations.
2.2 Hypertext Markup Language (HTML)
The Hypertext Markup Language (HTML) is probably the most apparent technology associated
with the World Wide Web. "HTML is a document-layout and hyperlink-specification language.
It defines the syntax and placement of special, embedded directions that aren't displayed by the
browser, but tell it how to display the contents of the document, including text, images, and other
HTML is the framework upon which other web document constituents sit. It serves as the
container in which other components and languages subsist. Using HTML, one can construct an
environment that delivers information-rich content to viewers on the web more so than through
the use of conventional means of information propagation. HTML provides the content and
structure while the World Wide Web serves as the mechanism for delivery.
At its beginning, "HTML was designed to structure documents and make their content more
accessible, not to format documents for display purposes" [1]. However, over time, HTML has
become a medium for formatting documents through the inclusion of better tags for textual,
image, tabular and other elemental manipulations.
The latest version HTML is more commonly referred to as Dynamic HTML (DHTML). DHTML
provides the user with an environment that permits better textual formatting, better positioning of
content, dynamic page building and much improved interactive content.
2.3
Scripting
In order to perform server and web application programming, scripting is used. Scripting
languages are those languages that provide programmers with the behaviors and associated
objects needed to run applications on the web. Two different methods of scripting exist. These
are:
1. Server-side scripting. In this form, programs run on the machine that is serving the
advantage is its ability to create dynamic content for the client with relative ease and
speed as compared with server-side scripting.
It is through scripting that any kind of program is able to run on the web.
2.3.1 Common Gateway Interface (CGI) Scripting
"CGI is the part of the Web server that can communicate with other programs running on the
server" [2]. The Common Gateway Interface is the layer that gives the web the ability to transfer
information from web clients to programs on the server and then relay the results back to the
users. In doing so, "CGI turns the web from a simple collection of static hypermedia documents
into a whole new interactive medium" [2].
CGI scripting allows applications to be run which take advantage of
* Forms. Forms are used to collect information from users and respond appropriately.
* Gateways. Gateways provide a mechanism for communication between a web server
and some other application that cannot be accessed directly from the Web.
* Dynamic documents. Dynamic documents are that which are built on the fly and
contain information that is relative to a particular user session or request.
CGI scripting can be done in practically any programming language. Those most popularly used
are Perl, C, C++, Shell, Tcl, Visual Basic and AppleScript. The choice of which language to use
depends on several factors. However, according to Gundavaram, some considerations to make
when choosing a language include
e Ease of text manipulation
0 Ability to access environment variables (in UNIX)
2.3.2
JavaScript
JavaScript is a technology developed by Netscape Communications CorporationTM but
implemented by most popular browsers. "JavaScript is a lightweight interpreted programming
language with rudimentary object-oriented capabilities" [3]. JavaScript gives programmers the
ability to create programs with the intention of running them on the web. Two forms of
JavaScript exist: client-side JavaScript and server-side JavaScript. Although both of these are
built on the same core language corresponding to ECMA-262, client- and server-side JavaScript
employ it differently. These differences in employment are highlighted below.
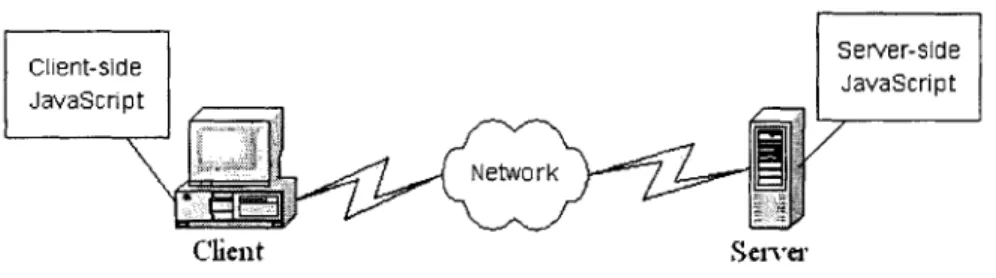
2.3.2.1 Client-side JavaScript
Client-side JavaScript has associated with it functionalities that are meant for use from within a
web browser. Typically, client-side JavaScript is found embedded in an HTML page and is
interpreted at runtime (i.e. as the page is loading).
Client-side JavaScript is useful for several reasons but on three major levels which are the
1. Programmer level,
2. Document level, and
3. End users level.
Client-side JavaScript gives the programmer control over the appearance of the content in a
allows interaction between the content in a document. The different components can interact
with each other for different intended purposes. As a simple example of component interactivity,
clicking a button can manipulate an image. Interaction between the user and the browser is easily
facilitated using JavaScript. Users can control components and, likewise, the browser can keep
track of user actions through the use of cookies.
2.3.2.2 Server-side JavaScript
Server-side JavaScript has associated with it functionalities that are meant for use on a web
server. Server-side JavaScript is also found embedded in an HTML page but is compiled into an
executable file before deployment.
Server-side JavaScript allows web scripts to perform actions found in client-side JavaScript as
well as other actions that are not. The four main standouts of server-side JavaScript are
1. the ability to maintain state,
2. the ability to access files,
3. the ability to access databases, and
4.' the ability to access code written in another language
A major advantage of server-side JavaScript is its ability to maintain a particular state. The state
refers to the status of the
1. Server (what request have been made, which applications are in use, which
applications are sharing information, etc.),
2. Application (how many users are connected, what other applications have requested
3. Client (what actions has the client taken, what are the client's characteristics, etc.), and
4. Request (what most recent information has the client requested)
Server-side JavaScript allows for interaction with files on the server. This allows information to
be retrieved from or stored in files for later use.
Server-side JavaScript integrates the server with databases. The use of databases allows large
repositories of information to be stored and retrieved. Server-side JavaScript makes it simple to
perform such actions on a database while overstepping the difficulty of having to write low-level
programs.
In the case where one needs access to functions written in another language, one can employ
server-side JavaScript to fulfill this requirement. By compiling the functions as libraries and
installing them on the web server, native functions can be accessed through server-side
JavaScript.
Client Server
2.4 Web Applications
At times, scripting is unsuitable for developing complex applications. For these cases, Java is a
powerful alternative.
2.4.1 Java
Java, an object-oriented programming language developed by Sun Microsystems, is best known
for its use on the World Wide Web and its platform independence. However, Java is much more
than that. "Java is a language for creating safe, portable, robust, object-oriented, multithreaded,
interactive programs" [4].
According to Naughton[4], Java is notable for many characteristics. Some attributes of Java are
that it is
1. Simple and powerful. Using Java, one can easily write a complex program "without
having to expose of all the dangerous inner workings of the underlying system" [4].
2. Safe. Since the use of Java is apparent on the Internet, Java developers strongly integrated
the issue of security into the language making it difficult to access system resources,
spread viruses, etc.
3. Object oriented. Java employs the object model.
4. Robust. Java is considered robust because it debugs code as you write it and run it,
manages memory well, and provides a mechanism for handling exceptions.
5. Interactive. Java makes it easy to build interactivity between the program and the end user
6. Architecture neutral. Because they run on the Java virtual machine and are not dependent
on the operating system, Java is a portable programming language that is independent of
the machine architecture.
7. Interpreted and high performance. Through the use of bytecode, Java programs can be
both interpreted programs for speed or, for high performance situations, can be optimized
using the Java runtime engine to create native machine code.
8. Easy to learn. Because of its widespread use, Java has been made so that it is easier to
learn compared to other programming languages.
Java programs can exist as standalone programs or as applets. Standalone programs run at the
operating system level in their own window whereas applets run in a container within a web
browser.
2.5
Plug-In Technologies
Several companies began developing applications that run from the web document container.
These programs which allow users to run programs that are not supported by a browser are called
plug-ins.
Plug-ins give capabilities to the web browser that would not otherwise be possible. Some
examples of multimedia plug-ins are QuicktimeTM for viewing movie clips and LivePictureTM and
CosmoPlayerTM
for viewing 3-D worlds.
Plug-ins, in some cases, also provide application programming interfaces (APIs) that allow the
2.6 Choice of Technology
Here are a few tips on deciding which technology is best for use.
1. For basic formatting of text and images, use HTML.
2. For more customized formatting including positioning of content, font sizing, and
layering, use dynamic HTML (DHTML).
3. For quick and easy scripts that require user interaction and dynamic text (formatting and positioning) and do not carry security or privacy concerns, use client-side
JavaScript. For scripts that contain file and database access as well as access to
functions written in other native languages and scripts that require maintenance of
state, use server-side JavaScript.
4. For programs that require network programming, complicated layouts and
formatting, complex computation, and definition of objects not provided in any of the
other scripting languages, use Java.
2.7 Application of Web Technologies
Given the above technologies available for the design of hyperactive environments, the following
three applications were developed.
2.7.1 Carnot Cycle Simulation
2.7.1.1 Objective
The objective of this simulation is to provide a visual environment for understanding the concept
of the Carnot cycle [12].
The Carnot cycle describes the reversibility and transfer of heat between two reservoirs at
reversible changes. Two of these changes are isothermal meaning the process involves constant
temperature; the other two are adiabatic meaning no heat is transferred into our out of the system
during the process. The position of the piston in the cylinder is associated to the Carnot cycle
with the pressure-volume (P-V) and temperature entropy (T-S) diagrams of the ideal gas
contained in the cylinder.
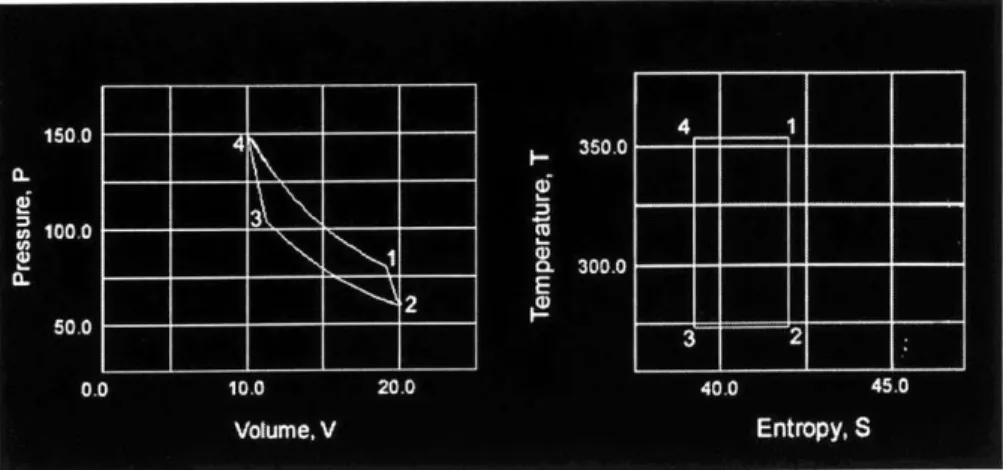
Most textbooks will present the Carnot cycle using a diagram relating piston position to the
aforementioned diagrams using a numerical code representing the point in the cycle as in Figure
2-2. A description of the Carnot cycle using these diagrams would be described in the following
four steps:
1. The gas expands adiabatically along the path 1-2 where, at point 2, the gas reaches
the temperature of the cold temperature, Tc.
2. The gas is compressed isothermally at Tc and rejects an amount of heat
Qc
along the path from 2-3.3. The gas is compressed adiabatically along the path from 3-4 until it reaches the temperature of the high temperature reservoir, TI.
4. The gas expands isothermally along the path from 4-1, thereby absorbing an amount
of heat, Qh.
The simulation developed accomplishes the same task; however, it displays the graphs in
real-time while showing a description of each stage of the cycle above the graphs being plotted
(Figure 2-3).
m.MIN
Figure 2-2 Carnot Cycle as Seen in Conventional Media
2.7.1.2 Technology
The Carnot cycle simulation (Figure 2-3) takes advantage of all the above mentioned
technologies. HTML is used to create the interface. JavaScript is used on the client-side to get
parametric input from the user. A plug-in (CosmoPlayerTM) is used to display the motion of the
piston in the cylinder as a 3-D animation. Java is used to display the P-V and T-S diagrams as
well as interact with the plug-in to control the motion of the piston-cylinder apparatus.
Using LiveConnectTM, the parameters entered by the user in the HTML page are sent to the Java
applet. The Java applet, through the use of class APIs provided by CosmoPlayer, receives
information about the position of the piston in the cylinder and calculates the values shown in the
P-V and T-S diagrams. For more detailed information on the implementation, see Appendix A. 1.
2.7.2
Yield Management Simulation
2.7.2.1 Objective
The objective of the yield management simulation is to provide students with the ability to make
decisions concerning booking practices to yield the most profit in the airline industry.
Heuristics, which employ complex mathematical expressions, probability distributions, and
calculations, are commonly used to simulate yield management in the airline industry. An
application to actively display the reservation of airline avoiding the use of the above complex
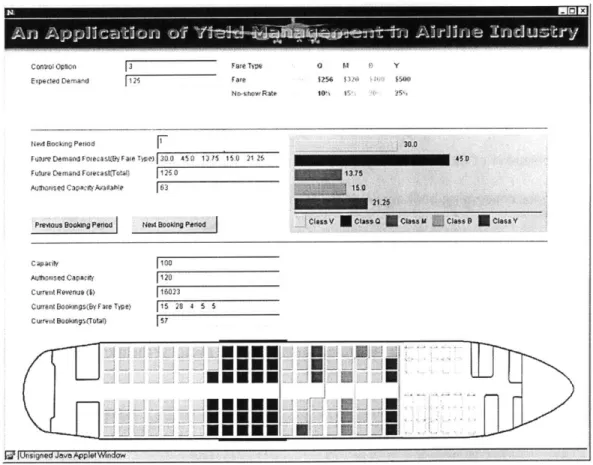
2.7.2.2 Technology
The yield management simulation (Figure 2-4) relies on the use of HTML and Java. The HTML
serves to provide end users with instruction on yield management and the operation of the
application; Java is used to program the booking process heuristics and display the reservation of
the seats as request come in.
Java was chosen due to the complex nature of the heuristics and the intensive graphical display of
information. The layout also contributed to the choice of Java as the suitable programming
language for the application. For more detailed information on the implementation, see Appendix
A.2. M-REx Conuo Option Experteo Demand Fare Tyre 0 M t6 Y Fare W256 $ 50 No-show Rate 10r I5 S,
14e4 Boking Period
FutureDemandreast(Farew1e) 30. 450 1315 15.0 21 25 450
Future Demand Foretagt(Tottl) i1 0 35
AUtlhrtl$ed CapaIty /wadabe t 15
Prevous Boolng Penod Ne Booking Penod class 3 Class Y
Capacity
Authorised Capacity Current Revenue (M) Current Bookngs(y Fare Tiye)
Current Bookings(Tutal)
MEM.
UNN.
100 1120 16023 115 28 4 5 5 57L
..
I
ii.
_jf
i Unsigned JavaApplet W dow
2.7.3 Rotameter Experiment
2.7.3.1 Objective
A common problem faced in chemical engineering research as well as in industrial process plants
is calibration of flow meters. It is a classic problem in which one assesses the accuracy of results
and precision of equipment involved in an experiment by using an independent set of standards.
The objective of the rotameter experiment is to calibrate a rotameter, analyze the data, plot the
results, and write a brief technical report. The environment for doing this is provided through the
Web.
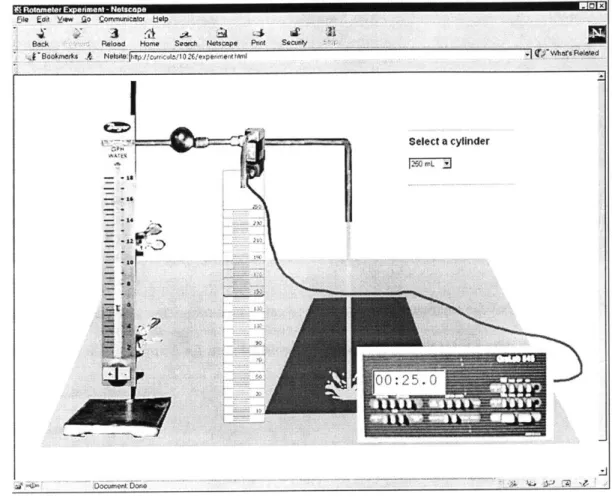
2.7.3.2 Technology
Although it is rather complex, the rotameter experiment (Figure 2-5) relies only upon the use of
HTML and JavaScript. HTML is used to provide instruction and the container for the
experiment. DHTML is used for both static and dynamic positioning of content. Client-side
JavaScript is used to control the interaction between elements of the experiment and user input.
Commurncaw Lteip
Reload Home Search Neticap
OoumntDn
Figure 2-5 Screenshot of the Chemical Engineering Rotameter Experiment
Efe ditYw
~
JBoakmews~ k Pnnt SQCUmly If'-~~~~
~ ~
~
xlmtrEpeieiNtsaeRI3
U
at d , *i-P 5R . -,eChapter 3
Data Variables, Collection and Storage Mechanisms
3.1 Introduction
In order to evaluate hyperactive environments and their utility in web-based learning, it is
important to first determine which variables are required to understand the problem. In
hypermedia teaching environments, the most important variables are those that relate to the end
users of the technology and the attributes of the technology that are critical for evaluating its
performance. Additionally, the method by which this data is collected and stored is critical for
performing evaluative tests. For this purpose, we turn to the first critical steps in data mining
which relate to the manner by which data is collected and stored for further analysis.
3.2 Data Variables
To fully evaluate the performance of hyperactive teaching tools, measurement needs to be made
on three scales:
1. Characterization of the end users
2. Performance measures of the hyperactive tool and
3. The relationship between student performance, student usage of the hyperactive tool and
3.2.1 Characterization of the End User
Knowledge of certain characteristics about the end users helps in the validation of results
achieved from analytical and evaluative tests used to assess the strengths and weaknesses of
hyperactive teaching tools. End user data that is collected allows for the determination of
populations that make use of the designed hyperactive learning environments. For our purposes,
population can be characterized on the following three scales:
1. The student's year. It can be argued that the year of a student (e.g. freshman,
sophomore, etc.) may have an overall effect on his/her performance. By tracking this
variable, a determination can be made as to how critical the student's year is with regard
to the student's performance on various levels.
2. The student's course. The experience of the student sometimes plays a role in the
determination of a student's performance. For students who are familiar with the material
presented in a course module, it might be expected that they should perform better than
students without any prior exposure to the course material should.
3. The prerequisites satisfied by the student. To further distinguish between performance levels on the basis of experience on the part of the student, information as to whether or
not certain prerequisites have been satisfied by the student is gathered.
3.2.2 Performance Measures of the Hyperactive Teaching Tool
Simulation data seeks to evaluate the hyperactive simulation on the following three scales:
1. The performance of the simulation. Performance of the hyperactive simulation is
i. Technical merit. Evaluation of technical performance seeks to address how well
the hyperactive environment represents the actual simulation, mainly in terms of
its operation.
ii. Presentation. Presentation relates to how well information regarding the
hyperactive simulation is relayed to the end user. Issues of concern include:
* visual similarity between the actual simulation and the hyperactive
simulation
* navigability between entities of the simulation
2. The satisfaction of the learning objectives on the part of the simulation. Each
simulation is designed with certain learning objectives in mind. Another means of
evaluating a hyperactive simulation is to assess how well it actually meets these learning
objectives.
3. Performance of the man-machine interface. A major part of the design of hyperactive
teaching tools is in the creation of a user-friendly interface. Without such, the teaching
tools are as good as defeated. Evaluation seeks to determine how well the interface of the
simulation performs.
3.2.3 The Relationship between Student Performance, Usage and
Evaluation of the Hyperactive Teaching Tool
It is not merely enough to characterize the end users and evaluate the performance of hyperactive
simulations in isolation. Since end users are those who evaluate the tools, it is critical to
a particular experiment in an actual lab setting have no prior knowledge of its look and/or its
functionality. In such a case, particular attention needs to be paid to their evaluation of these
aspects of the tools. We will, therefore, attempt to establish the relationship between
performance variables and simulation characteristics through the use of statistical methods and
data mining techniques described in Chapter 4.
3.3 Data Storage
To understand the concepts behind data storage, it is necessary to define the idea of a database
and that of a data model.
3.3.1 Database
In order to facilitate the collection and storage of data, a database is employed. "A database is a
logically coherent collection of data with some inherent meaning" [5]. A database is made up of
files, records and fields which taken together represent a logical representation of the information
within.
3.3.2 Data Model
To best represent the information to be contained in a database, it is necessary to employ a data
model. A data model is graphical means of representing the information in a database. "The
function of the data model is to clearly convey data and its relationships, attributes,
definitions.. .that govern the data" [6].
Several different data models exist. The choice of which data model to use depends on the
evaluation of hyperactive teaching tools, the most appropriate data model is the relational data
model, sometimes referred to as the entity-relationship model.
3.3.2.1 Entity-Relationship Model
The entity-relationship model is one that defines the relationship between the items in the
database. The entity-relationship model is identified by the following terms:
1. Entities. "An entity is a principal object that is of significant interest to the user" [7].
In order for an object to be identified as an entity, it must adhere to the following
criteria:
e Each entity must be significant.
" Each entity must be generic.
" Each entity must be fundamental.
" Each entity must be unitary.
Entities can either be strong or weak entity types. Weak entity types "are identified
by being related to specific entities from another entity type in combination with
some of their attribute values..., it may not be possible to identify a weak entity
without an owner entity" [5]. The strong entity is that entity without which the weak
entity cannot exist.
2. Attributes. Attributes are characteristics that define entities. "An attribute is a fact or
nondecomposable piece of information about an entity" [7].
3. Relationships. In most cases, a database will contain more than one entity. For these
cases, the relationship serves as the association between the different entities. If
3.3.2.2 Model Application
In light of the entity-relationship model, for application towards hyperactive teaching tools, the
significant entities to be stored in the database are
* the student information,
e the evaluation of the tools, and
e the student performance.
The attributes of each entity are given in the tables below.
Username Primary key which identifies each student individually
Department Department in school (Mechanical Engineering, etc.)
Year Year in school (Freshman, Sophomore, etc.)
Prerequisite(s) Prerequisites for a given class (defined by professor)
Prior Lab Experience Experience with lab work related to hyperactive tool (Yes/No)
Table 3-1 Student Attributes
Username Foreign key which identifies individual student from student
information
Score Numeric and/or Letter grade
Username Foreign key which identities individual student trom student
information
Ranking Questions Rankings on achievement of learning objectives by tool
Freeform Questions Comments on the achievement of learning objectives by tool
Preferences Preference for hyperactive or actual experiment
Overall Ranking Rank of tool on the scale of 1-10
Table 3-3 Content of the Evaluation Survey
The relationships that tie together the entities are described in the statements below.
* Students respond by giving an evaluation of the hypermedia tools
" Students are judged based on their performance
Given the information contained in the entities and their attributes and relationships, Figure 3-1
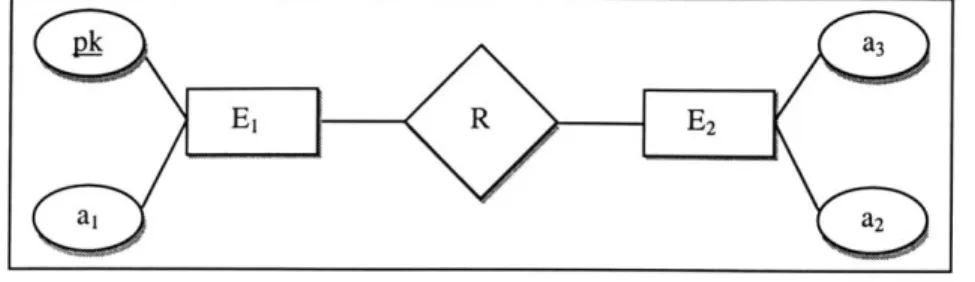
To convert the entity-relationship model to that required in the database, tables are used to
represent the entities and primary and foreign keys are used to both identify and relate the
different entities. Given the following relational model in Figure 3-2,
Figure 3-2 Entity-Relationship Model
the following tables highlights the translation of entity types to the database representation of the
same information.
Table 3-4 Entity Representations using Primary Key
Table 3-5 Entity Representations using a Foreign Key
This model is applicable in our case because the student is the strong entity whereas their
evaluation and performance are the weak entity types.
3.4 Data Collection
Having specified the use of a database as the storage mechanism, the next challenge is the
collection and storage of variables to take advantage of database functionality.
3.4.1 Collection Mechanism
The primary means of data collection is through the use of questionnaires. These questionnaires
are filled out by the end-users of the hyperactive tools and address the same questions highlighted
in §3.3.2.2. The questionnaire is provided to the end-users using a web interface.
3.4.2 Storage Mechanism
To address the issue of the storage mechanism, the issues of data cleaning, coding and enrichment
need to be grasped.
3.4.3 Data Cleaning
Data cleaning is the process of removing pollution from the data. This process "can be executed
in advance while others are invoked only after pollution is detected at the coding or discovery
stage" [8] in order to prevent pollution from ever entering the database.
Data pollution can arise in the following situations:
1. Duplicate records. Duplicate records can arise as the result of outright duplication,
2. Domain inconsistency. Domain inconsistency represents information that is not plausible given the domain, "an expression for the permissible values for the column"
[9].
To prevent data pollution of the above forms in advance, questionnaires are presented in a manner
that provide end-users with all possible responses to many questions. For example, rank-based
questions allow single responses through the use of radio buttons; some other questions restrict
the values of responses by providing pull-down lists.
The only questions that are difficult to filter pollution from are free-form questions. For these
cases, data cleaning is pursued once all data has been stored in the database.
3.4.4 Data Coding
Data coding is the procedure by which data is transformed from its initial state to some other
form. "The way in which we code the information will, to a great extent, determine the type of
patterns we find. Coding, therefore, is a creative activity that has to be performed repeatedly in
order to get the best results" [8].
As Adriaans mentions, the manner in which data is coded can severely affect the informative
patterns that we can extract from it. With this knowledge, it is more befitting to maintain the data
in as complete a state as possible. With the data in its most general form, the analyst can convert
3.4.5
Data Enrichment
In many cases, "new information can easily be joined to the existing client records" [8].
Additional information can be added to records in the database to enrich the value of the data.
For the data collected, enrichment is provided regarding student performance. Additional
information, made available by course instructors regarding student performance, is combined
with existing records in the database.
3.5
Integration of Data Collection and Storage Mechanisms
The integration of data collection and storage involves several different mechanisms. As
previously mentioned, a web interface is used to collect the information from end users.
Information is presented using web-based forms on the client computer. Data cleaning is
accomplished using Server-side JavaScript, a NetscapeTM
technology. Within the Server-side
JavaScript, structured query language (SQL) is used to insert information into a remote database.
The diagram below represents the interconnection between these mechanisms.
S rver-sid
JavaScriptSQ
Client Web Server
Chapter 4
Statistical Analyses and Data Mining
4.1 Introduction
It is not enough to merely design hyperactive teaching tools and to assume their utility in an
educational setting. It is crucial to understand what factors are critical in determining the success
of hyperactive educational tools. A variety of tests can be carried out to aid in making the above
determination. We turn to two areas to assist us in answering this question.
The first category is statistics. Statistical tests are applicable because they help in "providing
evidence for judging the validity of a hypothesis or inference" [10]. For our analyses, we choose
to focus on two statistical tests that are commonly used to test variables or populations for the
possibility of significant differences.
The other category is a relatively new area known as data mining. Data mining, sometimes
referred to as knowledge discovery in databases (KDD), employs an independent series of tests to
provide clues about data that may not be visible through the use of statistical tests or other
analyses. The tests we choose to guide us in our factorial analysis are the generation of
4.2 Statistical Tests
2During the initial stages of knowledge discovery, it is prudent not to make any assumptions about
the distributions in the data. With this in mind, the statistical tests that we choose to perform are
non-parametric tests, characterized as such due to their treatment of distributions in the data.
"...Nonparametric tests make fewer assumptions about distributions" [10].
Nonparametric tests rely on the use of nominal and ordinal data.
Given these constraints, the Mann-Whitney U-Test and the Chi-Squared Test are the
non-parametric tests that will be performed.
4.2.1 Man-Whitney U-Test
4.2.1.1 Purpose
When it is necessary to test for the possibility of significant differences between two samples, a
Mann-Whitney U-test is performed. The Mann-Whitney U-Test seeks to test either of two
hypotheses:
" The null hypothesis which states that there is no significant difference between two populations
* The alternative hypothesis which states that the difference between two populations
The null hypothesis is the goal of carrying out the test. The goal of this particular test is to
determine whether or not the two samples are from the same population.
4.2.1.2 Interpretation of Results
The smaller value of U is then compared against an expected value determined with the
knowledge of nI, n2 and cc (the significance level) and the z-statistic. If the calculated value is
greater than the expected value, it can be said that the groups from which the two samples were
taken are significantly different at the chosen significance level thereby satisfying the alternative
hypothesis.
4.2.2 Chi-Squared
(X2)
Test
4.2.2.1 Purpose
Given sets of sample data from independent populations where each trial permits several
outcomes, it is sometimes necessary to tell whether or not similar frequencies in data can be
obtained in other cases. The x2
test determines whether or not expectations are valid or due to
chance. The x2
test asks the question, "Are obtained and expected frequencies different and, if so,
with what probability?"
4.2.2.2 Interpretation of Results
The x2
value is a direct indication of whether or not observed frequencies are close to those
expected. Larger values of
x
2 indicated greater differences between observed and expectedAn empirical value for x2
is calculated based on
1. the number of rows and columns in the contingency table providing the number of
degrees of freedom [(r-1)(k-1)]and
2. a pre-specified significance level, a=O. 10
The calculated value of X2
is then compared to this empirical value calculated [using the
(r-1)(k-1) degrees of freedom] and, if greater, signifies a significant difference across the two categories
in the sample data at the chosen level of significance.
4.2.3 Choice of Statistical Test to Perform
Two considerations are taken when deciding which statistical test to perform, these being
1. the selection of which variables from your sample are the independent and dependent
variables, and
2. the determination of the class of the variables in your sample. Variables can be
classified as nominal, ordinal or interval.
With knowledge of the above two data, it becomes more manageable to decide which statistical
tests to apply. If necessary, it is possible to convert variable types to those required by a
particular statistical test.
For the current study of technology-enabled learning, with no prior knowledge of the distribution
of data, the nonparametric tests seem to be an appropriate choice for determining the significance
4.3 Data Mining
The area of data mining provides information that is generally unnoticeable in simple analyses
such as the aforementioned statistical tests. Knowledge discovery in databases reveals hidden
patterns and associations between variables. For our study, data mining allows the performance
of a factorial analysis to highlight the associations between the variables collected.
The two applicable data mining methods used are association rules and decision trees.
4.3.1 Association Rules
4.3.1.1 Purpose
Often, one needs to answer the question, "When one thing is observed, is there another thing that
is observed along with the first?" A further refinement may also seek to answer with what
magnitude and assurance such an observation holds. When it is necessary to determine what
factors imply the presence of others, the generation of association rules becomes prevalent.
4.3.1.2 Interpretation of Results
The rule body, rule head, minimum support, and minimum confidence describe generated
association rules and must be taken together. Therefore, any attempt to extract other rules from
4.3.2 Decision Trees
4.3.2.1 Purpose
When one strives to achieve a goal, there are certain factors that one must overcome before one
can reach that end. With regards to hypermedia teaching tools, the end goal is discovering
whether or not the tool is suitable and effective for use in learning environments. The factors that
are used to determine such a resolution include ratings of the tool by end users, performance by
its end users, etc.
4.3.2.2 Interpretation of Results
Given a decision tree, the root node represents the attribute that provides the most information in
determining the goal attribute. The leaves immediately below the root node are the values that
appeared for the attribute in the transactions. The successive nodes and branches represent the
non-goal attributes and their distinct values that have not already appeared in the decision tree.
Lastly, the leaf nodes represent the values of the goal attribute. Overall, a decision tree represents
Chapter
5
Application of Statistical Tests and Data Mining to Hyperactive
Environments
5.1 Introduction
In Chapter 4, we highlighted techniques that would be useful in evaluating the performance of
hypermedia teaching tools. In this chapter, we apply these tests and analyses to the data variables
that were described in Chapter 3 to the Chemical Engineering Rotameter Experiment3.
A common problem faced in chemical engineering research as well as in industrial process plants
is calibration of flow meters. It is a classic problem in which one assesses the accuracy of results
and precision of equipment involved in an experiment by using an independent set of standards.
The objective of the rotameter experiment is to calibrate a rotameter, analyze the data, plot the
results, and write a brief technical report. The environment for doing this is provided through the
Web.
5.2
General Statistics
The following information provides a synopsis of the end user population and response to the
performance and ranking of the hypermedia teaching tool.
10-0 05 0-2 3 4 5 Grades
Figure 5-1 Histogram of Student Grades with Gaussian Distribution
5.2.1 Characterization of the End User
As mentioned earlier in Section 3.2.1, knowledge of certain characteristics as regards the end
users is instrumental towards the validation of results achieved from analytical and evaluative
tests used to assess the strengths and weaknesses of hyperactive teaching environments. For the
Chemical Engineering Rotameter Experiment (herein referred to as the hyperactive environment
The total number of students surveyed was 41 out of a possible 54 of whom 100% were Chemical
Engineering students. 26 of the students were third year undergraduates whereas the other 15
surveyed students were fourth year. Approximately 100% of all students had fulfilled the
prerequisites for the web lab. Contrary to this and, despite the fact that 100% of all participants
had worked in an actual laboratory setting prior to using the web lab, a vast majority (93%) of
students using the web lab had never calibrated a rotameter. The mean score on the lab reports
was a 4.1 out of 5 with a standard deviation of 0.76.
The average student score on the lab report (of those surveyed) was a 4.1 out of a possible 5.0.
The distribution of grades is given in Figure 5-1.
As one can see, the performance of the students does not follow a normal distribution and hence,
non-parametric tests should be used when using their scores as a test variable (described in
Chapter 3).
When asked to make a choice regarding which form of the lab they would prefer (actual or
web-based), half of the students opted for the use of the web environment as a means for gathering
data to write a laboratory report. The following are characteristic responses for choosing to use a
web environment.
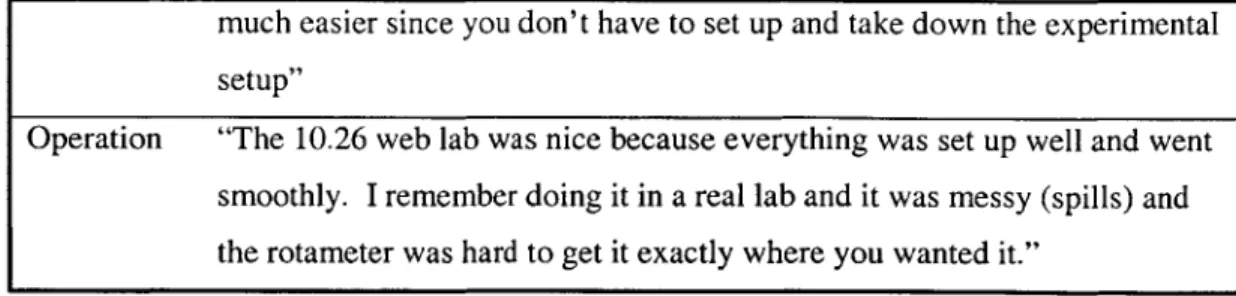
Flexibility "...this can be done on our own time, as opposed to having a TA always being around."
Time "I would rather use the Web lab because it makes gathering the data much
faster."
Ease "It's easier to use the web lab-you learn the same thing anyway." "With such a tedious task as calibrating a rotameter, working on a computer is