HAL Id: insu-01002609
https://hal-insu.archives-ouvertes.fr/insu-01002609
Submitted on 6 Jun 2014HAL is a multi-disciplinary open access archive for the deposit and dissemination of sci-entific research documents, whether they are pub-lished or not. The documents may come from teaching and research institutions in France or abroad, or from public or private research centers.
L’archive ouverte pluridisciplinaire HAL, est destinée au dépôt et à la diffusion de documents scientifiques de niveau recherche, publiés ou non, émanant des établissements d’enseignement et de recherche français ou étrangers, des laboratoires publics ou privés.
Development of the Analysis of Fecal Stanols in the
Oyster Crassostrea gigas and Identification of Fecal
Contamination in Shellfish Harvesting Areas
Loïc Harrault, Emilie Jardé, Laurent Jeanneau, Patrice Petitjean
To cite this version:
Loïc Harrault, Emilie Jardé, Laurent Jeanneau, Patrice Petitjean. Development of the Analysis of Fecal Stanols in the Oyster Crassostrea gigas and Identification of Fecal Contamination in Shellfish Harvesting Areas. Lipids, Springer Verlag, 2014, 49 (6), pp.597-607. �10.1007/s11745-014-3908-5�. �insu-01002609�
1
Lipids:
1
2
Development of the analysis of fecal stanols in the oyster Crassostrea gigas and identification
3
of fecal contamination in shellfish harvesting areas
4
5
Loïc Harrault, Emilie Jardé*, Laurent Jeanneau and Patrice Petitjean
6
7
CNRS, UMR 6118 Geosciences Rennes, Campus de Beaulieu, 35042 Rennes Cedex, France
8
9
Keywords : Stanol analysis; Gas chromatography; Mass spectrometry; Oysters, Fecal
10
contamination, Microbial Source Tracking.
11 12 * corresponding author: 13 Email: emilie.jarde@univ-rennes1.fr 14 Phone: +33 (0)2.23.23.56.20 15 16
2 Abstract
17
The objective of this work was to study the effects of washing and purification steps
18
on qualitative and quantitative analysis of fecal stanols in the oyster Crassostrea gigas using
19
either single or combination of lipid purification steps on silica gel or aminopropyl bonded
20
silica gel (NH2) or a washing step. Among the three analytical pathways compared, the two
21
including water extraction or NH2 purification did not lead to higher recoveries and decreased
22
repeatabilities of extractions compared to the single purification on silica gel. This latter led to
23
similar recoveries (ca. 80%) and repeatabilities (ca. 10%) for both spiked standards
24
(coprostanol and sitostanol). This analytical pathway has been applied to oysters collected in a
25
harvesting area in Brittany (France) where fecal contaminations are important and allowed to
26
quantify eight stanols in oysters. The relative proportions of fecal stanols of these oysters
27
were combined with principal component analysis in order to investigate the usefulness of
28
their stanol fingerprints to record a fecal contamination and to distinguish its source between
29
human, porcine and bovine contaminations. Oysters non-fecally contaminated by Escherichia
30
coli did not present specific stanol fingerprints while oysters fecally contaminated had a
31
bovine fingerprint, suggesting a contamination of these samples by bovine sources. As a
32
consequence, the method developed here allows the use of stanol fingerprints of oysters as a
33
microbial source tracking tool that can be applied to shellfish harvesting areas subjected to
34
fecal contaminations in order to identify the different sources of contamination and improve
35
watershed management.
36
37 38
3
Abbreviations
39
BSTFA N,O-bis- (trimethylsilyl)trifluoroacetamide
40
DCM Dichloromethane
41
DW Dry weight
42
GC-MS Gas chromatography- mass spectrometry
43
MeOH Methanol
44
NH2 Aminopropyl-bonded silica gel
45
PCA Principal component analysis
46
TMCS Trimethylchlorosilane
47 48
4 49
1. Introduction 50
51
Coastal and shellfish harvesting areas are subjected to fecal contaminations from human
52
and animal waste leading to sanitary risks due to the presence of source-specific microbial
53
pathogens in contaminated waters and shellfish [1,2,3]. Among shellfish, several species of
54
bivalves such as mussels and oysters have been used as biological models for research in
55
ecotoxicology and biomonitoring since they are suspension filter-feeders which may
56
bioaccumulate and record environmental contaminants into their tissues [4, 5].
57
Fecal contamination of shellfish is particularly acute in France which is the first European
58
producer of oysters (mainly Crassostrea gigas) [6]. In Brittany, one of the main areas of
59
production of Crassostrea gigas, shellfish can be subjected to fecal contamination leading to
60
the closure of shellfish harvesting areas [7]. Therefore, to limit i) sanitary risks linked to the
61
consumption of contaminated shellfish and especially Crassostrea gigas and ii) economic loss
62
due to the closure of shellfish harvesting areas, it is crucial to improve watershed management
63
by controlling and limiting the sources of fecal contamination within these environments.
64
For this purpose, the actual European Shellfish Directive on shellfish harvesting
65
(854/2004/EC) imposes the classification of shellfish and requires the assessment of potential
66
pollution sources upstream of shellfish harvesting. The actual classification is based on the
67
fecal indicator bacteria Escherichia coli and enterococci which are not species-specific.
68
In order to distinguish human and animal sources of fecal contamination within
69
environment, microbial source tracking methods have been developed during the last decade.
70
Based on specific microbial or chemical markers from human or animals, they have been
71
successfully applied to field studies to identify the sources of fecal contamination in water,
5
soil and sediment [7-16]. Among chemical markers, fecal stanols have proven their usefulness
73
as direct fecal markers [17]. Indeed, the distribution of fecal stanols in animal faeces relies on
74
three main factors: i) the animal’s diet, ii) the ability of animals to biosynthesize endogenous
75
sterols and iii) the composition of the intestinal flora responsible for sterol biohydrogenation
76
into stanols. Consequently, the fecal stanol fingerprint allows to distinguish between different
77
fecal sources in environmental matrix by the use of stanol ratios [18-20] or multivariate
78
analyses [14, 15, 21, 22].
79
In Brittany, the main sources of fecal contamination in water are human wastewater
80
treatment effluent, porcine and bovine manure or slurry [12]. In this region, the transfer time
81
of water in coastal watersheds from streams to sea can last for one day [23] and it has been
82
shown that a stanol fingerprint associated with a specific source of contamination can last for
83
six days in fresh and seawaters microcosms [24, 25]. Therefore, the specificity of a stanol
84
fingerprint can be transferred from inland waters to receiving seawater, which could allow the
85
identification of the sources of fecal contamination in water in such areas [14, 20]. In shellfish
86
harvesting areas, shellfish can bio-accumulate microbial pathogens by filtration of
87
contaminated surrounding waters, which enables the identification of contamination sources
88
using microbial markers [7]. However, it is still unknown whether chemical markers such as
89
fecal stanols and corresponding stanol fingerprints allow the identification of fecal
90
contamination sources in oysters.
91
Indeed, studies dealing with the occurrence of fecal stanols in shellfish mainly have
92
focused on coprostanol as a marker of human fecal contamination in fresh or seawater
93
mussels [26-31]. However, the identification of fecal sources with stanol fingerprints requires
94
the accurate analysis of several compounds [14, 17, 22]. Therefore, it is necessary to develop
95
an analytical pathway that allows the quantification of different fecal stanols in shellfish
96
matrix, which constituted the first goal of the present study.
6
Among the main studies focusing on coprostanol quantification in mussels, only Cathum
98
and Sabik [27] have tested the extraction efficiency of their method and found recoveries of
99
about 48 % for wet mussel samples. As a consequence, the efficiencies of such methods
100
remain largely unknown. In this present study, the efficiencies and repeatabilities of three
101
analytical pathways have been compared for the stanol extraction of the oyster Crassostrea
102
gigas using two recovery standards:
103
-The first method consisted of three steps: i) extraction of lipids from oyster matrix, ii)
104
purification of lipids on silica gel and iii) analysis of stanol fraction by gas chromatography-
105
mass spectrometry (GC-MS).
106
-The second method comprised of a washing step of oyster tissue with water prior to lipid
107
extraction. Indeed, shellfish such as oysters can be constituted of more than 90 % of
non-108
lipid compounds such as glycogen and proteins that can potentially interact with lipids and
109
decrease their recoveries [32, 33]. Therefore, a washing step of matrix with water prior to
110
the lipid extraction step allows the removal of the non-lipid compounds and could improve
111
extraction efficiencies of stanols [34, 35].
112
-The third method comprised of a second purification step of lipids on
aminopropyl-113
bonded silica gel after that on silica gel. The separation of lipid classes from the total
114
extract is mandatory in complex environmental matrix to improve the analysis accuracy of
115
target compounds. The lipid fraction of oysters is a complex mixture containing several
116
lipid classes such as phospholipids, triacylglycerols, free fatty acids, sterols and stanols
117
[36]. Therefore, the addition of a purification step could be particularly interesting in order
118
to remove as much of lipids of non-interest as possible. Aminopropyl-bonded silica gel
119
(NH2) was chosen as the second sorbent because of its affinity and subsequent selective
120
retention of acidic phospholipids [37].
7
To the best of our knowledge, no method has been developed for the analysis of several
122
fecal stanols in shellfish. Among the three methods tested here, the one leading to the highest
123
and similar recoveries and highest repeatabilities for both recovery standards was chosen to
124
analyse the concentration of several fecal stanols in oysters from northern Brittany, France.
125
The stanol fingerprint of these oysters were analyzed by principal component analysis (PCA)
126
in order to identify the fecal contamination sources in this shellfish harvesting area.
127
128
2. Experimental 129
130
2.1. Reagent and chemicals
131
Organic solvents were of high performance liquid chromatography grade.
132
Dichloromethane (DCM) was purchased from Carlo-Erba SDS (Val de Reuil, France),
133
methanol (MeOH) and cyclohexane were purchased from VWR (West Chester, PA). N,O-bis-
134
(trimethylsilyl)trifluoroacetamide and trimethylchlorosilane (99:1, by vol) (BSTFA + TMCS)
135
and SPE disks (Supelco ENVI-18DSK, 47mm diameter) were purchased from Supelco (St.
136
Quentin Fallavier, France). Coprostanol (5β-cholestan-3β-ol), cholestanol
(5α-cholestan-3β-137
ol), 5α-cholestane and aminopropyl-bonded silica gel were purchased from Sigma (St.
138
Quentin Fallavier, France). Sitostanol (24-ethyl-5α-cholestan-3β-ol) was purchased from
139
Steraloids (Newport, RI). 24-Ethylcoprostanol (24-ethyl-5β-cholestan-3β-ol) and
24-140
ethylepicoprostanol (24-ethyl-5β-cholestan-3α-ol) were purchased from BCP Instruments
141
(Irigny, France). Silica gel (40-63 µm) was purchased from Merck (Darmstadt, Germany).
142
Cholesterol d6 ([2,2,3,4,4,6-2H6]-cholest-5-en-3β -ol) was purchased from CDN Isotopes
143
(Pointe-Claire, Quebec, Canada).
144 145
2.2. Sample preparation
8
To compare the three analytical pathways, 90 oysters (Crassostrea gigas) were purchased
147
at Cancale (Brittany, France) in November 2012. After purchasing, oysters were opened, the
148
intervalvular liquid discarded, the flesh of 10 individuals were pooled as one sample (ca. 4 g
149
of dry weight flesh), frozen, freeze-dried and finally ground with an agate mortar for
150
homogenization.
151
As the main goal of this study is to analyse several fecal stanols in shellfish tissues, two
152
recovery standards were used to determine the reliability of the tested methods. The common
153
human marker coprostanol was the first one and sitostanol was chosen as the second recovery
154
standard because it is a fecal stanol rather representative of a bovine contamination [17].
155
Coprostanol and sitostanol were spiked on the freeze-dried flesh pool just before organic
156
extraction (methods 1 and 3, see below) or aqueous extraction (method 2, see below) at a
157
concentration of 10 µg g-1 dry weight (DW). This concentration is in the range of coprostanol
158
concentration recorded in bivalves after human fecal contamination [26-31]. For both blanks
159
and spiked samples, each extraction method was performed in triplicates.
160 161
2.3. Application to a study case: the Fresnaye bay
162
Among the three methods tested, the one leading to the better recoveries of spiked
163
coprostanol and sitostanol and to better repeatabilities was used to determine the
164
concentration and the distribution of fecal stanols of oysters from the Fresnaye bay (Brittany,
165
France, Figure 1). This bay is an intensive shellfish harvesting area with an annual production
166
of ca. 550 tons of Crassostrea gigas intended for human consumption. The Fresnaye
167
watershed covers 121 km² and its number of human inhabitants is estimated at 14 000. The
168
potential sources of fecal contaminations originate from the seven wastewater treatment plants
169
of the watershed and multiple sources of untreated wastewater, and its agricultural area covers
170
ca. 70 % of watershed area with intensive livestock farming of pigs (ca. 235.000 head in
9
2010), and cows (ca. 5300 head in 2010) [38]. In the last decade, this shellfish harvesting area
172
is subjected to increasing fecal contaminations by these different sources leading to the
173
degradation of the quality of oysters. In February, March and August 2013, oysters were
174
sampled at two locations on the bay and analysed for each sampling date.
175
176
2.4. Analytical pathways for stanol analysis
177
Figure 3 summarizes the different steps involved in the four analytical pathways
178
investigated for the analysis of fecal stanols in oyster tissues. Each step is described in detail
179
below. Briefly, the method 1 consisted of an extraction of lipids with DCM followed by a
180
purification step on silica gel and analysis of fecal stanols by GC-MS. The method 2 consisted
181
of a first purification step of samples with water prior to lipid extraction followed by a
182
purification on silica gel and GC-MS analysis. The method 3 involved a second purification
183
step on aminopropyl-bonded silica gel prior to GC-MS analysis.
184
185
2.4.1. Lipid extraction
186
For the three analytical pathways, lipids were extracted using an Accelerated Solvent
187
Extractor (ASE 200, Dionex, Courtaboeuf, France) with DCM. For each sample, about 4 g of
188
freeze-dried tissue were extracted 3 times in pre-washed (with DCM) 33 mL extraction cells.
189
Each extraction consisted in 2 cycles of 5 min at 100°C and 100 bar followed by a 40 second
190
flush step and a 30 second purge step. Each extract was then concentrated under reduced
191
pressure and the 3 extracts were pooled. Then, total lipid extracts were dried, weighed and
192
dissolved in 20 mL of DCM to obtain a concentration of ca. 20 mg mL-1 of lipids compounds
193
and stored at – 20°C until fractionation.
194 195
2.4.2. Silica gel purification
10
About 10 g of silica gel was preconditioned with ca. 50 mL of a mixture of
197
cyclohexane/DCM (2:1, by vol) and loaded into a 35 mL chromatography column equipped
198
with a glass frit and a pre-washed (with DCM) cotton wool at the bottom. Aliquots of 5 mL of
199
total lipid extract, corresponding to ca. 100 mg, were made up to a final volume of 15 mL in
200
cyclohexane to obtain of final ratio of cyclohexane/DCM of 2:1 by volume before loading on
201
the silica column. Nonpolar compounds were eluted with 30 mL of a mixture of
202
cyclohexane/DCM (2:1, by vol) and the stanol-containing polar fraction was eluted with 40
203
mL of a mixture of DCM/Methanol (MeOH, 1:1, by vol). On average, this fraction accounted
204
for 70 % of total lipids. For all samples, the elution was completed with pressurized air. For
205
methods 1 and 3, the polar fraction of interest containing stanols was then dried under reduced
206
pressure and weighed for quantification.
207 208
2.4.3. Aqueous extraction
209
For the method 2, freeze-dried tissues were extracted with 50 mL of ultra-pure water to
210
obtain a ratio of 10 mL per gram of sample, and extractions were performed with stirrers at
211
ambient temperature overnight [39]. Then the separation of the solid residue from the aqueous
212
extract was performed by centrifugation (2 x 15 min at 3500 rpm and 10°C, Rotenta 460 R
213
centrifuge, Hettich, Tuttlingen, Germany). The solid residue was freeze-dried prior to lipid
214
extraction and the aqueous extract filtered through a 0.7µm glass-fiber filter. In order to
215
analyse the amount of fecal stanols removed from the sample by the water purification step,
216
solid phase extractions were performed on aqueous extracts as described by Jeanneau et al.
217
[39].
218
219
2.4.4. Aminopropyl-bonded silica gel purification
11
For method 3, the polar fraction eluted on the silica gel column was loaded on a
221
chromatography column containing about 10 g of aminopropyl-bonded silica gel (NH2)
222
preconditioned with ca. 50 mL of a mixture of DCM/MeOH (1:1, by vol). The fraction
223
containing stanols was eluted with 30 mL of a mixture of DCM/MeOH (1:1, by vol), dried
224
under reduced pressure and weighted for quantification.
225 226
2.2.5. Stanols analysis by gas chromatography-mass spectrometry (GC-MS)
227
Stanols were derivatizated using a mixture of BSTFA + TMCS (99:1, by vol) at 60°C
228
during 20 minutes to convert hydroxyl groups into trimethylsilyl ether groups.
229
Stanols as trimethylsilyl ethers were analysed by GC–MS with a Shimadzu QP2010 +
230
MS gas chromatograph/mass spectrometer (Shimadzu, Tokyo, Japan). 1 µL of samples was
231
injected in splitless mode at 310°C. The temperature of the ionization source was set at
232
200°C. The temperature of the transfer line was set at 250°C, and molecules were ionized by
233
electron impact using an energy of 70 eV. Separation was achieved using a fused silica
234
column coated with SLB-5 MS (Supelco, 60 m, i.d. 0.25 mm, film thickness 0.25 µm) with
235
helium as carrier gas at a flow of 1 mL min-1. The GC oven temperature was maintained at
236
70°C for 1 min, then increased to 130°C at 15 °C min-1, then to 300°C at 3°C min-1 and held
237
at this temperature for 15 min.
238
Identification of stanols was based on the comparison with mass spectra and retention
239
times of standards. Analyses were performed in selective ion monitoring mode, the identified
240
and quantified stanols were coprostanol, cholestanol, campestanol, stigmastanol,
5β-241
stigmastanol, sitostanol, 24-ethylcoprostanol and 24-ethylepicoprostanol and (Table 1 and 2).
242
Figure 2 presents the structures of coprostanol, sitostanol and other stanols involved in this
243
study. As 24-ethylcoprostanol eluted with other compounds, the mass fragmentogram of this
12
signal (main fragments m/z: 253, 296, 343, 386, 470) was a combination of the mass
245
fragmentogram of those coeluted compounds. Therefore, the 215 fragment used to quantify
246
stanols could originate from another compound and was not used here. As the 398 fragment is
247
used as an identification fragment for 24-ethylcoprostanol and as its intensity was similar to
248
that of the 215 fragment for all calibration solutions, it has been used here as the
249
quantification fragment.
250
Quantification was based on the internal standard 5α-cholestane, which was added to
251
samples after extraction and fractionation steps and prior to derivatization [12, 14, 15, 22, 39]
252
In opposition to recovery standards spiked in oysters (coprostanol and sitostanol) that were
253
used to quantify the efficiency of extraction procedures and to evaluate matrix effects, the
254
internal standard was used to evaluate losses of sensivity of the detection with GC-MS. The
255
quantification method used a five-point calibration curve (standards: coprostanol, cholestanol
256
and sitostanol) at concentrations of 1, 3, 5, 8, and 10 μg mL-1 with a constant internal standard
257
concentration of 5 μg mL-1
. Considering the mass of samples and dilutions performed during
258
the analytical procedures, the limits of quantification for stanols analysed in oysters ranged
259
from 5 to 50 µg g-1 DW. Linearity of calibration curves, detection limits of GC-MS and
260
fragment used for the quantification of stanols are described in the Table 1.
261
The recoveries of spiked coprostanol and sitostanol (recovery standards) were calculated
262
as follows:
263
264
2.5. Escherichia coli analysis
13
In order to investigate the level of fecal contamination of oysters from the Fresnaye bay,
266
the concentration of the fecal indicator bacteria Escherichia coli was determined by
267
IFREMER (Laboratoire National de Référence , Nantes, France) using the impedance method
268 [41]. 269 270 2.6. Statistical analyses 271
The analyses were conducted on three replicates for each sample for the comparison of
272
the efficiencies of the three analytical pathways on the recoveries of both recovery standards
273
and on two replicates for oysters from the Fresnaye bay. As non-parametric tests can lead to
274
the conclusion that observed differences are not significant whereas qualitative differences are
275
evident for low replication, comparison of stanol concentrations between samples were only
276
qualitative.
277
Stanol fingerprints of oysters from the Fresnaye bay were investigated using the principal
278
component analysis (PCA) model set up by Derrien et al. [22] with XLSTAT 2013
279
(Addinsoft, Paris, France). Briefly, this model is based on the distribution of six main fecal
280
stanols (i.e., coprostanol, epicoprostanol, 24-ethylcoprostanol, 24 ethylepicoprostanol,
281
campestanol, and sitostanol) of 88 various samples from bovine, porcine (faeces, manures,
282
slurries…) and human origin (raw and diluted waste water treatment plant effluent, sewage
283
sludges). The PCA plot is a two-dimensional graphic representation of the correlations
284
between the 6 stanols (variables). This plan is built on two axis (principal components) F1 and
285
F2, which explain 78.3 % of the total variance of the model. Each of the 6 stanol distribution
286
contributes to F1 and F2 axis. This model distinguish the stanol fingerprints from the three
287
previous origins into three distinctive clusters. Based, on their abundance of the 6 previous
288
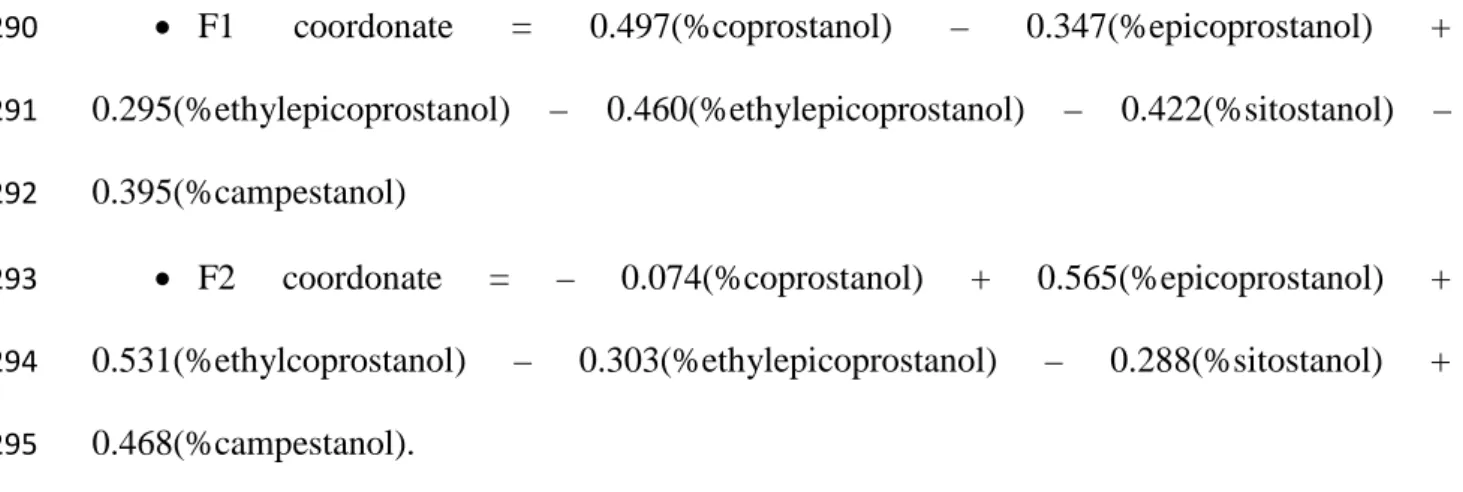
stanols, the coordinates of samples on the PCA plots are calculated as follows:
14
• F1 coordonate = 0.497(%coprostanol) – 0.347(%epicoprostanol) +
290
0.295(%ethylepicoprostanol) – 0.460(%ethylepicoprostanol) – 0.422(%sitostanol) –
291
0.395(%campestanol)
292
• F2 coordonate = – 0.074(%coprostanol) + 0.565(%epicoprostanol) +
293
0.531(%ethylcoprostanol) – 0.303(%ethylepicoprostanol) – 0.288(%sitostanol) +
294
0.468(%campestanol).
295
These equations allow the identification of the origin of fecal contamination in
296
environmental matrix between, bovine, porcine and human contaminations using this PCA
297
model.
298
299
3. Results and Discussion 300 3.1. Method comparison 301 302 3.1.1. Water extraction 303
Non-lipid compounds can interact with lipids and decrease the efficiency of their
304
extraction from the sample matrix or their separation during solid-phase chromatography.
305
Thus, the addition of an extraction step with water is expected to increase the recovery of
306
target lipids. To investigate the effects of water extractions on the recovery of coprostanol and
307
sitostanol in oysters, we compared the method 1 (organic extraction and silica gel
308
purification) to the method 2 (water extraction, organic extraction and silica gel purification).
309
Figure 4 presents recoveries of both coprostanol and sitostanol for the two methods tested.
310
The recovery of coprostanol extracted with the method 2 (59 ± 10 %, mean ± standard
311
deviation, SD) was lower than that extracted with the method 1 (79 ± 8 %) and the two
312
methods led to similar repeatabilities. Similarly, the recovery of sitostanol extracted with the
15
method 2 (47 ± 13 %) was lower than that extracted with the method 1 (84 ± 8 %) and the
314
repeatability of the method 2 was lower than that of the method 1. Contrary to our hypothesis,
315
the recoveries of both coprostanol and sitostanol extracted with the method 2 tended to be
316
lower than those of the method 1. This result suggests that the extraction step with water
317
removed more coprostanol and sitostanol than it decreased the potential interactions of these
318
two molecules with non-lipid compounds. Interestingly, the addition of coprostanol and
319
sitostanol quantities analysed in aqueous extracts by solid phase extraction to the quantities of
320
coprostanol and sitostanol in oyster tissues extracted with the method 2 led to quite similar
321
recoveries (61 versus 59 % for coprostanol and 54 versus 47 % for sitostanol) and remained
322
lower than those without the water extraction (method 1). This imbalance could be attributed
323
to the low efficiency of solid phase extraction on aqueous extracts that are very rich in
324
hydrophilic organic compounds, which greatly decrease the efficiency of this method [40].
325
Unfortunately, the efficiency of solid phase extractions could not be checked because of the
326
coelution of the recovery standard cholesterol d6 with cholesterol.
327 328
3.1.2. Aminopropyl-bonded silica gel (NH2) purification 329
Oysters contain high amounts of lipids from different classes that can potentially interact
330
each other’s and decrease the efficiency of their analysis [32, 33, 37]. The effects of a
331
purification step with NH2 was tested in order to remove as much as compounds of
non-332
interest as possible. The comparison of the efficiency of the methods 1 (organic extraction and
333
silica gel purification) and 3 (organic extraction, silica gel and NH2 purifications) allows the
334
investigation of the impact of this second purification step.
335
The recoveries of coprostanol were 79 ± 8 % and 89 ± 15 % for the methods 1 and 3,
336
respectively and the recoveries of sitostanol were 84 ± 8 %, 103 ± 70 % for the methods 1 and
337
3, respectively (Figure 4). The addition of this second chromatographic step involving
16
aminopropyl-bonded silica seems to induce an increase of the recoveries of both coprostanol
339
and sitostanol. However, the standard deviation between the triplicates highlights that the
340
values of the recoveries belong to the same group and that the methods appear to be not
341
different. The repeatability of the methods 1 and 3 can be inferred from the value of the
342
relative standard deviation. For the method 1, the relative standard deviation represented 10
343
and 9% of the mean value for coprostanol and sitostanol, respectively, while for method 3 it
344
represented 17 and 68% of the mean value for coprostanol and sitostanol, respectively.
345 346
3.1.3. Comparison of the three methods
347
The first goal of the present study was to determine an efficient method for the analysis
348
of fecal stanols in the oyster Crassostrea gigas.
349
Water extraction led to opposite trends on coprostanol and sitostanol recoveries and
350
increased their respective standard deviation. Thus, the addition of this step on the extraction
351
pathway i) did not increase the recovery of both recovery standards and ii) decreased their
352
repeatabilities. As a consequence, water extraction prior to organic extraction is not reliable
353
for the analysis of fecal stanols in oysters.
354
The addition of a purification step on NH2 increased the recoveries of coprostanol and
355
sitostanol. Nevertheless, this step strongly decreased the repeatabilities of the methods tested,
356
especially for sitostanol. Therefore, this step does not appear to be reliable for the analysis of
357
fecal stanols in oysters.
358
Finally, among the three methods tested, , the method 1, which included a lipid extraction
359
step with organic solvent, a purification step on silica gel and analysis by GC-MS, led to i)
360
statistically similar recoveries than the others two methods, ii) the higher repeatability and iii)
361
similar recoveries for both recovery standards. Moreover, the recovery of coprostanol with the
17
method 1 (79%) is higher than that found by Cathum and Sabik [27] (48%) probably because
363
these authors analysed coprostanol by GC-MS as underivatized compound.
364
In order to further improvement of this method and solvent and sorbent savings, stanol
365
extraction efficiency could be investigate using pre-packed silica cartridges available for
366
solid-phase extraction.
367
Finally, the method 1 has been chosen to analyse the concentration of fecal stanols in
368
natural oysters sampled at the Fresnaye bay.
369
370
3.2. Stanol occurrence and concentrations in natural oysters from the Fresnaye bay
371
Table 2 presents the concentrations of the stanols quantified in oysters sampled in
372
February, March and August 2013.
373
Eight stanols were detected and quantified in the samples analysed. Cholestanol was the
374
major compound and ranged from 58.4 µg g-1 DW (August) to 221.8 µg g-1 DW (February).
375
As these concentrations were above the upper limit of quantification of our method (i.e. 50 µg
376
g-1 DW), they were just qualitatively discussed in comparison to the concentrations of the
377
other stanol found in oysters. The other stanols detected and quantified were coprostanol, 5
β-378
stigmastanol, 24-ethylcoprostanol, 24-ethylepicoprostanol, campestanol, stigmastanol and
379
sitostanol and their concentrations ranged from 7.5 to 21.7 µg g-1 DW. The predominance in
380
Crassostrea gigas of cholestanol compared to other stanols is not surprising since its
381
precursor, cholesterol, is the main sterol in oysters [42-44]. Dunstan et al. [43] found
382
concentration of cholestanol of ca. 112 µg g-1 DW for Crassostrea gigas that is our range of
383
concentrations for cholestanol. Since cholestanol have been rarely found or in very low
384
concentrations in the diet of bivalves largely dominated by phytoplankton [45, 46], its high
385
relative abundance in bivalves might be due to the bioconversion of cholesterol during the
386
digestive process by the presence of gut bacteria [47]. However, cholesterol might not be the
18
only dietary sterol supplied by food leading to the formation of cholestanol within bivalves.
388
Indeed, it has been shown that marine bivalves are able to bioconvert several dietary sterols
389
into cholesterol for physiological needs [43, 48]. Furthermore, the high variability of
390
cholestanol concentrations between oyster samples from date to date are accompanied by high
391
variations of total stanol concentrations, which ranged from 145.0 µg g-1 DW (August) to
392
297.6 µg g-1 DW (February). These variations might be due to the differences in
physico-393
chemical conditions of surrounding seawater between sampling dates that could have led to
394
different metabolic responses of oysters resulting in different stanol concentrations.
395 396
3.3. Fecal contamination and stanol fingerprint of oysters
397
The concentration of Escherichia coli in oysters sampled in February and March was
398
respectively 67 and 220 Most Probable Number 100 g-1 (Table 2). According to the European
399
Shellfish Directive on shellfish harvesting (854/2004/EC), these amounts of Escherichia coli
400
classified the two previous samples in the A class and oysters collected in February and
401
March were considered as non-fecally contaminated. With a concentration of Escherichia coli
402
of ca. 9150 Most Probable Number 100 g-1, oysters sampled in August were classified in the
403
B class and considered here as fecally contaminated.
404
In order to investigate the ability of oysters to record a species-specific fecal
405
contamination by bioaccumulation using their stanol fingerprint, the relative proportions of
406
fecal stanols of the three samples were injected in the PCA developed by Derrien et al. [14].
407
Stanol fingerprints of oysters sampled in February (F1 and F2) and March (M1 and M2) were
408
located between the bovine and the human clusters (Figure 5). This absence of a specific
409
fingerprint is consistent with the absence of a fecal contamination of these samples measured
410
with Escherichia coli. By contrast, the fecally contaminated oysters sampled in August (A1
411
and A2) showed specific stanol fingerprints located in the bovine cluster (Figure 5). The
19
absence of a specific stanol fingerprint of oysters when they are not fecally contaminated in
413
addition to the specific stanol fingerprint of oysters fecally contaminated suggests that these
414
organisms could be able to record a species-specific stanol fingerprint when they are exposed
415
to a fecal contamination high enough. The bovine fingerprint of oysters sampled in August
416
suggests that the fecal contaminations transferred from the watershed to seawater and
417
bioaccumulated by oysters during this period would mainly originate from bovine sources.
418
This hypothesis is consistent with the agricultural activity of the watershed where livestock
419
farming of cows is not negligible with ca. 5300 heads of livestock in 2010 [38]. The
420
contamination of oysters by bovine sources suggested by their specific stanol fingerprint in
421
August could be explained by agricultural practices and manure spreading calendar. Indeed,
422
during summer, cows are grazing on grassland and thought lixiviation and erosion of soils
423
during raining events, even low, their faeces can be directly transported to streams that flow
424
into the bay. In August, pig slurry spreading is forbidden, so the large quantities of pig slurry
425
produced by pig farming (ca. 235.000 pigs in 2010 in the watershed) remain stored, limiting
426
the fecal contamination of soils, streams and finally shellfish by this source.
427
In conclusion, the method developed here enables to analyse the concentration of eight
428
fecal stanols in oysters and to record and identify the main source of fecal contamination of
429
oysters using their stanol fingerprint with PCA. Stanol fingerprint could then be used as a
430
microbial source tracking tool in oysters to track the origin of the fecal contamination in
431
shellfish in order to enhance watershed management and reduce health risks linked to the
432
consumption of contaminated shellfish.
433
434
Acknowledgements 435
As a part of the Riskmanche project (http://www.brighton.ac.uk/riskmanche/), this study
436
was fully funded by the Interreg IV A France (Channel) – England cross-border European
20
cooperation programme. We thank the Laboratoire National de Référence for analyses of
438
Escherichia coli, Mr. Pascal Blanchard for oyster supply, colleagues from the Laboratoire
439
Santé Environnement et Microbiologie (IFREMER, Plouzané, France) for oyster sampling
440
and Dr. Justine Jaguin for her graphical help.
441
21 443
References 444
445
1. Fong T-T, Lipp EK (2005) Enteric viruses of humans and animals in aquatic
446
environments: health risks, detection, and potential water quality assessment tools.
447
Microbiol Mol Biol Rev 69:357–71. doi: 10.1128/MMBR.69.2.357-371.2005
448
2. Hundesa A, Maluquer de Motes C, Bofill-Mas S, et al. (2006) Identification of human
449
and animal adenoviruses and polyomaviruses for determination of sources of fecal
450
contamination in the environment. Appl Environ Microbiol 72:7886–93. doi:
451
10.1128/AEM.01090-06
452
3. Soller J, Embrey M, Tuhela L, et al. (2010) Risk-based evaluation of Escherichia coli
453
monitoring data from undisinfected drinking water. J Environ Manage 91:2329–35.
454
doi: 10.1016/j.jenvman.2010.06.017
455
4. Zatta P, Gobbo S, Rocco P, et al. (1992) Evaluation of heavy metal pollution in the
456
Venetian lagoon by using Mytilus galloprovincialis as biological indicator. Sci Total
457
Environ 119:29–41. doi: 10.1016/0048-9697(92)90253-O
458
5. Baudrimont M, Schäfer J, Marie V, et al. (2005) Geochemical survey and metal
459
bioaccumulation of three bivalve species (Crassostrea gigas, Cerastoderma edule and
460
Ruditapes philippinarum) in the Nord Médoc salt marshes (Gironde estuary, France).
461
Sci Total Environ 337:265–280.
462
6. Goulletquer P, Le Moine O (2002) Shellfish farming and coastal zone management
463
(CZM) development in the Marennes-Oleron Bay and Charentais Sounds (Charente
464
Maritime, France): A review of recent developments. Aquac Int 10:507–525. doi:
465
10.1023/A:1023975418669
22
7. Mieszkin S, Caprais MP, Le Mennec C, et al. (2013) Identification of the origin of
467
fecal contamination in estuarine oysters using Bacteroidales and F-specific RNA
468
bacteriophage markers. J Appl Microbiol 115:897–907. doi: 10.1111/jam.12260
469
8. Simpson JM, Santo Domingo JW, Reasoner DJ (2002) Microbial Source Tracking:
470
State of the Science. Environ Sci Technol 36:5279–5288. doi: 10.1021/es026000b
471
9. Glassmeyer ST, Furlong ET, Kolpin DW, et al. (2005) Transport of Chemical and
472
Microbial Compounds from Known Wastewater Discharges: Potential for Use as
473
Indicators of Human Fecal Contamination. Environ Sci Technol 39:5157–5169. doi:
474
10.1021/es048120k
475
10. Cimenti M, Hubberstey A, Bewtra J, Biswas N (2007) Alternative methods in tracking
476
sources of microbial contamination in waters. Water SA 33:183–194.
477
11. Field KG, Samadpour M (2007) Fecal source tracking, the indicator paradigm, and
478
managing water quality. Water Res 41:3517–38. doi: 10.1016/j.watres.2007.06.056
479
12. Jardé E, Gruau G, Mansuy-Huault L, et al. (2006) Using Sterols to Detect Pig Slurry
480
Contribution to Soil Organic Matter. Water Air Soil Pollut 178:169–178. doi:
481
10.1007/s11270-006-9188-9
482
13. Ahmad F, Tourlousse DM, Stedtfeld RD, et al. (2009) Detection and Occurence of
483
Indicator Organisms and Pathogens. Water Environ Res 81:959–980. doi:
484
10.2175/106143009X12445568399299
485
14. Derrien M, Jardé E, Gruau G, et al. (2012) Origin of fecal contamination in waters
486
from contrasted areas: stanols as Microbial Source Tracking markers. Water Res
487
46:4009–16. doi: 10.1016/j.watres.2012.05.003
488
15. Biache C, Philp RP (2013) The use of sterol distributions combined with compound
489
specific isotope analyses as a tool to identify the origin of fecal contamination in
490
rivers. Water Res 47:1201–8. doi: 10.1016/j.watres.2012.11.037
23
16. Chan K-H, Lam MHW, Poon K-F, et al. (1998) Application of sedimentary fecal
492
stanols and sterols in tracing sewage pollution in coastal waters. Water Res 32:225–
493
235. doi: 10.1016/S0043-1354(97)00175-9
494
17. Leeming R, Ball A, Ashbolt N, Nichols P (1996) Using fecal sterols from humans and
495
animals to distinguish fecal pollution in receiving waters. Water Res 30:2893–2900.
496
doi: 10.1016/S0043-1354(96)00011-5
497
18. Bull ID, Lockheart MJ, Elhmmali MM, et al. (2002) The origin of faeces by means of
498
biomarker detection. Environ Int 27:647–654. doi: 10.1016/S0160-4120(01)00124-6
499
19. Tyagi P, Edwards DR, Coyne MS (2009) Distinguishing between human and animal
500
sources of fecal pollution in waters: a review. Int J Water 5:15. doi:
501
10.1504/IJW.2009.023080
502
20. Gourmelon M, Caprais MP, Le Mennec C, et al. (2010) Application of
library-503
independent microbial source tracking methods for identifying the sources of fecal
504
contamination in coastal areas. Water Sci Technol 61:1401. doi:
505
10.2166/wst.2010.033
506
21. Shah VG, Dunstan RH, Geary PM, et al. (2007) Evaluating potential applications of
507
fecal sterols in distinguishing sources of fecal contamination from mixed fecal
508
samples. Water Res 41:3691–700. doi: 10.1016/j.watres.2007.04.006
509
22. Derrien M, Jarde E, Gruau G, Pierson-Wickmann A-C (2011) Extreme variability of
510
steroid profiles in cow feces and pig slurries at the regional scale: implications for the
511
use of steroids to specify fecal pollution sources in waters. J Agric Food Chem
512
59:7294–302. doi: 10.1021/jf201040v
513
23. Water National Agency of Loire-Brittany. (accessed Jan. 2014).
http://www.eau-loire-514
bretagne.fr/informations_et_donnees/reseaux_de_mesure
24
24. Solecki O, Jeanneau L, Jardé E, et al. (2011) Persistence of microbial and chemical
516
pig manure markers as compared to fecal indicator bacteria survival in freshwater and
517
seawater microcosms. Water Res 45:4623–33. doi: 10.1016/j.watres.2011.06.012
518
25. Jeanneau L, Solecki O, Wéry N, et al. (2012) Relative decay of fecal indicator bacteria
519
and human-associated markers: a microcosm study simulating wastewater input into
520
seawater and freshwater. Environ Sci Technol 46:2375–82. doi: 10.1021/es203019y
521
26. Sherwin MR, Van Vleet ES, Fossato VU, Dolci F (1993) Coprostanol
(5β-cholestan-522
3β-ol) in lagoonal sediments and mussels of Venice, Italy. Mar Pollut Bull 26:501–
523
507. doi: 10.1016/0025-326X(93)90467-X
524
27. Cathum S, Sabik H (2001) Determination of steroids and coprostanol in surface water,
525
effluent and mussel using gas chromatography-mass spectrometry. Chromatographia
526
53:S394–S399. doi: 10.1007/BF02490364
527
28. Gagné F, Blaise C, Aoyama I, et al. (2002) Biomarker study of a municipal effluent
528
dispersion plume in two species of freshwater mussels. Environ Toxicol 17:149–59.
529
doi: 10.1002/tox.10046
530
29. Gagné F, Blaise C, Lachance B, et al. (2001) Evidence of coprostanol estrogenicity to
531
the freshwater mussel Elliptio complanata. Environ Pollut 115:97–106. doi:
532
10.1016/S0269-7491(01)00089-6
533
30. Hellou J, Yeats P, Steller S, Gagné F (2003) Chemical contaminants and biological
534
indicators of mussel health during gametogenesis. Environ Toxicol Chem 22:2080.
535
doi: 10.1897/02-396
536
31. Yeats P, Gagné F, Hellou J (2008) Body burden of contaminants and biological effects
537
in mussels: an integrated approach. Environ Int 34:254–64. doi:
538
10.1016/j.envint.2007.08.009
25
32. Linehan L., O’Connor T., Burnell G (1999) Seasonal variation in the chemical
540
composition and fatty acid profile of Pacific oysters (Crassostrea gigas). Food Chem
541
64:211–214. doi: 10.1016/S0308-8146(98)00144-7
542
33. Costil K, Royer J, Ropert M, et al. (2005) Spatio-temporal variations in biological
543
performances and summer mortality of the Pacific oyster Crassostrea gigas in
544
Normandy (France). Helgol Mar Res 59:286–300. doi: 10.1007/s10152-005-0004-5
545
34. Danger M, Allard B, Arnous M, et al. (2012) Effects of food-web structure on the
546
quantity and the elemental quality of sedimenting material in shallow lakes.
547
Hydrobiologia 679:251–266. doi: 10.1007/s10750-011-0890-2
548
35. Guenet B, Danger M, Harrault L, et al. (2014) Fast mineralization of land-born C in
549
inland waters: first experimental evidences of aquatic priming effect. Hydrobiologia
550
721:35–44. doi: 10.1007/s10750-013-1635-1
551
36. Lacaze J-PCL, Stobo LA, Turrell EA, Quilliam MA (2007) Solid-phase extraction and
552
liquid chromatography--mass spectrometry for the determination of free fatty acids in
553
shellfish. J Chromatogr A 1145:51–7. doi: 10.1016/j.chroma.2007.01.053
554
37. Pernet F, Pelletier CJ, Milley J (2006) Comparison of three solid-phase extraction
555
methods for fatty acid analysis of lipid fractions in tissues of marine bivalves. J
556
Chromatogr A 1137:127–37. doi: 10.1016/j.chroma.2006.10.059
557
38. French Ministry of Agriculture, Agri-food and Forests (accessed Jan. 2014).
558
http://www.acces.agriculture.gouv.fr/cartostat/#v=map2;i=stru1.saumoy10;l=fr
559
39. Jeanneau L, Jardé E, Gruau G (2011) Influence of salinity and natural organic matter
560
on the solid phase extraction of sterols and stanols: application to the determination of
561
the human sterol fingerprint in aqueous matrices. J Chromatogr A 1218:2513–20. doi:
562
10.1016/j.chroma.2011.02.066
26
40. Landgraf D, Leinweber P, Makeschin F (2006) Cold and hot water-extractable organic
564
matter as indicators of litter decomposition in forest soils. J plant Nutr ans soil Sci
565
169:76–82. doi: 10.1002/jpin.200521711
566
41. Dupont J, Dumont F, Menanteau C, Pommepuy M (2004) Calibration of the
567
impedance method for rapid quantitative estimation of Escherichia coli in live marine
568
bivalve molluscs. J Appl Microbiol 96:894–902. doi:
10.1111/j.1365-569
2672.2004.02218.x
570
42. Gordon DT, Collins N (1982) Anatomical distribution of sterols in oysters
571
(Crassostrea gigas). Lipids 17:811–817. doi: 10.1007/BF02535358
572
43. Dunstan GA, Volkman JK, Barrett SM (1993) The effect of lyophilization on the
573
solvent extraction of lipid classes, fatty acids and sterols from the oysterCrassostrea
574
gigas. Lipids 28:937–944. doi: 10.1007/BF02537504
575
44. Knauer J, Kerr RG, Lindley D, Southgate PC (1998) Sterol Metabolism of Pacific
576
Oyster (Crassostrea gigas) Spat. Comp Biochem Physiol Part B Biochem Mol Biol
577
119:81–84. doi: 10.1016/S0305-0491(97)00269-1
578
45. Nishimura M, Koyama T (1977) The occurrence of stanols in various living organisms
579
and the behavior of sterols in contemporary sediments. Geochim Cosmochim Acta
580
41:379–385. doi: 10.1016/0016-7037(77)90265-4
581
46. Volkman JK (2003) Sterols in microorganisms. Appl Microbiol Biotechnol 60:495–
582
506. doi: 10.1007/s00253-002-1172-8
583
47. Harris JM (1993) The presence, nature, and role of gut microflora in aquatic
584
invertebrates - a synthesis. Microb Ecol 25:195–231.
585
48. Berenberg CJ, Patterson GW (1981) The relationship between dietary phytosterols and
586
the sterols of wild and cultivated oysters. Lipids 16:276–278. doi:
587
10.1007/BF02535028
27
Figure legends:
589
590
Figure 1: Location of oyster sampling sites, streams, towns and waste water treatment plants
591
(WWTP) in the Fresnaye watershed, Brittany, France.
592
593
Figure 2: Generalized structure of a stanol. The distinction between main fecal stanols
594
involves four points: i) the orientation (α or β) of the hydrogen atom at the position C-5
595
(mediated by the anaerobic reduction of the double bond located at the same position in the
596
corresponding unsaturated sterol precursor), ii) the orientation (α or β) of the hydroxyl group
597
at the position C-3, iii) the occurrence of methyl or ethyl groups at position C-24 (denoted by
598
R), and iv) the occurrence of a double bond at position C-22.
599
600
Figure 3: Schematic representation of the three analytical pathways used for the extraction
601
and the purification of fecal stanols from oyster samples (blanks and spiked ones) and their
602
subsequent analysis by GC–MS.
603
604
Figure 4: Comparison of coprostanol and sitostanol recoveries in oysters for the three
605
extraction methods. Error bars are standard deviations (n = 3). Values under the error bars are
606
relative standard deviations. The dotted line represents the 100% recovery threshold.
607
608
Figure 5: Plot of the principal component analysis comparing the 88 source samples and the 6
609
oyster samples using the 6 most discriminant stanol compounds proposed by Derrien et al.
28
(2012). Each source samples was used as individual and oyster samples were used as
611
supplementary individuals. F1 axis: principal component 1; F2 axis: principal component 2.
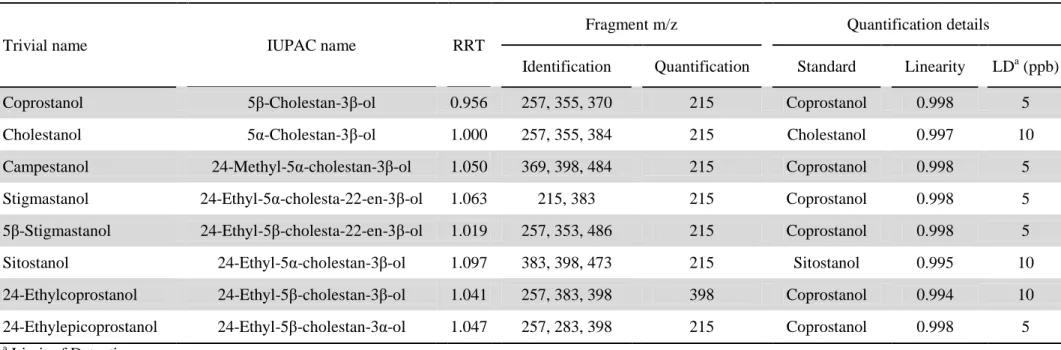
Table 1: Trivial and IUPAC names, retention times relative to cholestanol (RRT), m/z values used for the identification and quantification of stanols, and information on quantification compounds (standard used, linearity of the corresponding calibration curve, and limit of detection).
a
Limit of Detection
Trivial name IUPAC name RRT
Fragment m/z Quantification details
Identification Quantification Standard Linearity LDa (ppb)
Coprostanol 5β-Cholestan-3β-ol 0.956 257, 355, 370 215 Coprostanol 0.998 5
Cholestanol 5α-Cholestan-3β-ol 1.000 257, 355, 384 215 Cholestanol 0.997 10
Campestanol 24-Methyl-5α-cholestan-3β-ol 1.050 369, 398, 484 215 Coprostanol 0.998 5
Stigmastanol 24-Ethyl-5α-cholesta-22-en-3β-ol 1.063 215, 383 215 Coprostanol 0.998 5
5β-Stigmastanol 24-Ethyl-5β-cholesta-22-en-3β-ol 1.019 257, 353, 486 215 Coprostanol 0.998 5
Sitostanol 24-Ethyl-5α-cholestan-3β-ol 1.097 383, 398, 473 215 Sitostanol 0.995 10
24-Ethylcoprostanol 24-Ethyl-5β-cholestan-3β-ol 1.041 257, 383, 398 398 Coprostanol 0.994 10 24-Ethylepicoprostanol 24-Ethyl-5β-cholestan-3α-ol 1.047 257, 283, 398 215 Coprostanol 0.998 5
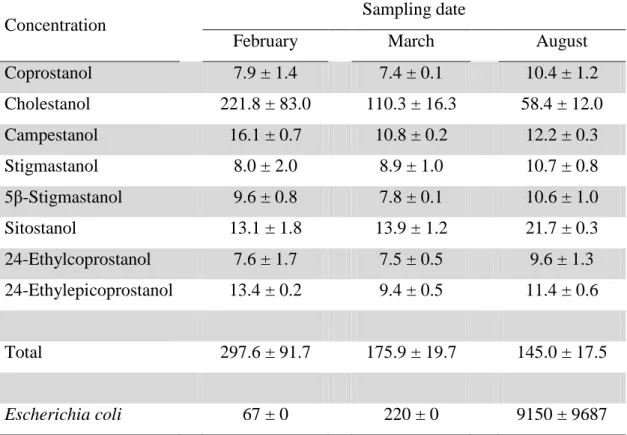
Table 2 : Stanol (µg g-1 DW) and Escherichia coli (Most Probable Number 100 g-1 of meat and shell liquor) concentrations of oysters from the Fresnaye bay. Errors are standard deviations (n = 2).
Concentration Sampling date
February March August Coprostanol 7.9 ± 1.4 7.4 ± 0.1 10.4 ± 1.2 Cholestanol 221.8 ± 83.0 110.3 ± 16.3 58.4 ± 12.0 Campestanol 16.1 ± 0.7 10.8 ± 0.2 12.2 ± 0.3 Stigmastanol 8.0 ± 2.0 8.9 ± 1.0 10.7 ± 0.8 5β-Stigmastanol 9.6 ± 0.8 7.8 ± 0.1 10.6 ± 1.0 Sitostanol 13.1 ± 1.8 13.9 ± 1.2 21.7 ± 0.3 24-Ethylcoprostanol 7.6 ± 1.7 7.5 ± 0.5 9.6 ± 1.3 24-Ethylepicoprostanol 13.4 ± 0.2 9.4 ± 0.5 11.4 ± 0.6 Total 297.6 ± 91.7 175.9 ± 19.7 145.0 ± 17.5 Escherichia coli 67 ± 0 220 ± 0 9150 ± 9687