The Development of Autocatalytic Structural
Materials for Use in the Sulfur-Iodine Process for
the Production of Hydrogen
by
Kevin Miu
Submitted to the Department of Mechanical Engineering
and
Nuclear Engineering
in partial fulfillment of the requirements for the degrees of
Bachelor of Science in Mechanical Engineering
and
Nuclear Engineering
at the
MASSACHUSETTS NSTITUTE.OF TECHNOLOGY
may 2006
( Massachusetts Institute of Technology 2006. All rights reserved.
Author
... ..
.... ...
D....
Department of Mechanical Engineering
and
Nuclear Engineering
/, A
May 12, 2006
Certified
by.
... ...
Ronald G. Ballinger
k
f
Nuclear
Science and Engineering
rL _!
...-IieS:16upervisor
Accepted
n H. Lienhard V
inal rnefinparing
. '.k LP. J . .118k.L A.1q.'.J.A.L .kA.,CA. .. k. &.k.A...I.A.
Chairman, Undergraduate Thesis Committee
MASSACHUSETTS INSTITUTE. OF TECHNOLOGY
AUG 0 2 2006
The Development of Autocatalytic Structural Materials for
Use in the Sulfur-Iodine Process for the Production of
Hydrogen
by
Kevin Miu
Submitted to the Department of Nuclear Engineering and
Mechanical Engineering
on May 12, 2006, in partial fulfillment of the requirements for the degrees of Bachelor of Science in Nuclear Engineering
and
Mechanical Engineering
Abstract
The Sulfur-Iodine Cycle for the thermochemical production of hydrogen offers many benefits to traditional methods of hydrogen production. As opposed to steam methane reforming - the most prevalent method of hydrogen production today - there are no carbon dioxide emissions. Compared to other methods of hydrogen production, the efficiency of the cycle is excellent. Due to the high temperatures necessary for the cycle, which are generally greater than 8500C, several of the Generation IV nuclear reactor concepts are attractive thermal energy sources. However, the high tempera-ture and corrosive reaction conditions of the cycle, involving reactions including the decomposition of H2SO4 at 400-9000C, present formidable corrosion challenges. The
conversion of sulfuric acid to sulfur dioxide was the focus of this study. The alloying of structural materials to platinum has been proposed as a solution to this problem. A catalytic loop to test the materials was constructed. Sulfuric acid was pumped over the material at 903+20C. The sulfur dioxide production of the catalyst was measured as a means of quantifying the efficiency of the system as a function of temperature. The maximum possible production of the material was calculated by using a mass balance. A gas chromatograph was used to calculate the actual production of sulfur dioxide. The results of the experiment show that an molecular conversion efficiency of 10% is attained when operating at 900C while using 800H + 5%Pt as a catalyst. The research confirms the catalytic activity of the material.
Thesis Supervisor: Ronald G. Ballinger
Acknowledgments
I would like to acknowledge Professor Ballinger firstly, because over the last three years that I have known him, I have grown tremendously as both academically and personally. I have, and I will be forever indebted to him for his patience and mentor-ship.
I would also like to thank Pete Stahle, Jeongyoun Lim, Jeff Hixon, and Monica Ware, who spent countless days taming experimental setups, furnaces, and chemicals with me in lab. Pete has always been a supreme resource in terms of machining knowl-edge, and I am thankful for the chance to learn even a small fraction of his craft. Jeongyoun has provided invaluable help in the construction and testing of the exper-iment and knowledge about just about everything. Jeff was always willing to offer a hand whenever a specimen had to be cut or parts had to be assembled. Monica was instrumental in getting this experiment off the ground. Whether it was machining
a vital part or taking a trip to Anna's Tacqueria, all their friendship and company
were greatly helpful and valued.
Additionally, I owe much gratitude to Barbara Keesler, who helped tremendously by handling all administrative duties. She was always there when I needed a friendly
face to talk to or to discuss the latest news and sports.
Lastly, I must thank my family, without whose support, I would have never survived MIT. They have watched their brother or son grow up, and I hope to continue to honor them in the future.
Contents
1 Introduction
1.1 Motivation for Hydrogen Production ... 1.1.1 Directions in Hydrogen Production . . 1.1.2 The Nuclear-Hydrogen Initiative .... 1.2 Methods of Production ...
1.2.1 Steam Methane Reforming ... 1.2.2 Electrolysis ...
1.2.3 High Temperature Steam Electrolysis . 1.2.4 Sulfur-Iodine Cycle ... 1.2.5 Summary of Methods ... 1.3 Difficulties in Production ... 1.3.1 Thermal Considerations. 1.3.2 Structural Considerations. 1.3.3 Past Research ... 1.4 Material Selection ...
1.5 Determination of Catalytic Ability ...
2 Methodology
2.1 System Requirements ... 2.2 Loop Construction.
2.3 Reaction Vessel Design ... 2.4 Hardware Interfaces ... 2.5 Hardware Settings. 13 13 15 15 16 16 17 18 19 21 22 22 23 23 24 25
27
27 28 30 33 35...
...
...
...
...
...
...
...
...
...
...
...
...
...
...
...
...
...
...
2.6 Material Preparation ... 37 2.7 Material Installation ... 37 2.8 Chromatograph Setup ... 38 2.8.1 Chromatograph Calibration ... 40 2.8.2 Valve Timing ... 42
3 Results
43
3.1 Mass Flow Rate Analysis . . . ... 433.1.1 Mass Flow Rates at Steady State Temperature ... 44
3.1.2 Mass Flow Rates as a Function of Temperature ... 46
3.2 Gas Chromatograph Analysis ... 48
3.2.1 Gas Chromatograph Analysis During Steady State Temperature 49 3.2.2 Gas Chromatograph Analysis as a Function of Temperature . 56 3.3 Efficiency Calculations ... 59
List of Figures
1-1 Electrolysis Cycle ... 1-2 Sulfur-Iodine Cycle.
1-3 Temperature Dependence on Efficiency of the Sulfur-Iodine
2-1 2-2 2-3 2-4 2-5 2-6 2-7 2-8 2-9 2-10 2-11 2-12 2-13 2-14 Cycle Ismatech Micrometering Pump ...
Piping and Instrumentation Diagram ... Reaction Chamber, Units in Inches ... Mettler Toledo Scale ...
179A Flow Meter ...
6890N Agilent Technologies Gas Chromatograph . Dryer Connected to Compressed Air ...
Catalytic Loop ...
Flow Readout Panel ... HP Data Acquisition System ... Catalyst Sample in Reaction Vessel ... Valve Layout ...
Nitrogen Calibration Curve ... Sulfur Dioxide Calibration Curve ... 3-1 Temperature and Mass Flow Data ...
3-2 Steady State Temperature and Mass Flow Data ... 3-3 Mass Flow Data with Dynamic Temperature ...
3-4 Unaccounted Mass Flow Rate in Respect to Temperature . . . 3-5 Chromatograph Analysis at 5 Minutes of Steady State Period
18 20 . 23 28 30 31 34 34 35 35 36 36 37 38 39 40 41 44 45 47 48 49
3-6 S02 Peak at 5 Minutes of Steady State Period . ... 50
3-7 Steady State Nitrogen Mass Flow Rate Data . ... 52
3-8 Chromatograph Analysis at 25 Minutes of Steady State Period .... 54
3-9 SO2 Peak at 25 Minutes of Steady State Period . ... 54
3-10 Chromatograph Analysis at 5950C ... . 56
3-11 SO2 Peak at 595C . . . ... 57
3-12 SO2 Production ... 59
3-13 SO2 Production Efficiency ... 60
List of Tables
2.1 Fluid Constants ...
32
2.2 Integration Results of Peaks of Nitrogen Calibration . ... 40
2.3 Integration Results of Peaks of Sulfur Dioxide Calibration ... 41
2.4 Calibration Values ... 42
2.5 Valve Timing and Detection Events . ... 42
3.1 Composition of Incoloy 800H . . . .. .. 49
3.2 Integration Results of Peaks at 5 Minutes of Steady State Period ... 51
3.3 Integration Results of Peaks at 25 Minutes of Steady State Period . 55 3.4 Integration Results of Peaks at 595°C . ... 57
Chapter 1
Introduction
1.1 Motivation for Hydrogen Production
The viability of nuclear energy for hydrogen production has increased dramatically in recent years. Nuclear energy answers two major concerns of hydrogen production: climatic change due to greenhouse gases and the instability of fossil fuel supplies [1]. Generation IV nuclear reactors provide the requisite temperatures necessary for high efficiency hydrogen production using the Sulfur-Iodine Cycle; depending on the reac-tor temperature, the efficiencies can be over 60% [2]. Before nuclear energy can be deployed for large scale and long term production of hydrogen, important materials questions must be answered.
At the time of the publication of the paper, 86% of the world's energy demands were satisfied with fossil fuels [3]. The use of hydrogen is expanding as technology per-mits. In the past, hydrogen has been used extensively in the refining of petroleum and petroleum products. Hydrogen is also used to produce fertilizers and other chemicals, such as anhydrous ammonia [3]. Automobile manufacturers have made far-reaching initiatives to produce hydrogen fuel cell-driven automobiles, as these automobiles can meet performance demands and produce merely water as a byproduct.
clean burning; the combustion of hydrogen results in water. The burning of petroleum and natural gas release CO2, CO, NOT, and other undesirable greenhouse gases. In
additional to all the greenhouse gases produced from oil and natural gas, coal also releases dangerous sulfur compounds that must be trapped and converted. Coal is also not as convenient as the aforementioned energy sources for applications such as
transportation.
Liquid hydrogen also has a high gravimetric energy density of 70.8M-J, whereas gaso-line only has a energy density of 44 M [4]. The energy density of coal and alternative fuels, such as ethanol, are about half that of gasoline. An advantage in gravimetric energy density has great advantages in automobiles, as the fuel weight can be reduced.
Unfortunately, hydrogen is most often available in molecules where it is combined with other elements, such as water (H20) or methane (CH4) [4]. Since hydrogen (H2)
is not widely naturally available, it must be produced from hydrogen containing com-pounds and existing fuel sources, such as natural gas. Because of this, hydrogen is not an energy resource, but rather an energy carrier [4]. Since hydrogen is a derivative of an existing fuel, the energy stored in the hydrogen is less than the energy of the original fuel and the losses in energy can be directly attributed to inefficiencies in the production process and storage. The efficiency of hydrogen production ranges from 20% to 80% depending on the method of production [4].
Approximately 95% of the hydrogen demands in the United States are met through a process called steam methane reforming [4]. Steam methane reforming is a very efficient process, as methane reforming plants typically operate around 80% efficiency. However, the major drawback to the process is the process requires the combustion of natural gas, which is a useful fuel itself and releases greenhouse gases. The steam methane reforming alone required to meet the hydrogen needs of the United States contributed to the release of over 74 million tons of carbon dioxide in the last year. Clearly, finding a means to produce hydrogen efficiently without the negative effects
on the environment would be greatly beneficial.
1.1.1
Directions in Hydrogen Production
Hydrogen has been widely hailed as the fuel of the future. However, important de-cisions must be made in terms of utilization, storage, and production. Many of the problems have to do with scaling, as demands today are generally for industry. If the transportation industry does indeed one day rely on hydrogen, the means of produc-tion will have no choice but to change.
The necessity to use less refined energy, namely heat rather than fossil fuels or elec-tricity, to produce hydrogen is clear. In terms of efficiency, natural gas and coal should be used for the production of electricity, and electricity should be spent on the grid, not to generate hydrogen. Nuclear reactors are non-fossil fuel burning sources that can produce hydrogen at high efficiencies.
Environmental concerns must also be answered. Dozens of nations have agreed to the Kyoto protocol, under which carbon dioxide emissions must be reduced on average 5.2% in respect to 1990 levels. One way to achieve this goal is for the transportation industry to switch from hydrocarbon fuel to hydrogen. The mass adoption of hydro-gen as a transportation fuel requires nations to find alternatives to the traditional method, steam methane reforming.
1.1.2 The Nuclear-Hydrogen Initiative
Hydrogen production may be able to take a great leap with the introduction of Gen-eration IV nuclear technology. GenGen-eration IV nuclear reactors meet requisite tem-peratures for thermochemical methods of hydrogen production, which can produce hydrogen at efficiencies that have not been approached today without the release of
large amounts of CO2.
Before such methods of hydrogen production are realistic, materials must be devel-oped that can withstand both the temperatures required and the corrosive conditions present in processes used for production. The development of materials that serve both as excellent catalysts and can avoid catalytic breakdown under the thermo-chemical process will not only revolutionize hydrogen production, but it will also aid hydrogen related products and the field of alternative energy.
1.2 Methods of Production
Many processes have been developed for hydrogen production. The processes vary in terms of efficiency and reactants. It is important to understand the evolution of these processes and the different reactions involved. The proper development of materials for the Sulfur-Iodine Cycle can be aided by understanding the challenges introduced by thermochemical cycles relative to traditional methods of production.
1.2.1
Steam Methane Reforming
Steam methane reforming involves the combustion of methane to provide heat for the production reaction, which is endothermic. The first step is a reforming reaction, in which steam and methane are heated to produce hydrogen and carbon monoxide, as represented in Equation 1.1. The second step is known as a water gas shift, which is shown in Equation 1.2; the carbon monoxide produced in the reforming and steam are reacted over a catalyst to form carbon dioxide and hydrogen. Equation 1.3 shows the combined reaction.
CO + H20 CO2 H2
CH4+ 2H20 ) CO2 + 4H2 (1.3)
Steam methane reforming is a mature technology that provides good efficiency in hydrogen production. The efficiency of the reaction can reach levels as high as 80%
[4]. However, the drawback is that large amounts of CO2 are generated [5].
1.2.2 Electrolysis
The electrolysis process involves the passing of a current through water molecules to generate oxygen and hydrogen. The disadvantage of electrolysis is the requirement of electricity. Since electricity must first be produced, the efficiency of the process drops dramatically. A typical power plant today operates at around 40% efficiency [6]. Given that the process of electrolysis is at most 70% efficient, the overall efficiency of the process is approximately 25-30% [5].
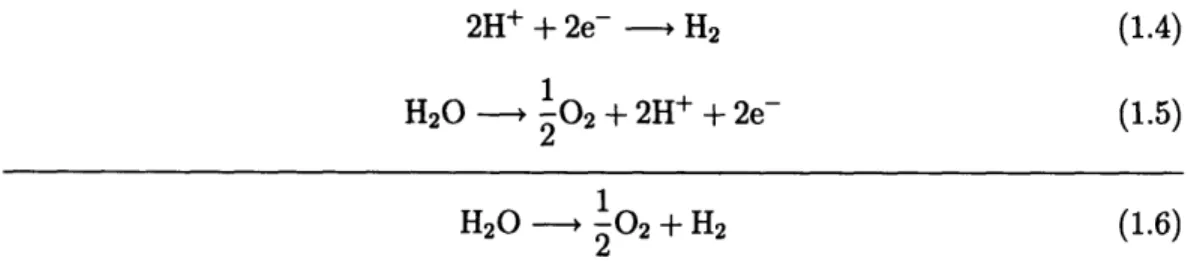
Electrolysis consists of two separate half reactions - a cathodic and an anodic one. The cathodic half reaction consists of the combination of hydrogen ions and electrons to produce hydrogen gas, as represented in Equation 1.4. The anodic half reaction involves the conversion of water into oxygen gas, hydrogen ions, and free electrons, as shown in Equation 1.5. Equation 1.6 shows the combined reaction, where water is used to produce oxygen and hydrogen.
2H+ + 2e- , H2 (1.4) 1 H20 -- 02 + 2H + 2e- (1.5) 2 1 H20 0, 02 + H2 (1.6) 2
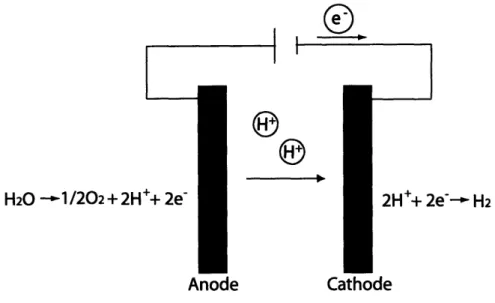
Figure 1-1 shows a theoretical layout of an electrolysis cell. The main efficiency and
cost drawbacks of traditional electrolysis are due to the high consumption of
electric-ity.
® i
H20 -1/202 + 2H++ 2e' 2H++ 2e-- H2
Anoae
Latnoae
Figure 1-1: Electrolysis Cycle
There are also environmental issues to be considered depending on the source of elec-tricity for electrolysis. If a power plant operating on traditional energy sources, such as coal or natural gas, is used to produce the electricity for electrolysis, there will be CO2 emissions. Since the electricity demands are so great, there are significant
environmental tradeoffs.
1.2.3 High Temperature Steam Electrolysis
High temperature steam electrolysis (HTSE) trades some of the energy used for elec-tricity in traditional electrolysis for heat. The addition of heat reduces the elecelec-tricity demands of the process, and the total energy necessary is less than the energy for low temperature electrolysis.
The only inefficiencies in heat transfers are due to limitations in heat exchanger tech-nology, which are minor in respect to turbine and compressor technologies. Through
(O -- 0
high temperature steam electrolysis, efficiencies of 35-40% can be achieved [5].
High temperature steam electrolysis is also well-suited for Generation IV nuclear re-actors, since they can use combined electric and steam cycles at high temperatures for the HTSE.
1.2.4
Sulfur-Iodine Cycle
The Sulfur-Iodine cycle was invented by General Atomics in the 1970s. The cycle provided great benefits compared to earlier methods of hydrogen production. With current technology, the cycle produces hydrogen at an efficiency of 47%, and by com-bining hydrogen and electricity production, efficiencies of up 52% can be achieved [4].
Like electrolysis, the only inputs necessary for hydrogen production using the Sulfur-Iodine cycle are water and heat. A molecule of water is combined with a molecule of iodine, sulfur dioxide, and another molecule of water. At 120°C, the reactants are converted to a molecule of sulfuric acid and two molecules of hydrogen iodide. The cycle diverges from this point.
The sulfuric acid is passed over a catalyst at a temperature greater than 830°C, which causes the sulfuric acid to decompose and leads to half a molecule of oxygen, and a molecule each of sulfuric acid and water. The sulfuric acid and water are returned as the reactants used initially. The oxygen is a product of the reaction.
Hydrogen iodide from earlier in the cycle is heated to form hydrogen and iodine. The iodine is used as a reactant in the first stage of the cycle discussed, and the hydrogen is the desired product of the reaction. Thus the only input into the cycle is water and heat, and the products of the reaction are oxygen and hydrogen.
The Sulfur-Iodine cycle can be summarized with the following chemical reactions:
1
H2SO4 - SO2 + H20 + -02
2
12 + SO2 + 2H20 ) 2HI + H2SO4
2HI ) 12 + H2
1
H20 ) H2 + O02
2
The cycle is displayed in Figure 1-2.
Catalyst, 830°C H2S04 H2S04 + 2HI 2HI 1/202
_-
1/202
+
120°C 320°C 12 + S02 + H20S02
+ 2H204
....
H20
12 + H2 H2Figure 1-2: Sulfur-Iodine Cycle
Clearly, the Sulfur-Iodine cycle is a desirable cycle, both in terms of environmental friendliness and high efficiencies. However, there are still many questions to be an-swered about production.
(1.7)
(1.8)
(1.9)
The conversion of sulfuric acid to sulfur dioxide, Equation 1.7 is a reaction that poses great challenges within the Sulfur-Iodine Cycle. The reaction can be broken down into two individual reactions.
H2SO4 - SO3 + H20 (1.11)
1
S03 - SO2+ -02 2 (1.12)
High temperatures and an excellent catalyst are required to facilitate this reaction, and the development and testing of materials of this reaction are the focus of this research.
1.2.5 Summary of Methods
The aforementioned cycles highlight one major development in the progression of methods of hydrogen production. The source of energy for hydrogen production has advanced towards lower quality energy sources, such that high quality, valuable sources do not have to be used in the production of an energy carrier like hydrogen. Natural gas and electricity are both high quality sources of energy. In terms of
trans-port and convenience, they are both outstanding.
Clearly, it would be preferable to produce hydrogen from other sources, and the desire for this is seen in high temperature steam electrolysis, where a great deal of electricity is substituted for heat, which is a low quality energy source. Even further along in the progression are thermochemical methods, which rely entirely on heat as an energy source. Using heat to produce hydrogen is ideal, since distributing and utilizing the heat directly for commercial applications is difficult, while converting it to electricity requires losses in energy.
1.3 Difficulties in Production
At the operating conditions of the more advanced processes, such as HTSE or the Sulfur-Iodine cycle, material, structural, and thermal questions must be answered.
The step in which sulfur dioxide is produced from sulfuric acid in the Sulfur-Iodine cycle is of great interest. The production of sulfur dioxide requires passing sulfur trioxide over a catalyst at temperatures greater than 8000C. Along with the corrosive conditions, large pressures and excellent catalytic ability lead to additional require-ments. The supply of heat to the Sulfur-Iodine Cycle will require the presence of an interface between the energy or heat producer and the process itself. This interface will likely take the form of a heat exchanger. The required operating temperature of the heat exchanger will be at least 8000C. The energy transferred will then be used for the process-which will require a catalyst. If a heat exchanger that could serve both heat exchange and catalytic functions could be developed, the process could be simplified considerably. The work in this thesis addresses the development of such a heat exchanger.
1.3.1 Thermal Considerations
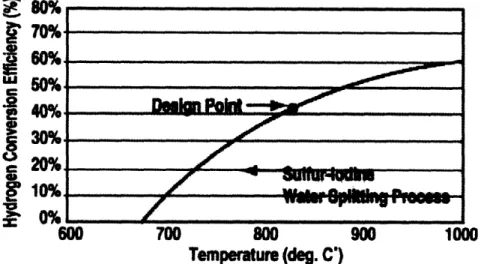
The efficiency of the Sulfur-Iodine Cycle is highly dependent on temperature [2]. For the cycle to be desirable relative to electrolysis, the minimum operating temperature of the cycle should be approximately 800C. Current plans for Generation IV reactors should be able to produce efficiencies in the 50% range, which is already excellent. Future advances in reactor technology may be able to accommodate even higher tem-peratures, and the cycle efficiency could eventually approach 60%.
Concerns arise because of the high operating temperatures. The corrosive environ-ment created due to the presence of sulfuric acid and other decomposition products is only augmented by the temperature. The catalytic material must be able to maintain
E
%
70% 640%g
10% 20% 600 700 800 900 1000 Temperature (deg. C')Figure 1-3: Temperature Dependence on Efficiency of the Sulfur-Iodine Cycle
(Source: [2])
catalytic ability in the long run.
1.3.2 Structural Considerations
Because of the application in a nuclear reactor and the exposure to the highest tem-peratures exiting the reactor, the heat exchanger almost will certainly ultimately be exposed to gas at the maximum operating temperature and pressure of the reactor. In terms of Generation IV reactors, this pressure will likely be in the range of 7 MPa, so the material must meet pressure code specifications for high pressures.
1.3.3 Past Research
Studies have been performed on the catalyst stability of platinized A1203, TIO02, and
ZrO2. [7] Platinum concentrations of 0.1% by weight and 1% by weight were used.
The platinum-coated ZrO2 resulted in the greatest SO2production, however,
regard-less of the platinum concentration, the materials suffered extreme deterioration [7]. The sulfuric acid penetrated the platinum layer and lead to catalyst deactivation and
break down [7].
1.4 Material Selection
The catalytic material will be used as a heat exchanger material in the future for the Sulfur-Iodine cycle. Material properties that result in a good heat exchanger are also desirable.
Platinum is inert so it is not susceptible to the effects of corrosion. Due to cost, ther-mal, and structural considerations, pure platinum is not an optimal choice. Platinum is often used as a coating for other alloys, which drastically reduces the amount of platinum that is required [7].
However, even coated materials have shown poor stability in the presence of high temperature sulfuric acid [7]. At temperatures of greater than 800°, there are kinet-ics that result in the exposure of the underlying alloys.
Because the underlying material contains no platinum, it has no defense to the high temperature sulfuric acid. A reasonable consideration would be to add platinum to the underlying material. Adding a large amount of platinum is not desirable for the reasons discussed earlier, but the platinum could be alloyed with other metals.
Incoloy 617 and 800H are superalloys with excellent oxidation resistance at high temperatures. The oxidation resistance of both of the materials is enhanced by the addition of aluminum. These materials are widely used in turbines, superheaters, and furnaces, so in terms of a corrosion and temperature perspective, they are excellent.
In this thesis alloys with the base composition of Incoloy 617 and 800H have been alloyed with small amounts of platinum. The initial evaluation of the performance of
these materials as catalysts is the subject of this thesis.
1.5 Determination of Catalytic Ability
The most straightforward means to characterize the catalytic ability of the alloys developed is to utilize the alloys in the Sulfur-Iodine cycle. Sulfuric acid could be heated up to reactor conditions and passed over the catalyst. The resulting sulfur dioxide produced can be measured, and the catalytic ability of the material can be determined.
The testing of the material in this manner requires the construction of a loop that is capable of reaching reaction conditions. The catalytic ability and the alloy stability in the environment can then be directly determined.
Chapter 2
Methodology
2.1 System Requirements
The main requirement of the system is the ability to provide reaction conditions necessary for the catalysis of sulfuric acid to sulfur dioxide. The first step is the decomposition of sulfuric acid into sulfur trioxide and water, which is represented by Equation 1.11 and presented once again below.
H2SO4 - SO3+ H20
Prior to this reaction, the vaporization of the liquid sulfuric acid, the decomposition into sulfur trioxide, and temperatures of 340°C are necessary. Precautions should be taken in limiting the mass flow rates, as the high temperatures require the quick vaporization of the sulfuric acid.
The decomposition must be accomplished sufficiently prior to the interaction with the catalyst, as appreciable reduction of the sulfur trioxide represented by Equation 1.12 requires temperatures at or above 800°C, which is presented once again below.
1
Once the reduction of sulfur trioxide is catalyzed, the sulfur dioxide concentration of the exit stream must be measured. Because of the harmful nature of sulfur trioxide, any remaining sulfur trioxide should be converted back to sulfuric acid by cooling in the presence of water. The sulfur dioxide and oxygen produced should remain in the
system and then can be quantified.
2.2 Loop Construction
Figures (2-1)-(2-8) show the system and its components. Sulfuric acid (96% by weight in water) is pumped through teflon tubing from an Erlenmeyer Flask at ambient pres-sure using an Ismatech micrometering pump. A micrometering pump is used to slowly pump the sulfuric acid in order to limit the overall flow rate to enhance residence time and limit the magnitude of the pressure spikes due to the expansion from fluid to va-por. At the entry to the peristaltic metering pump, the telfon tubing is connected to viton tubing, which can withstand over 100 hours of the compression due to the peristaltic action and the corrosive nature of the sulfuric acid. The sulfuric acid reen-ters a network of teflon tubing and passes through a check valve before entering the sample chamber and the furnace as to ensure no back-flow from the vaporization of the sulfuric acid and subsequent pressure increase.
The sulfuric acid decomposes into water and sulfur trioxide at 3400C in the furnace.
The gaseous sulfur trioxide continues to heat up until it reaches 9000C. Afterwards,
the sulfur trioxide passes over the catalyst, and the reaction to form sulfur dioxide may be catalyzed.
Sulfur dioxide, sulfur trioxide, water, and oxygen then leave the reaction vessel and are cooled. Any uncatalyzed sulfur trioxide then joins with a molecule of water to reform sulfuric acid once the temperature drops below the decomposition tempera-ture. Since water is in excess, the remaining sulfur trioxide should combine with it, condense, and collect in an Erlenmeyer flask at the outlet. The excess water also condenses and collects in the outlet flask. The product stream should only contain sulfur dioxide and oxygen at this point. Nevertheless, the stream is passed through a second collection Erlenmeyer Flask in case there is still sulfur trioxide and water in the stream. A check valve separates the first and second collection Erlenmeyer flasks to prevent back-flow.
Inside the second Erlenmeyer flask, nitrogen is added to serve as a reference such that the sulfur dioxide concentration in the exit stream can be quantified in the gas chromatograph. The product gas stream then passes through another check valve, and finally enters the gas chromatograph.
Micrometering
Pump
S03+SO2+
Figure 2-2: Piping and Instrumentation Diagram
2.3 Reaction Vessel Design
The sulfuric acid must properly heat up such that it boils, decomposes, and reaches a temperature of greater than 850° prior to reaching the catalyst. The necessary pre-heating makes the addition of a preheat loop to the reaction vessel favorable, as such a loop will allow the reactants to reach the proper temperature, along with isolating the violent expansions the liquid sulfuric acid to the gaseous sulfur trioxide and water vapor from the catalytic reaction. Figure 2-3 shows the completed reaction chamber.
I - 1 -
--
r -- -- -- -- -- -- -- -- -- -- -- -- -- -- -- ---- r--I .l11 U i.1i.I I I _ r.c.. --i4Figure 2-3: Reaction Chamber, Units in Inches
Additionally, the temperature of the gas at the outlet of the reaction vessel was re-quired to stay within the bounds of approximately 100°. Due to the 190°C melting temperature of the following teflon tubing and fittings, maintaining a subsequent system temperature of significantly less than melting temperature was necessary to ensure no compromise of the integrity of the tubing.
The furnace placed a limit of 1.5" on the entire diameter of the reaction vessel. The furnace had a length of 14.5" with a heating length of 11", so there was a constraint on the maximum heated area possible.
The first consideration was to maximize the length over which the sulfuric acid is heated. The entire 11" heated region was used for a " OD preheating tube. The end of the tube looped around in a semicircle and then expanded into a " OD.
To ensure that the surrounding teflon tubing remained well below the melting tem-perature, the reaction vessel was extended 6 inches from the inlet of the tubing into the reaction vessel. Factoring in the insulation of the system, this distance was sig-nificantly more than necessary to maintain near ambient temperatures.
Additional calculations were necessary for the outlet end to ensure that the mass flow of the product stream could not cause enough of a heat transfer such that the tubing
11, .-.. . \ W t 11 I I -, i ' J E-4 ---1_1 g_.' ; .... = i... b'! I i I I 17F ! I II I ..-I
could eventually reach the melting temperature. Complicating the calculation was the condensation of components in the product stream. Equation 2.1 represents the minimum and averaged heat transfer coefficient for the product stream.
4 4-(g h
f
p (P - P)kS 3¼ hav= hL= -( )4 (2.1) 3 3 4pLATTha,, = 0.
943(hfgP(pT)k
ptLATThe convective heat transfer coefficient can be found by simply inputting all the constant terms. The mean of the expected minimum and maximum constants was used as an approximation for many of the values.
Term Value g 9.81 m hfg,min 0 hfg,max 2256k hfg 11283 Pmin 322 kg Pmaz 1797.3 k3 P 1059.7 Pv,min 0.59817m Pv,maz 322 -Pv 161.299 k kf,min 0.42504 kf,max 0.67909 kf 0.55207.
A/min 5.2069E-05 N7ec
/max 2.8174E-04 c
P 1.6690E-04 me
AT 800°C
R 0.18in
Table 2.1: Fluid Constants
T -Tb,out
e-
2Rh Ln =
e
cpgh rRo.943( P(P-Pv)k3' 293 - 373 -"R -_¼"4__'_' _) Li = e mhcp 293- 1223
m = .029
cp = 24.02kgK
L = 7.018cm
The calculation reveals that only a few inches are necessary to cool the fluid to tem-peratures comfortably within the operating range of the teflon. For precautionary purposes, the outlet length was expanded to 10 inches in the case operating flows were increased.
The reaction chamber was made out of quartz, which has a melting temperature of 1600°C, which is comfortably greater than the maximum system temperatures.
2.4 Hardware Interfaces
One 0-5 kg range Mettler Toledo balance was placed below each of the inlet and outlet Erlenmeyer flasks, as shown in Figure 2-4. The sides of the scales were lined with
cardboard to limit the variance in the scale readout due to thermal convection and
Figure 2-4: Mettler Toledo Scale
One 1179A mass flow controller and one 179A mass flow meter from MKS Instruments were used, as shown in Figure 2-5. The mass flow controller was placed immediately after the bottle of nitrogen reference gas in order to measure and control the flow for later quantification of the sulfur dioxide. The mass flow meter was placed at the exit of the second collection bottle. It was used to measure the total flow entering the chromatograph. The second mass flow meter aided the detection of appreciable changes in mass flow and the tracking of gas flow in respect to the known flow exiting the mass flow controller prior to sampling by the chromatograph.
The chromatograph was a 6890N model made by Agilent Technologies, as shown in Figure 2-6. The chromatograph required three separate gas lines. The first line was a compressed air line for the air-actuated valves. A dryer, as shown in Figure 2-7 was connected to the input air line to prevent condensation of liquid inside the actuators. The two other lines were reference and carrier gas lines. Helium gas at 50 psi was connected to both of these lines. Because of the use of helium as a referemce, any helium passing through the chromatograph would not be detected.
Figure 2-6: 6890N Agilent Technologies Gas Chromatograph
Figure 2-7: Dryer Connected to Compressed Air
The final catalytic loop is shown in Figure 2-8.
2.5 Hardware Settings
The two electronic balances were manually set to output in floating point format and be accessible to remote transfers from the settings menu. A Keyspan 4 port serial interface was used to link the scales to the data acquisition system. The data is trans-fer is begun with a command of a "SIR" and a carriage return and line feed, which
Figure 2-8: Catalytic Loop
wait until measurements stabilized, as the masses in the inlet and collection bottles were expected to be constantly changing. A MSComm interface in Visual Basic was
used to interpret the system interrupts.
The mass flow controller was calibrated to 20,000 sccm of nitogren. The mass flow meter was calibrated to 30,000 sccm of helium, but the scale factor led to an equiv-alent range of 0-20,000 sccm of nitrogen. The two mass flow meters were connected to an MKS display, and a 25-pin D-connector was used to read the signals from the mass flow meters. A HP3852 Data Acquisition Unit and a voltmeter module were used to read the voltages from the mass flow meter and controller. The voltages were 0-5V full scale, and the conversion between voltages and the mass flow readout was
Figure 2-9: Flow Readout Panel
Figure 2-10: HP Data Acquisition System
The system was set to call for temperature readings, mass readings, and mass flow readings every second. Data was exported to a text file. MATLAB was used for data
interpretation.
2.6 Material Preparation
Each of the samples, 2, 5, 15, and 30 % Pt in 600 or 800H, were rolled to .0023". The samples were annealed in hydrogen-rich environment, and they were finished with a cold roll.
The samples were lightly finished to remove surface oxides. Hand grinding was per-formed with 600 grit silicon carbide paper in a wet environment. Grinding continued until all visible oxide was removed.
The samples were then cut to strips. Creases were folded into the strips to facilitate packing into the reaction vessel.
2.7 Material Installation
The tapered section of the outlet of the reaction vessels were cut at the point when the reaction vessel expanded to ". Samples were loosely packed into a 3.5" segmentthe ractio vessl expnded o ~4
of reaction vessel to ensure a large amount of catalytic surface relative to the reaction vessel volume in he region. The sample vessel was then resealed.
Figure 2-11: Catalyst Sample in Reaction Vessel
2.8 Chromatograph Setup
The chromatograph was equipped with a packed inlet flow source, a 6-port gas
sam-pling valve (valve 1), and a 6-port column isolation valve (valve 2). A Porapak N
column was installed as the first column, onto which valve 1 enables flow. A Molecular Sieve Column was installed on as the second column, or isolation column. Flow onto the isolation column is normally open when valve 2 is closed. Turning on the second valve isolates column two from the sampling mechanism, or thermal conductivity de-tector (TCD). Returning the second valve to the off position allows for sampling of the gases that were isolated. Figure 2-12 shows a layout of the valves.
Figure 2-12: Valve Layout
The gas stream was expected to contain nitrogen, oxygen, and sulfur dioxide as its main constituents. When the first valve is enabled, the oxygen and nitrogen pass im-mediately over the Porapak N column and into the Molecular Sieve Column. By then turning on valve 2, the nitrogen and oxygen are isolated from detection. During this period, the sulfur dioxide flows through the Porapak N column and into the detector.
Once the sulfur dioxide has been detected, valve 2 is turned off. The oxygen and nitrogen elute into the TCD and are detected. Afterwards, the temperature of the gas chromatograph was ramped up to allow any remaining gas in the sample line to bake out.
The detection of the gases is time based, so the time of isolation and elution are absolutely necessary in proper measurement. At the beginning of the measurement,
valve 1 was turned on. The time allowed for the oxygen and nitrogen elution was set at 0.8 minutes as recommended by Agilent Technologies. The second valve was turned not turned off until 3 minutes into the detection, which allowed ample time for loading the sample valve and elution of the sulfur dioxide into the detector. After the second valve was turned off, the oxygen and nitrogen would elute into the detector.
2.8.1 Chromatograph Calibration
The chromatograph was calibrated with nitrogen, oxygen, and sulfur dioxide. Ini-tially, nitrogen was pumped into the system. The nitrogen calibration curve is dis-played in Figure 2-13. The analysis of the nitrogen sample yielded only one significant peak, as expected.
25uV. ·
1 2 3 4 5 6 7 min
Figure 2-13: Nitrogen Calibration Curve
Integrating the peaks of the chromatograph analysis produced the results shown in Table 2.2.
Peak Time Area Height Width Area % Symmetry
1 9.968E-2 35.2 8.8 0.0626 0.046 0.975 2 0.814 222.6 19.5 0.137 0.290 0.245 3 3.019 50.3 28.9 0.0303 0.065 0.7 4 3.809 56.6 12.5 0.0707 0.074 0.902 5 3.957 76460.1 11023.1 0.1049 99.508 0.268 6 4.74 13.5 1.9 0.1123 0.018 0.556
The nitrogen displayed one main peak at about 3.9 seconds. The signal resulting in peak 2 and peak 3 were from the firing of valves. The signal at peak 4 was dependent on the amount of air in the sample stream prior to sampling. Depending on the air initially in the sampling volume, a second peak at about 3.8 seconds also appeared. Because of the concentration of gases in air, the only feasible source of the peak was oxygen.
A gas mixture of 5% sulfur dioxide in helium was used for calibration of the sulfur dioxide peak. Since the reference and carrier gas used by the chromatograph system was helium, the helium inside the gas mixture was undetected. The results of the analysis are shown in Figure 2-14.
25iuV 140 130 120 110 100 90 80 70 60 50 1 2 3 4 5 6 7 min
Figure 2-14: Sulfur Dioxide Calibration Curve
There were relatively few integration events of concern for the sulfur dioxide
calibra-tion. The results of the integration are shown in Table 2.3.
Peak Time Area Height Width Area % Symmetry
1 1.798 7 1.8 0.0587 1.724 0.747
2 2.035 388.2 88.8 0.067 95.586 0.715
3 2.745 10.9 1.7 0.0987 2.689 0.702
Table 2.3: Integration Results of Peaks of Sulfur Dioxide Calibration
Table 2.4 shows the approximate times at which the gas peaks were expected to ap-pear based on settings used in calibration. The times differed slightly in respect to
the original calibration tests because of the presence of the gases together as a single sample.
Time(min) Detection Event
2.0 3.7 3.9 Table 2.4: SO2 02 N2 Calibration Values
2.8.2
Valve Timing
After measuring approximate peak times, the valve timing was set as described in Table 2.5. The table shows the valve switching, and the expected location of the gases at each significant change in the system settings. Since the oxygen and nitrogen are to be isolated in the Molecular Sieve column, they are detected after the sulfur dioxide.
Valve 1 State
I
Valve 2 State2.5:
OFF
OFF
ON ONOFF
OFF
OFF
OFF
Valve Timing Porapak N Gases NONE SO2 SO2 NONE NONE NONE NONE NONE and Detection Molecular Sieve Gases NONE N2 & 02 N2 & 02 N2 & 02 N2 & 02 N2 NONE NONE EventsThe operation of the cycle from 0.00 minutes to 7.00 minutes was performed at 80°C. After the 7 minute mark, the temperature was ramped up to 120°C to bake out any trapped gases remaining in the columns. The baking was performed to clean the columns for subsequent runs.
Time(min) 0.00 0.01 0.80 2.0 3.00 3.7 3.9 7.00 OFF ON ON ON ON ON ON OFF Table Detector Gases NONE NONE NONE SO2 NONE 02 N2 NONE - . _ _
Chapter 3
Results
3.1 Mass Flow Rate Analysis
A reaction vessel packed with the rolled and cut samples of 800H + 5% platinum was examined. Sulfuric acid was pumped through the loop until it reached the entry
point of the reaction vessel. The furnace was then turned on and heated until
reach-ing the final steady state temperature. As the temperature was raised, the sulfuric
acid was pumped and decomposed through the reaction chamber until the desired
temperatures were reached. Upon reaching the steady state temperature, the system
was allowed to run at steady state for 0.69 hours.
The mass of the inlet vessel containing the sulfuric acid and the outlet collection ves-sel were monitored throughout the course of the experiment. Two separate analyses of the product gas stream were performed during the steady state period. Mass flow controllers were used to control and monitor the flow of the nitrogen used as a refer-ence and carrier gas for the chromatograph analysis. The temperature and mass flow data are represented in Figure 3-1. Following the data collection, the reaction vessel was slowly cooled. The micrometering pump remained on and all data collection continued for another 3 hours.
Temperature
2000 4000 6000 8000 10000 12000
Time(s) Scale Mass Balance
14000 16000 18000
-200
0 2000 4000 6000 8000 10000 12000 14000 16000 18000
Time(s)
Figure 3-1: Temperature and Mass Flow Data
Data points for temperature, mass in the inlet and collection vessels, and mass flows were recorded every second for a period of 4.5 hours. Steady state temperature was reached once the operating temperature was within 5°C of the desired operating tem-perature of 903°C.
3.1.1 Mass Flow Rates at Steady State Temperature
The system reached a steady state temperature of 903±1.9C at 0.97 hours into the
experiment. Prior to reaching steady state, there were significant pressure gradients in the system due to the boiling and decomposition of the sulfuric acid and the pres-surization of the air in the loop. The fluctuations are evident by the initial mass decrease in the outlet vessel in Figure 3-1. Once steady state was reached, the mass
1 UU 80 60 40 20
0
Q-a 0 0. E a,I-600 400 l m
:
200 ---A Mass In Mass Out - - I - - -1 - IIIIII '~~~~~~~~~~~~~~~~~~~~~~~~~~~~~~~~~~~~~~~~~~~~~~~~~~~~...II
flows linearized. The temperature and the mass during the steady state period are shown in Figure 3-2. 910 905 900 3500 rin ouu 400 200 O n1' 3500
Steady State Temperature --- ....
4000
4000
4500 5000
Time(s)
Steady State Scale Mass Balance
4500 5000
5500
5500
Time(s)
Figure 3-2: Steady State Temperature and Mass Flow Data 6000
6000
Least squares analysis revealed the mass within the vessel containing the sulfuric acid was -0.01159t + 0.18391 g during the period of steady state temperature. The linear least squares model of the mass of the outlet collection vessel was 0.00927t + 437.65 g. The corresponding inlet and outlet mass flow rates were then -0.01159 and 0.00927
i respectively. The difference in the mass flow rate of the inlet and outlet collection
vessels, 0.0023 can be accounted for by the ideal reduction of SO3. According to
equation 1.12, half a mole of oxygen is produced for every mole of SO2 produced in
the reduction of sulfur trioxide.
a, 2a 0. E I-E
2
I - -- ___- u, l,0Wb co * Mass In, -0.01159t+0.18391 * Mass Out, 0.00927t+437.65 I i -rrr r r · · · rr · r r r · · MU-h , nne _- lSO3 - SO2 + 202
Correspondingly, for every 16 grams of oxygen produced, there are 64 grams of SO2
produced. Thus 20% of the product mass can be attributed to 02 production, while
the other 80% is attributed to SO2 production. Under ideal conditions where no
cor-rosion products contribute to the difference in flow rate, the entire difference is due to the product mass. Knowing this, the ideal mass flow rate of the SO2 produced is
.0018 a.
3.1.2 Mass Flow Rates as a Function of Temperature
The period during which the furnace was turned off and the furnace temperature decreased provided interesting time based data. Since the data of the temperature as a function of time is present, the optimal catalytic activity of the system as a function of time can also be calculated. The temperature and mass curves are shown in Figure
1
o
q.,e
a)a
E a) Q. 600 {33 U3 U3C, Cu co 400 200 0 -200 60 Temperature 00 Time(s)Scale Mass Balance
)00 6500 7000 7500
Time(s)
8000 8500 9000
Figure 3-3: Mass Flow Data with Dynamic Temperature
The mass into the system occurs at the same rate as for the steady state period,
because the micrometering pump operates independently of the rest of the system. The mass collected in the outlet flask accumulated at a dynamic rate because the temperature of the system was changing, and thus it was expected that the sulfur dioxide production would change as the temperature changed.
Performing the same calculations as in Section 3.1.1 and then curve fits, Figure 3-4 is found. The production at the steady state temperature varied slightly from the earlier
calculations, as the original steady state temperature had a variance of ±1.9°C.
* Mass In, -0.01159t+0.18391
Mass Out, 439.95392e 19 19 1 E - 51
1.00 1.6 1.55 Z 1.5 0) IV 1.45 a: 2 1.4 1.35 1.3 1 r
X 10- 3 Unaccounted Mass Rate as a Function of Temperature
500 550 600 650 700 750 800 850 900 950
Temperature eC)
Figure 3-4: Unaccounted Mass Flow Rate in Respect to Temperature
The plot displays the mass flow rate difference as a function of temperature. Note that the mass flow rate at the maximum temperature of the experiment is slightly less than 1.8 x 10⁻³ predicted early due to the aforementioned variance during the steady
state. The maximum possible production decreases as the temperature decreases.
3.2
Gas Chromatograph Analysis
The insufficiencies in the calculation of the SO2 production using the difference in
mass flow rates lie in the formation of corrosion products. The general composition of Incoloy 800H is described in Table 3.1.
Because of expected oxide and sulfide formation, the mass flow rate difference is not entirely due to the formation of the desired products. The idealized calculations of
Element Relative Amount (%) Nickel 30.0-35.0 Chromium 19.0-23.0 Iron 39.5 minimum Carbon 0.05 - 0.10 Aluminum 0.15 - 0.60
Titanium
0.15 - 0.60
Table 3.1: Composition of Incoloy 800H
SO2 production can have significant error. A more accurate means of confirming and
quantifying the SO2 produced is to directly detect and measure the SO2 using a gas
chromatograph.
3.2.1
Gas Chromatograph Analysis During Steady State
Tem-perature
The Agilent Technologies G1540N 6890 gas chromatograph was used to detect the SO2 catalyzed. Five minutes after the system loop reached steady state temperature,
a 0.5 cm3 sample injection was made into the gas chromatograph. The time-based peaks detected in the injection are shown in Figure 3-5.
25uV 12000 10000 8000 6000 .ooi 4000 2000 0 2 3 3 4 2 3 4 6 7 min
Figure 3-5: Chromatograph Analysis at 5 Minutes of Steady State Period Figure 3-5 shows the expected nitrogen peak at 3.88 seconds. There is a large peak
7
at approximately 0.8s that is not a result of expected gases. The peak is due to a false positive in the signal detection due to the firing of valve 2. Although that false peak is large relative to the other peaks in the sample, it does not have bearing on the integrity of the data since the other signals are measured relative to each other.
Using the enhanced autointegration feature within Chemstation, the SO2peaking at
2.04 seconds is detected. The SO2 peak is evident upon magnification of the 2.04
second point. There is a clear peak in the signal, which is represented by the blue line in Figure 3-6, over the background signal, which is represented in purple.
-)c.%1 Lvuv 140 120 100- 80- 60- 40-2
.-
~---. . . *_---~- _~_~ 1.90 1.95 2.00 2.05 2.10 2.15 2.20 2.25 2.30 minFigure 3-6: SO2 Peak at 5 Minutes of Steady State Period
The enhanced integrator in the Chemstation software was also used to calculate the peak times and characteristics. The results of the integration are provided in Table
3.2.
Notable in the integrated values is the correlation of the SO2 and N2 peaks with the
original calibrated peaks. The nitrogen peak is significantly larger than the SO2 peak,
but the magnitude difference was expected, as to get appreciable flow through the gas regulator, a significant pressure was required, and even the minimum levels of the mass flow controller were on the order of a few hundred "--. These factors resulted inthe nitrogen many detected to be orders greater than the SO2 detected. The relative the nitrogen detected to be many orders greater than the SO2 detected. The relative
k Time Area 0.846 37762.2 2.035 99.6 2.521 47 3.02 315.4 3.712 12059.3 3.882 60488.3 6.044 5298.5 Integration Results Height 13647.6 9.1 5.6 134.3 2624.2 9559.1 53.7 of Peaks
Width
0.0413 0.1333 0.1083 0.0304 0.0696 0.0948 1.1548Area %
32.534 0.086 0.041 0.272 10.390 52.113 4.565 Symmetry .392 0.829 0.915 0.18 0.692 0.185 0.641at 5 Minutes of Steady State Period
percentage of the nitrogen to the relative percentage of the sulfur dioxide, coupled with the known flow rate of the nitrogen can be used in Equation 3.1 to find the mass flow rate of the sulfur dioxide.
* so2Aso2
SO2 = PN2VN2 %N AN 2
-ON2 AN2 (3.1)
The density of the nitrogen at standard temperature and 10 psi is 1.9458 kg. The
flow rate recorded is 569±7 -.
The flow rate during the steady state temperature
is shown in Figure 3-7. Pea] 1 2 3 4 5 6 7 Table 3.2: . R - -_ _
Mass Flow (Gas) 1300 1200 1100 - 1000 E 900 - 800 700 600
Controlled Gas Flow
- Measured Total Mass Flow
500 1 . , I , "I I I
3500 4000 4500 5000 5500 6000
Time(s)
Figure 3-7: Steady State Nitrogen Mass Flow Rate Data
kg
cm
3
0.086 6415
rhso = 1.9458 x 569-
x
--- = 7.034 x
10
m3 min 52.113 28 s
Clearly, this value is significantly lower than the maximum production. Possible ex-planations for the low value found under the current analysis may lie in the presence of the oxygen in the system. Some of the oxygen in the system is due to the product formation during the reduction of the sulfur trioxide, however, as mentioned earlier, the oxygen levels should be lower than the sulfur dioxide levels. An explanation for the high oxygen levels may be due to air that had been in the system or had been pumped into the loop.
The oxygen introduced by the presence of air can be easily corrected for, as the oxy-gen due to the reduction of the sulfur trioxide is simply half the molar amount of the SO2. The rest of the oxygen can be assumed to be due to the presence of air, and a
corresponding amount of nitrogen due to air can also be found.
-1
Areao 2 from SO - Area%so2 = 0.043
Area%o0 from air = Area%o2- Area%o2 from SO3 = 10.344
Area%N from air = Aea from air N2 in air = 1 0 .089476
Area%N2 from reference = Area%N2- Area%N2 from air = 13.555
Now that the actual relative amount of nitrogen in from the reference gas has been found, the original calculation for the SO2 mass rate can be recalculated.
k cm3 0.086 64 -49
rhso2 = 1.9458 x 569- x
3 55x
- = 2.676 x 10 -4m3 min 13.555 28 s
The corrected value is approximately an order of magnitude lower than the maximum production.
A second gas sample was analyzed by the chromatograph at the 25 minute mark of the steady state period. Figure 3-8 shows the time based analysis of the sample. The valve switching did not create a peak of the same magnitude as earlier, thus there is only minor peaking at the 0.8 second mark.
6 12 3 4 ,+O- · . * I.... 2 3 8 4 6 mln
Figure 3-8: Chromatograph Analysis at 25 Minutes of Steady State Period The presence of the SO2 peak is once again confirmed upon closer inspection. Peak
2 represented in Figure 3-9 occurs at 2.04 seconds. Because the opening of valve 2 created much less of a signal in this sample, the background baseline is more level
than the earlier run.
3
1.95 2.00 2.05 2.10 2.15 min
Figure 3-9: SO2 Peak at 25 Minutes of Steady State Period
Table 3.3 displays the integration results obtained by using the enhanced integrator feature in the Chemstation software. The earlier analysis used to obtain the mass flow rates of the SO2 from the comparision of the SO2 and the N2signals can be used
again for this case.
10000- 8000- 6000-4000. 2000. 0 25UV 275 250 225' 200 175' 150 125 100 75' -I-c-*-·---·-c--·*--·--·r·---c-- - -,--·T---c-1---T---,----c---- -- -snr - · · · - - -VA-.1 5 1 5
Time Area Height 0.811 12.9 21.7 0.849 880.9 112.1 2.04 77.7 7.6 2.525 21.1 2.5 3.02 177.7 109.4 3.721 4064.3 921.1 3.878 67208.4 10436.7 6.058 3815.8 40
Integration Results of Peaks
Width
Area % Symmetry
9.8913E-3 0.017 0.568 0.1046 1.155 0.177 0.1226 0.102 0.969 0.1066 0.028 0.674 0.022 0.233 0.288 0.0665 5.330 0.803 0.0971 88.132 0.167 1.1193 5.004 0.694
at 25 Minutes of Steady State Period
%SO2 Aso02 Mrso2 = PN2VN2 % 2 A 2 %N2 AN2 cm3 0.102 64-59 rhso2 = 1.9458 x 569- x
88----2
x - 4.933 x 10 m3 min 88.132 28 sAgain, it is necessary to account for the air or else risk grossly underestimating the sulfur dioxide produced. As expected, the amount of air in the system, which can be roughly estimated from the absolute area of the oxygen peak, is less than the earlier run, as the reference gas and the reduction products have continued to fill the collec-tion vessels while the percentage of the air in the colleccollec-tion vessel should generally decrease over time.
1
Area%0 from SO3 Area%so = 0.051
Area%o2 from air = Area%0 2- Area%o2 from SO3 = 5.279
Area% N2
from air = Area%N2
airinfrom
=5.279
x7084
=19.678
2 a from % ir 02 in air 20.9476 Peak 1 2 3 4 5 6 7 8 Table 3.3: IArea%N2 from reference = Area%N2 - Area%N2 from air = 68.454
Now that the actual relative amount of nitrogen in from the reference gas has been found, the original calculation for the SO2 mass rate can be recalculated.
Cg m3 0.102 64-59
rhso2
=1.9458
x 569-
x 68.4 x -
= 6.285 x 1
M3 min 68.454 28 s
Averaging the two steady state results, the steady state production of sulfur dioxide is 9.208E-5±0.0001.
3.2.2 Gas Chromatograph Analysis as a Function of
Temper-ature
The time dependent analysis used earlier for the mass balances can be performed for the chromatograph samples also. A sample was taken when the temperature of the system was 5950C. Figure 3-10 shows the peak analysis of the sample.
25uV 10000 8000 6000 4000 2000 0 1 2 2 4 6 7 min 3
A clear sulfur dioxide peak is present, although it is small due to the low operat-ing temperature. Figure 3-11 shows the presence of the peak at 2.03 seconds, which has been the characteristic time of the sulfur dioxide peak throughout the experiment.
25UV 200-180 160- 140- 120- 100- 80- 60- 40-2
~~~~~~~~~~~~..
. . - - -- - - - -__ _ .- -- -- -- -- -.-. _ - - .- . .. . .... ... .. 1.95 2.00 2.05 2.10 2.15 2.20 min Figure 3-11: SO2 Peak at 595°CThe autointegration feature in Chemstation was used to produce the results in Table 3.4. The sulfur dioxide peak is relatively smaller than earlier, which was expected due to the low operating temperature. Note the continued decrease of the oxygen peak from earlier runs. The decrease was earlier predicted as the air in the sample loop exited the system due to the mass flow of the exit stream and the nitrogen.
Peak Time Area Height Width Area % Symmetry
1 0.851 743.7 105.5 0.0962 1.014 0.181 2 2.032 25.3 4.2 0.1251 0.035 3.645 3 2.531 9.5 1.3 0.1175 0.013 1.06 4 3.025 129.3 71.8 0.029 0.176 0.348 5 3.724 2721.7 601 0.0708 3.711 0.949 6 3.89 67228.4 10109.4 0.0996 91.674 0.286 7 6.036 2476.1 27.1 1.0899 3.376 0.656
Table 3.4: Integration Results of Peaks at 595°C
Performing the same exact analysis as earlier, the mass flow rate of the sulfur dioxide production can be calculated.
%s02 ASo0 2
mso2 = PN2VN2 %2 A 2
%N2 AN2
Area%02 from SO3 = 1Area%so2 = 0.0175
Area%o02 from air = Area% 2- Area%o2 from SOs = 3.694
%N2 in air = 3.694 x = 19.678
Area%N2 from air = Area%o2 from air in ir =0 694 20.9476
Area%N2
from reference
= Area%N2- Area%N2from air
=77.906
kg cm3 0.035 6415
mso0 2 = 1.9458 x 575- x
77-90
= 1.895 x 10-m3 min 77.906 28The production at 5950C can be plotted on a curve with the production at steady state, and a production curve can be extrapolated. Figure 3-12 shows the maximum production possible, which was derived from the difference in mass flow rates found from the mass balance.