HAL Id: hal-00742633
https://hal.archives-ouvertes.fr/hal-00742633
Submitted on 16 Oct 2012
HAL is a multi-disciplinary open access
archive for the deposit and dissemination of
sci-entific research documents, whether they are
pub-lished or not. The documents may come from
teaching and research institutions in France or
abroad, or from public or private research centers.
L’archive ouverte pluridisciplinaire HAL, est
destinée au dépôt et à la diffusion de documents
scientifiques de niveau recherche, publiés ou non,
émanant des établissements d’enseignement et de
recherche français ou étrangers, des laboratoires
publics ou privés.
Titan’s atmosphere simulation experiment using a
continuous-spectrum UV-VUV synchrotron beamline
Zhe Peng, Thomas Gautier, Nathalie Carrasco, A. Giuliani, Ahmed Mahjoub,
Jean-Jacques Correia, P. Pernot, A. Buch, Y. Bénilan, Cyril Szopa, et al.
To cite this version:
Zhe Peng, Thomas Gautier, Nathalie Carrasco, A. Giuliani, Ahmed Mahjoub, et al.. Titan’s
atmo-sphere simulation experiment using a continuous-spectrum UV-VUV synchrotron beamline. European
Planetary Science Congress 2012, Sep 2012, Madrid, Spain. 7, pp.EPSC2012-194, 2012. �hal-00742633�
Titan’s atmosphere simulation experiment using a
continuous-spectrum UV-VUV synchrotron beamline
Z. Peng(1,2), T. Gautier (2), N. Carrasco (2), A. Giuliani (3), A. Mahjoub (2), J.-J. Correia (2), P. Pernot (1), A. Buch (4) and Y. Bénilan (5), C. Szopa (2), G. Cernogora (2)
(1) Laboratoire de Chimie Physique, UMR 8000, CNRS, Université Paris-Sud 11, F-91405 Orsay; (2) Laboratoire
Atmosphères, Milieux, Observations Spatiales, UMR 8190, CNRS, Université de Versailles Saint-Quentin/Université Pierre et Marie Curie, F-78280 Guyancourt; (3) Synchrotron SOLEIL, L’Orme des Merisiers, Saint-Aubin - BP 48, F-91192
Gif-sur-Yvette; (4) Laboratoire Génie des Procédés et Matériaux, École Centrale Paris, F-92295 Châtenay-Malabry; (5) Laboratoire Interuniversitaire des Systèmes Atmosphériques, UMR 7583, CNRS, Universités Paris VII & Paris XII, F-94010 Créteil ([email protected])
Abstract
We report here a new reactor, named APSIS for At-mospheric Photochemistry SImulated by Synchrotron, where a gas mixture (N2/CH4=90/10) at various
pres-sures in the mbar range in the reactor is irradiated using the continuous-spectrum (60-350 nm) DISCO beam in the SOLEIL Radiation Facility. The pho-tochemical products, in situ detected by quadrupole mass spectrometry, include C2, C3, C4 and probably C5 compounds.We compared the neutral productions in APSIS and other experiments with the INMS mea-surements.
1. Introduction
Titan, the largest moon of Saturn, is of great astrobi-ological interest, particularly in its upper atmosphere. In this atmospheric layer, the ongoing Cassini space mission revealed a complex chemistry resulting in the formation of N-bearing aerosols.
Since the formation mechanism of these species is still poorly understood, despite the numerous obser-vations made by the Cassini Orbiter [1], complemen-tary laboratory studies are realized in gas-phase reac-tors with an energy source initiating the primary ion-ization and dissociation processes of N2-CH4gas
mix-tures. In the PAMPRE reactor [2], energy is deposited through electron impacts, whereas a VUV monochro-matic synchrotron irradiation is used in the study of Imanaka and Smith [3].
In order to understand the in-situ observation bet-ter and try to reconcile plasma and synchrotron ex-periments, we designed a new reactor, APSIS - At-mospheric Photochemistry SImulated by Synchrotron - installed on the DISCO beamline in SOLEIL
Syn-chrotron Radiation Facility, using a full-spectrum EUV-VUV photons, and using the same environmen-tal conditions as the PAMPRE plasma reactor [4].
2. Experimental
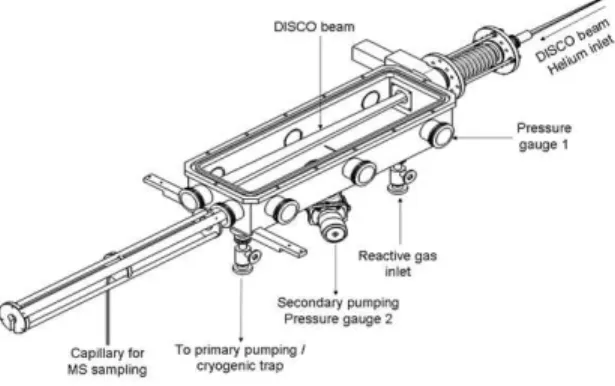
The stainless-steel reactor is presented in Fig. 1. A non-reactive carrier gas, Helium, is continuously in-jected between the beamline and the APSIS chamber to prevent CH4 to reach the synchrotron. A gas
mix-ture of N2/CH4=90/10 is flowed at different fluxes,
irradiated by continuous-spectrum photons (60-350 nm) of the DISCO beam and in situ analyzed by quadrupole mass spectrometry. The experiments are conducted at room temperature.
Figure 1:Schematic diagram of APSIS experiment.
In order to determine the absolute intensities of the peaks in the mass spectra, an alternative combination of least absolute deviation and least square deviation regressions for the MS is performed.
EPSC Abstracts
Vol. 7 EPSC2012-194 2012
European Planetary Science Congress 2012 c
Author(s) 2012
EPSC
3. Results and discussions
The mass spectrometry MID analysis reveals that the system reaches its stationary state after a few hundred seconds irradiation. The analog scan spectra before and after ≃1h irradiation are used for the analyses of the initial and stationary states, respectively. Spectra in difference are given on Fig. 2 for different influxes. Only the spectra for higher influxes (7 and 10 sccm) possess quantitatively significant intensities. The ob-vious C2, C3 and C4 band structures appear in the spectra (Fig. 2) (if the disturbance of N2 at 28 and
29 m/z and of Ar at 40 m/z excluded) and there are also probably some productions in C5 region.
Figure 2: Difference between the MS of the initial state and the state after ≃1 h irradiation obtained at various gas influxes in the APSIS reactor. Grey bars represent the fit errors of all m/z units.
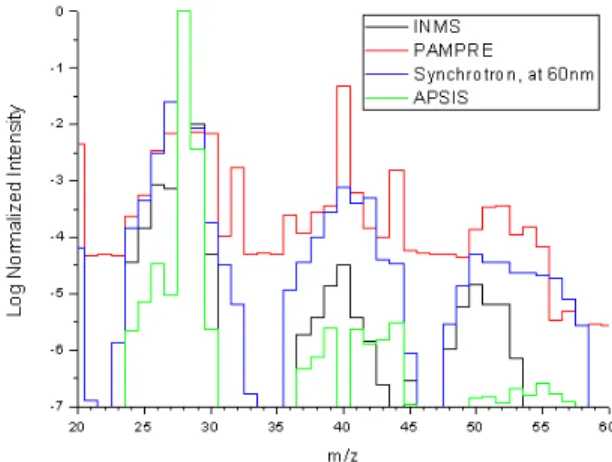
In Fig. 3, we compare the neutral productions in (a) the INMS measurements with (b) the PAMPRE exper-iment [2], (c) the synchrotron study at 60 nm [3] and (d) the APSIS experiment. A general decrease of the intensities with the size of the detected species is ob-served in all spectra, but with various orders of mag-nitude, due to different energy deposition efficiencies. The product mixing ratios in (b) and (c) are one or-der of magnitude higher than in Titan atmosphere and about one order of magnitude lower in (d).
More important is the distribution among the prod-ucts, in particular the ratio between the intensities at m/z=26 and 27, corresponding on a first approach to the mixing ratios of C2H2and HCN. Both (b) and (c) measure a significantly higher intensity of the peak at m/z = 27, and it is the opposite in the INMS and in the APSIS neutral mass spectra. Another N-bearing species, C2N2, is detected in Titan and in the APSIS
Figure 3:Mass spectra of neutral species in (a) Titan atmo-sphere measured by the INMS [1], (b) the PAMPRE plasma discharge study [2], (c) a synchrotron experiment at 60 nm reported in [3], and (d) the APSIS experiment at 10 sccm (the intensities at m/z=28 and 29, corresponding to N2, added
ar-tificially for convenience in comparison).
and (b), but not in (c). Therefore, in spite of system-atic lower productions, it seems that the APSIS exper-iment is more realistic to reproduce qualitatively Titan photochemistry. This reactor provides a new comple-mentary tool to simulate Titan atmospheric reactivity.
4. Conclusion
A new reactor, APSIS, Atmospheric Photochemistry SImulated by Synchrotron, has been designed to sim-ulate planetary atmospheric photochemistry processes. This setup produces species with two up to five heavy atoms. The C2 hydrocarbons are the major products, but nitrogen bearing species such as HCN and C2N2 were also detected, in agreement with Titan observa-tions.
References
[1] J.H. Waite Jr., D.T. Young, T.E. Cravens, A.J. Coates, F.J. Crary, B. Magee, and J. Westlake. Science, 316:870-875, 2007.
[2] N. Carrasco, T. Gautier, E. Es-sebbar, P. Pernot and G. Cernogora. Icarus, 219:230-240, 2012.
[3] H. Imanaka and M.A. Smith. Proc. Natl. Acad. Sci. USA, 107:12423-12428, 2010.
[4] Z. Peng et al. Titan’s atmosphere simulation experi-ment using a continuous-spectrum UV-VUV synchrotron beamline, in preparation, 2012.