HAL Id: hal-00330293
https://hal.archives-ouvertes.fr/hal-00330293
Submitted on 14 Oct 2008HAL is a multi-disciplinary open access
archive for the deposit and dissemination of sci-entific research documents, whether they are pub-lished or not. The documents may come from teaching and research institutions in France or abroad, or from public or private research centers.
L’archive ouverte pluridisciplinaire HAL, est destinée au dépôt et à la diffusion de documents scientifiques de niveau recherche, publiés ou non, émanant des établissements d’enseignement et de recherche français ou étrangers, des laboratoires publics ou privés.
Heterogeneous ice nucleation activity of bacteria: new
laboratory experiments at simulated cloud conditions
Ottmar Möhler, Dimitrios G. Georgakopoulos, Cindy E. Morris, S. Benz, V.
Ebert, S. Hunsmann, H. Saathoff, M. Schnaiter, Richard Wagner
To cite this version:
Ottmar Möhler, Dimitrios G. Georgakopoulos, Cindy E. Morris, S. Benz, V. Ebert, et al.. Heteroge-neous ice nucleation activity of bacteria: new laboratory experiments at simulated cloud conditions. Biogeosciences Discussions, European Geosciences Union, 2008, 5 (2), pp.1445-1468. �hal-00330293�
BGD
5, 1445–1468, 2008 Ice nucleation of bacterial cells O. M ¨ohler et al. Title Page Abstract Introduction Conclusions References Tables Figures ◭ ◮ ◭ ◮ Back CloseFull Screen / Esc
Printer-friendly Version Interactive Discussion
Biogeosciences Discuss., 5, 1445–1468, 2008 www.biogeosciences-discuss.net/5/1445/2008/ © Author(s) 2008. This work is distributed under the Creative Commons Attribution 3.0 License.
Biogeosciences Discussions
Biogeosciences Discussions is the access reviewed discussion forum of Biogeosciences
Heterogeneous ice nucleation activity of
bacteria: new laboratory experiments at
simulated cloud conditions
O. M ¨ohler1, D. G. Georgakopoulos2, C. E. Morris3, S. Benz1, V. Ebert4, S. Hunsmann4, H. Saathoff1, M. Schnaiter1, and R. Wagner1
1
Institute for Meteorology and Climate Research (IMK-AAF), Forschungszentrum Karlsruhe, Karlsruhe, Germany
2
Department of Agricultural Biotechnology, Agricultural University of Athens, Athen, Greece
3
INRA, Unit ´e de Pathologie V ´eg ´etale UR407, Montfavet, France
4
Institute for Physical Chemistry, University of Heidelberg, Heidelberg, Germany Received: 11 February 2008 – Accepted: 10 March 2008 – Published: 7 April 2008 Correspondence to: O. M ¨ohler ([email protected])
BGD
5, 1445–1468, 2008 Ice nucleation of bacterial cells O. M ¨ohler et al. Title Page Abstract Introduction Conclusions References Tables Figures ◭ ◮ ◭ ◮ Back CloseFull Screen / Esc
Printer-friendly Version Interactive Discussion
Abstract
The ice nucleation activities of five different Pseudomonas syringae, Pseudomonas viridiflava and Erwinia herbicola bacterial species and of Snomax™ were investigated in the temperature range between −5 and −15◦C. Water suspensions of these bacteria were directly spray into the cloud chamber of the AIDA facility of Forschungszentrum
5
Karlsruhe at a temperature of −5.7◦. At this temperature, about 1% of the Snomax™ cells induced freezing of the spray droplets before they evaporated in the cloud cham-ber. The other suspensions of living cells didn’t induce any measurable ice concen-tration during spray formation at −5.7◦. The remaining aerosol was exposed to typical cloud activation conditions in subsequent experiments with expansion cooling to about
10
−11◦C. During these experiments, the bacterial cells first acted as cloud condensa-tion nuclei to form cloud droplets and then eventually acted as ice nuclei to freeze the droplets. The results indicate that the bacteria investigated in the present study are mainly ice active in the temperature range between −7 and −11◦C with an INA fraction
of the order of 10−4. The ice nucleation efficiency of Snomax™ cells was much larger
15
with an INA fraction of 0.2 at temperatures around −8◦C.
1 Introduction
Numerous organisms, including plants, invertebrates and microorganisms, can cat-alyze the freezing of supercooled water, i.e. they can act as heterogeneous ice nuclei. This property is generally due to the production of proteins or proteinaceous
com-20
pounds (seeMorris et al.,2004, for a review). Some of these proteins are particularly efficient ice nuclei, being able to induce freezing at temperatures just below 0◦C, and are among the most active of the naturally occurring heterogeneous ice nuclei (Lee et al., 1995). Strains of the bacterium Pseudomonas syringae, in particular, can ex-press ice nucleation activity at −1 or −2◦C. The bacterium Pseudomonas syringae
25
BGD
5, 1445–1468, 2008 Ice nucleation of bacterial cells O. M ¨ohler et al. Title Page Abstract Introduction Conclusions References Tables Figures ◭ ◮ ◭ ◮ Back CloseFull Screen / Esc
Printer-friendly Version Interactive Discussion
of P. syringae has been recorded at rates of about 30 m−2s−1 above plant canopies (Lindemann et al.,1982). Such emission from plant canopies is apparently effective in transporting this bacterium up into clouds where it has been detected by several independent research teams (Sands et al.,1982;Amato et al.,2007). Ice nucleation active (INA) strains of P. syringae have also been detected in rain and snow ( Constan-5
tinidou et al.,1990;Morris et al.,2008) and in diverse substrates outside of agricultural contexts suggesting that they are disseminated via the water cycle (Morris et al.,2008). Because of the importance of the ice phase in clouds in the initiation of precipitation, a role for ice nucleation active bacteria in rain and snowfall has long been suspected (seeM ¨ohler et al.,2007, for a review). In fact it requires so-called ice nuclei, i.e. solid
10
aerosol particles with specific surface properties, to freeze supercooled water droplets at temperatures above −35◦C. Once formed, the ice phase in clouds growth and
mul-tiplies by a sequence of processes eventually leading to precipitation. As warmer the freezing temperature as more time the ice particles have to take part in this sequence and as more likely they grow to precipitation size. It was shown in previous studies that
15
bacteria are candidates for effective ice nuclei at such warm temperatures (Maki et al., 1974;Vali et al.,1976;Yankofsky et al.,1981;Levin and Yankofsky,1983;Ward and DeMott,1989, see e.g.). Up to now it is however not clear which are the sources and concentrations of the species of most importance in cloud evolution and how efficient those species are in acting as ice nuclei under the conditions of atmospheric clouds.
20
To address the latter question, new series of ice nucleation experiments with bacteria have been started in the AIDA (Aerosol Interaction and Dynamics in the Atmosphere) facility of Forschungszentrum Karlsruhe. Under humidity and temperature conditions of expanding cloud parcels, the ice nucleation efficiency of some selected Pseudomonas syringae, Pseudomonas viridiflava and Erwinia herbicola species were investigated at
25
temperatures between −5 and −15◦C. Experiments with Snomax™ have also been performed for comparison with previous studies (Ward and DeMott,1989;Wood et al., 2002).
BGD
5, 1445–1468, 2008 Ice nucleation of bacterial cells O. M ¨ohler et al. Title Page Abstract Introduction Conclusions References Tables Figures ◭ ◮ ◭ ◮ Back CloseFull Screen / Esc
Printer-friendly Version Interactive Discussion
2 Preparation of bacterial cells
Two series of ice nucleation experiments, Bio02 and Bio03, were conducted with Sno-max™ and 5 different strains of bacteria. All samples were prepared as suspensions in nanopure water for later dispersion of the bacterial cells into the aerosol phase (see Sect.4). Table 1summarises some properties of the six different suspensions.
Sno-5
max™ pellets from York Snow Inc. were used to prepare samples SM1 and SM2. Snomax™ is an industrial product of strain P. syringae 31R1 grown under conditions (industrial secret) to maximize the ice nucleation activity. Snomax™ is used to initiate snow formation behind water spray nozzles used by ski areas for ‘artificial’ snowmak-ing. The SM1 sample was prepared for the Bio02 experiments with a Snomax™ mass
10
concentration of 1 mg ml−1. After spraying 20 ml of SM1 into the 84 m3 large aerosol vessel (see Sect.4) the cell concentration was about 160 cm−3(see Table2). From this we can estimate a minimum cell concentration of 6.7×10⁸ml−1in the SM1 sample. The
SM2 sample prepared for Bio03 had a 10 times lower mass concentration than SM1. Dispersion of 50 ml resulted in a cell concentration of 40 cm−3 in the aerosol phase,
15
from which we can calculate a minimum cell concentration of 6.7×10⁷ml−1in the SM2
sample. We were not able to quantify the losses of cells during the dispersion, but a concentration of 1×10⁹bacterial cells in 1 mg of the Snomax™ pellets is a reasonable estimate.
For further ice nucleation experiments with living bacteria we selected strains that
20
were known from previous studies to show high INA at warm temperature when grown appropriately. The samples have again be tested for their INA with the droplet freezing method as described in Sect.3. Sample PS1 was prepared as a bacteria mixture of strain Pseudomonas viridiflava FMu 107 and Pseudomonas syringae IceHv. The first bacterium is a very close relative of P. syringae and is often difficult to distinguish from
25
P. syringae. This strain was isolated from frosted Chinese cabbage at the onset of the period for frost risk (in storage and in the field) in Beijing, People’s Republic of China (Morris et al.,1992). The strain P. syringae IceHv was isolated from field-grown
BGD
5, 1445–1468, 2008 Ice nucleation of bacterial cells O. M ¨ohler et al. Title Page Abstract Introduction Conclusions References Tables Figures ◭ ◮ ◭ ◮ Back CloseFull Screen / Esc
Printer-friendly Version Interactive Discussion
barley in Avignon, France in the fall of 2005. Both samples were mixed together in order to get enough volume for several experiments with the same sample at different temperatures in the cloud simulation chamber (see Sect.4). The strain P. syringae Cit7 was isolated from an orange tree in 1985, and P. syringae 31R1 from corn in 1976 by Lindow(1982). The latter is also used for the production of Snomax™. For preparing
5
the bacteria suspensions, the cells were grown on petri dishes containing King’s B agar (King et al.,1954) for 3 days at 25◦C. Petri dishes were then transferred to 4◦C and were stored for one week. We have observed that storage of the cells at this temperature for a few days enhances their ice nucleation activity. After this period of storage, they were washed off the plates with sterile distilled water, centrifuged to eliminate traces
10
of the substrate and resuspended again in sterile distilled water. The suspension was adjusted to an optical density of 0.6 at a wavelength of 580 nm which corresponds to a cell number concentration of about 1×10⁹ml−1.
3 Droplet freezing experiments
The bacterial suspensions used for the Bio02 set of experiments were tested for their
15
INA behaviour prior to the AIDA cloud simulation experiments. The INA was deter-mined with the droplet freezing method, as described byLindow(1982). Briefly, a set of 20µl droplets from tenfold dilutions of a bacterial suspension is placed on a paraffin-coated aluminum foil, placed on a cooling bath. The temperature of the bath is then lowered and the number of frozen drops at each temperature (at 1◦ intervals after a
20
30 s delay) is recorded. By taking into account the concentration of bacteria, it is possi-ble to estimate the concentration of ice nuclei for each temperature and, therefore, the ice nucleation-active proportion of the bacterial population. In this way we obtained for sample PS1 an INA cell number concentration of about 7×10³ml−1 at a temperature of −9◦C. By dividing through the total cell concentration of 1×10⁹ml−1 we obtain from
25
BGD
5, 1445–1468, 2008 Ice nucleation of bacterial cells O. M ¨ohler et al. Title Page Abstract Introduction Conclusions References Tables Figures ◭ ◮ ◭ ◮ Back CloseFull Screen / Esc
Printer-friendly Version Interactive Discussion
4 Cloud simulation experiments
The immersion and condensaton freezing eficiency of bacterial cells suspended in the aerosol phase was investigated at temperatures between −5 and −20◦C. The exper-iments were performed in the AIDA (Aerosol Interaction and Dynamics in the Atmo-sphere) facility of Forschungszentrum Karlsruhe. ADIA can be operated as a pumped
5
expansion chamber to investigate aerosol-cloud processes at simulated temperature and humidity conditions of atmospheric clouds (M ¨ohler et al.,2005,2006). Two series of experiments were performed during the AIDA campaigns Bio02 in January 2006 and Bio03 in May 2006 (see Table2).
Briefly, the AIDA facility consists of a cylindrical aluminium vessel with a volume of
10
84 m3. As descriped later, this vessel was used as a cloud simulation chamber for the experimens discussed here. The vessel is located in a thermally insulating box. An air ventilation, heating, and cooling system controls the temperature inside this box in the range from 60 to −90◦C. In preparation of the experiments, temperature changes are normally actuated during the night hours in order to approach the desired starting
15
temperature at a rate of about 4 K/h. During the experiments, the cooling system is operated at constant and homogeneous temperature control with temporal and spatial variability below ±0.3 K throughout the cold box and the cloud chamber. Also during the evening and night hours, the cloud chamber is cleaned by pumping to a pressure below 1 hPa, flushing with dry synthetic air, and filling with particle free humid air. The
20
particle background after filling to atmospheric pressure is normally below 0.1 cm−3. Experiments were started at a pressure between 1002 and 1021 hPa (see Table 2). At constant temperature and pressure conditions, a high relative humidity between 90 and 95% is maintained inside the cloud simulation chamber by a partial dew or, at lower wall temperatures, ice coverage of the inner chamber walls. The AIDA facility is
25
equipped with a comprehensive set of water, aeorosol, and cloud instruments (M ¨ohler et al.,2005,2006). For the present study we used the chilled mirror frost point hygrom-eter LX-373 from MBW Calibration Ltd. in Switzerland for total water concentration
BGD
5, 1445–1468, 2008 Ice nucleation of bacterial cells O. M ¨ohler et al. Title Page Abstract Introduction Conclusions References Tables Figures ◭ ◮ ◭ ◮ Back CloseFull Screen / Esc
Printer-friendly Version Interactive Discussion
measurements, the tunable diode laser absorption spectrometer APicT-DLAS (Ebert et al.,2005) for fast and sampling-free open-path water vapour measurements inside the AIDA vessel, the in situ light scattering and depolarisation setup SIMONE for the sensitive detection of droplet and ice particle growth, the infrared extinction spectrom-eter (FTIR) for the characterisation of droplet and ice particles (Wagner et al.,2006),
5
two optical particle counters Welas from Palas GmbH in Karlsruhe, Germany for mea-suring the number concentrations of droplets and ice particles (Benz et al.,2005), as well as two condensation particle counters (CPC3010, CPC3025), the scanning mobil-ity particle sizer (SMPS) and the aerodymamic particle spectrometer (APS) from TSI Inc. for aerosol measurements.
10
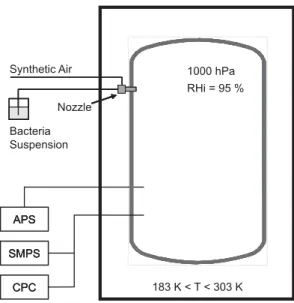
Figure1schematically shows the experimental setup for aerosol formation and char-acterisation. Bacterial suspensions were prepared as descriped in Sect.2and directly sprayed into the cloud chamber. It took a few minutes to disperse the sample volume Vs which ranged from 20 to 100 ml (see Table 2). Thus, the bacterial cells were first immersed in water droplets when entering the cloud chamber. The dispersion nozzle
15
was heated to about 20◦C, but the droplets quickly cooled to the temperature of the cloud chamber volume and then started to evaporate. Eventually, the bacterial cells acted as ice nuclei in the immersion mode before the droplet completely evaporated. This immersion freezing effect during spray formation of the bacterial aerosol will be discussed in Sect.5.
20
After all the droplets evaporated within about 5 to 10 min, the resulting aerosol size distributions were measured with the SMPS and APS aerosol instruments. Both in-struments were operated outside the cold box (Fig. 1) and connected to the cloud chamber with stainless steel sampling tubes. Particle losses in the sampling tubes can be neglected for the particle size range of interest in the present study. It should be
25
noted here that the SMPS system measures the electrical mobility size and the APS the aerodynamic size of aerosol particles. Both diameters are different for particles which are nonspherical, and therefore have a dynamic shape factor larger than one, or which have a density different from 1 g cm−3. Because bacterial cells are known
BGD
5, 1445–1468, 2008 Ice nucleation of bacterial cells O. M ¨ohler et al. Title Page Abstract Introduction Conclusions References Tables Figures ◭ ◮ ◭ ◮ Back CloseFull Screen / Esc
Printer-friendly Version Interactive Discussion
to be nonspherical, the SMPS and APS diameters were converted into the so-called volume-equivalent sphere diameter, i.e. the diameter of a spherical particle having the same terminal settling velocity as the particles measured with the SMPS and APS. Best match of the transferred SMPS and APS size distributions was achieved with a density of 1 g cm−3 and a dynamic shape factor of about 1.1 to 1.3. The nonspherical
5
nature of the bacterial cells in the aerosol phase was alse reflected by an enhaced de-polarisation ratio of scattered light measured with SIMONE during and after adding the bacterial cells to the cloud chamber (see Sect.5). Figures2and3show two examples of size distributions measured before the start of experiments Bio03 07 and Bio03 09, respectively. Both examples reveal the clear bimodal structure of the aerosol which
10
was observed in all experiments. The reason for that is the fact that only a minor frac-tion of the droplets generated by the spray nozzle contained a bacterial cell. The mode of smaller particles can therefore be explained as residual particles of evaporating droplets without a bacterial cell. The smaller but more narrow mode of larger particles shows the size distribution of the bacterial cells in the aerosol phase. The larger mode
15
size of about 0.8 µm for Snomax™ (Fig.2) and 0.6 µm for P. syringae 31R1 (Fig.3) is in good agreement with the expected size of single bacterial cells.
In some cases the larger mode of cell particles showed a tail towards larger particle diameters. This can be explained by a minor fraction of agglomerate particles of 2 or more bacterial cells originating from larger droplets which contained the respective
20
number of cells after dispersion. The formation of larger cell agglomerates by coag-ulation in the aerosol phase in the cloud chamber can be neglected for the number concentrations of cell particles (see below) on the time scales of the experiments. A bimodal lognormal size distribution was fitted to the measured data, shown as solid lines in Figs.2and 3. The number concentration naeof the total aerosol, i.e. the sum
25
of both modes, and the number concentration ncells of the bacterial cells in the larger mode were obtained from the lognormal fits. The results are listed in Table2. The size distribution fit result for nae was in good agreement with the aerosol number concen-trations directly measured with the condensation particle counter CPC3025 and, for
BGD
5, 1445–1468, 2008 Ice nucleation of bacterial cells O. M ¨ohler et al. Title Page Abstract Introduction Conclusions References Tables Figures ◭ ◮ ◭ ◮ Back CloseFull Screen / Esc
Printer-friendly Version Interactive Discussion
number concentrations below about 10 000 cm−3 also with the CPC3010 instrument. With number concentration between about 30 and 300 cm−3 the bacterial cells in the cloud chamber were about a factor 6 to 60 less abundant than the residual particles.
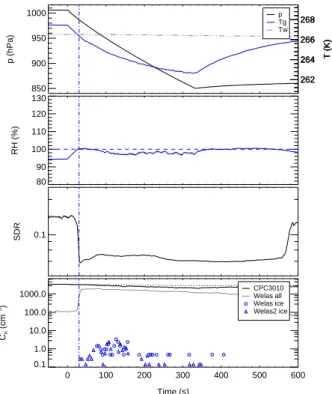
The efficiency of the bacterial cells in the condensation and immersioin modes of freezing was investigated in dynamic expansion experiments. Time series of pressure,
5
temperature, relative humidity, as well as aerosol, droplet, and ice particle number con-centrations are depicted in Figs.4and5for the expansion experiments Bio03 07 and Bio03 09, respectively. The expansion experiments were started after aerosol genera-tion at constant pressure and temperature condigenera-tions as given in Table2. The pressure in the cloud chamber was then lowered by pumping to about 850 hPa within a time
pe-10
riod of about 5 min (solid black line in top panel). The time axis in Figs. 4 and 5 is plotted in seconds relative to start pumping. In all expansion experiments the same expansion rate was achieved by setting the pump speed to 60% of its maximum value. The pump speed is also indicated in Table2. A value of 0 indicates the spray dispersion experiments at constant pressure and temperature and a value of 60 the expansion
ex-15
periments with dynamic changes of pressure, temperature, and humidity. The pumping expansion causes adiabatic cooling of the cloud chamber volume shown by the mea-sured gas temperature Tg in Figs.4and5(solid blue line in top panel). A mixing fan in the bottom part of the chamber volume forces homogeneous temperature and humid-ity conditions during the expansion. The wall temperature Tw (dash-dotted line in top
20
panel) stays almost constant all the time. The increasing difference between Tw and
Tg causes an increasing heat flux from the chamber walls and thereby an increasing deviation of the temperature profile from the adiabatic case.
The relative humidities RH with respect to water (solid blue line in second panel of Figs.4 and 5 are obtained from water vapour concentrations measured by in situ
25
high-resolution diode laser absorption spectroscopy (APicT-DLAS) and the saturation vapour pressures of water calculated for Tg. The water vapor concentrations were measured directly within the cloud by using a fibre-coupled, open-path, White-type absorption cell with an absoption path length of 23.6 m inside the cloud chamber (see
BGD
5, 1445–1468, 2008 Ice nucleation of bacterial cells O. M ¨ohler et al. Title Page Abstract Introduction Conclusions References Tables Figures ◭ ◮ ◭ ◮ Back CloseFull Screen / Esc
Printer-friendly Version Interactive Discussion
Mangold et al.,2005, for more details). During the Bio02 and Bio03 experiments the APicT-DLAS measured with a 1.5 s temporal resolution and a concentration resolution of about 20 ppm. Starting from about 95%, the relative humidity increases due to the expansion cooling and approaches water saturation after about 40 s of pumping. At about the same time, the total number of particles measured with the optical particle
5
counter Welas (grey line in the lower panel) steeply raises due to the activation and growth of water droplets. The FTIR extinction spectra measured at the same time (not shown in the figure) reveal that initially only water droplets are formed and that the number of droplets is close to the number of aerosol particles before droplet formation (black line in the lower panel). It should be noted that the CPC3010 measures the total
10
particle concentration and does not distinguish between aerosol particles and droplets. The Welas instrument underestimates the total droplet concentration because some droplets are too small for optical detection. After 50 s of pumping, the mean droplet diameter was about 2 µm for experiment Bio03 07 and 3 µm for experiment Bio03 09.
The third panel of Figs. 4 and 5 show the SIMONE depolarisation ratio (SDR) of
15
polarised laser light of 488 nm wavelenght scattered from particles in the center of the cloud chamber to a scattering angle of 176◦. Any SDR signal larger than the
back-ground level of about 0.04 clearly indicates the presence of nonspherical particles in the cloud chamber. These can be either bacterial cells, which are known to be as-pherical, or ice particles growing to larger sizes after their nucleation by INA bacteria
20
immersed in droplets. The SDR signals before start pumping, i.e. before cloud droplet and ice activation, are due to the bacterial cells alone. It can be seen in Figs.4 and 5that the P. Syringae bacteria of strain 31R1 gives a larger SDR than the Snomax™ cells, which means that the living cells are more aspherical. The number of ice particles formed during the expansion experiments was measured with the two optical particle
25
counters Welas and Welas2 (blue circles and triangles, respectively, in the lower panel of Figs. 4 and 5). Both instruments are located below the cloud chamber and mea-sure the concentration of ice particles larger than about 0.5µm in a sample flow taken from the chamber volume through a vertical stainless steel sampling tube. In Table2
BGD
5, 1445–1468, 2008 Ice nucleation of bacterial cells O. M ¨ohler et al. Title Page Abstract Introduction Conclusions References Tables Figures ◭ ◮ ◭ ◮ Back CloseFull Screen / Esc
Printer-friendly Version Interactive Discussion
are listed the maximum ice number concentrations measured during the respective experiments. The detection limit of the Welas instruments is about 0.1 cm−3.
5 Results and discussion
Experimental parameters and results are summarised in Table2. Most of the exper-iments were started at an initial temperature Tg of about −5.7◦C. Only experiments
5
Bio02 09 and Bio02 10 were started at a colder temperature of about −9.7◦C. The amount of sample volume Vs sprayed into the cloud chamber is also given in Table 2 for the static experiments without pumping (zero pump speed). A zero volume indi-cates that the aerosol generated during the spray experiment before remained in the chamber for the subsequent expansion experiment. It was discussed in Sect. 4 how
10
the number concentrations of total aerosol particles nae, bacterial cells ncells, and ice particles ni were measured. As a main result from this work, the ice nucleation active
(INA) cell fraction fINAwas calculated from the ratio of ni to ncells. In case of the spray
experiments with Snomax™ at −5.7◦C, significant ice formation was only measured
during Bio02 04 with an INA fraction of about 1%. For Bio03 06 only an upper limit
15
of 0.003 could be given. This means that only 1% or less of the Snomax™ cells is ice-active at −5.7◦C in the immersion mode of freezing, at least within the
evapora-tion timescale of the spray droplets which is of the order of a few seconds to a few minutes. In similar cloud expansion studies with Snomax™Ward and DeMott (1989) found some INA cells at a temperature around −5◦C.
20
Figure4shows, as an illustration example, how the number of ice particles increased during the expansion experiment Bio03 07 after droplets had formed. The formation of some ice crystals immediatly after the activation of the first droplets is indicated in a small SDR peak next to the vertical blue line. The number of ice crystals was below the detection limit of the Welas instruments. The SDR then drops and approaches the
25
background value because the few ice crystals rapidly grew to large sizes and settled to the floor of the cloud chamber. The major peak of ice formation occured between
BGD
5, 1445–1468, 2008 Ice nucleation of bacterial cells O. M ¨ohler et al. Title Page Abstract Introduction Conclusions References Tables Figures ◭ ◮ ◭ ◮ Back CloseFull Screen / Esc
Printer-friendly Version Interactive Discussion
50 and 110 s of pumping time with the Welas ice number concentration increasing to a maximum value of 10 cm−3. This corresponds to an increase of fraction of INA
cells from almost 0 to a maximum value of 0.23 within a narrow temperature range from about −7 to −9◦C. At the same time, the depolarisation ratio starts to rise again, which also indicates the formation and growth of further ice crystals. About 20 s after
5
the ice particle concentration reached its maximum value, the droplets evaporated due to the so-called Bergeron-Findeisen mechanism. In other words, the lower saturation pressure of water above the ice particles compared to the supercooled water droplets lowers the relative humidity, as also indicated in the TDL measurements, and therefore induces growth of the ice volume in expense of the liquid droplet. The evaporation of
10
the droplets is also indicated in the steep SDR increase. After all water droplets evap-orated, which was approved by the FTIR measurements, the pumping expansion still continued to a minimum temperature of about −11◦C, but no further increase of ni was observed. This indicates that the remaining 80% of the not yet INA cells didn’t show strong INA in the deposition mode of ice nucleation at temperatures as low as −11◦C.
15
The ice number concentration increased with time due to settling losses of the larger ice crystals in the chamber, and about 150 s after pumping stopped the remaining ice crys-tals completely evaporated in the warming cloud chamber. Experiment Bio03 04 also revealed that about 20% of the Snomax™ cells are ice active between −7 and −9◦C. This is in agreement to studies by Ward and DeMott (1989) and Wood et al.(2002)
20
who also found strong ice nucleation efficiency of Snomax™ at these temperatures. During experiment Bio03 09, ice particles also formed between about 50 and 110 s of pumping time (lowest panel in Fig.5), but with a tenfold lower number concentration. In this experiment, the initially higher SDR of the more aspherical bateria (see above) dropped to almost the background value during the formation of the liquid cloud. This
25
indicates that at least most of the bacterial cells are CCN active and transform from aspherical particles to spherical droplets without scattering depolarisation. The SDR rises again along with the formation of ice particles and decreases with the depositional loss of the ice particles between 150 and 400 s. It should be noted that for the analysis
BGD
5, 1445–1468, 2008 Ice nucleation of bacterial cells O. M ¨ohler et al. Title Page Abstract Introduction Conclusions References Tables Figures ◭ ◮ ◭ ◮ Back CloseFull Screen / Esc
Printer-friendly Version Interactive Discussion
of fINAin the present study we assumed that only the cell particles but not the residual
particles are ice-active and, in case of the expansion experiments, that most of the cell particles were activated to form cloud droplets. The first assumption was supported by the fact that no significant ice formation was observed at temperature between −5.7 and −11◦C in an expansion experiment with a filtered Snomax™ suspension. The
5
second assumption also seems to be reasonable because bacterial cells have found to be active cloud condensation nuclei at relatively low supersaturation with respect to water (Franc and DeMott, 1998; Bauer et al., 2003). So, at least if the cells are wettable, they are in favour for CCN activation due to their larger size compared to the residual particles. As discussed above also the SDR data indicates the CCN activation
10
of bacterial cells.
In all spray experiments with living cells at −5.7◦C no significant ice formation was observed. During the expansion experiments the same strains were only slightly ac-tive at temperatures between −7 and −11◦C with INA fractions of the order of 10−4.
The lower ice-active fraction is also illustrated for experiment Bio03 09 in Fig.5which
15
shows the same timeseries as already discussed above for experiment Bio03 07. For the PS1 sample a second spray experiment was performed at a temperature of −9.7◦C.
At this temperature the observed INA fraction was about 0.005 which is in good agree-ment to the value of 0.004 measured during the expansion experiagree-ment before at a similar temperature. This shows that the spray and expansion experiments are
con-20
sistent and can be compared to each other. Surprisingly, no significant ice formation was observed in the expansion experiment Bio02 10 with cooling to a minimum tem-perature of −15.2◦C. This indicates that almost all INA cells have been activated during
the experiment Bio02 09 before, followed by either deactivation if the INA sites or re-movel from the cloud chamber by settling ice crystals. It was not possible to exactly
25
determine the removal efficiency of ice crystals under the conditions of the experiments discussed here. At least a minor fraction of the ice particles formed during the expan-sion experiments with Snomax™ were likely to evaporate in the chamber (see Fig.4) and to release their ice nuclei to the chamber aerosol. Again, subsequent expansion
BGD
5, 1445–1468, 2008 Ice nucleation of bacterial cells O. M ¨ohler et al. Title Page Abstract Introduction Conclusions References Tables Figures ◭ ◮ ◭ ◮ Back CloseFull Screen / Esc
Printer-friendly Version Interactive Discussion
with the remaining aerosol not listed in Table2didn’t show any significant ice formation. Further experiments are needed to investigate and quantify a possible deactivation ef-fect of INA cells. We can conclude from experiments Bio02 06 to Bio02 10 that the ice nucleation activity of strains P. viridiflava FMu107 and P. syringae IceHv only occurs in a narrow temperature range around −10◦C. Previous studies by Levin and Yankofsky
5
(1983) and Ward and DeMott (1989) have also demonstrated that freezing induced by bacterial cells may occur only in narrow temperature ranges. For the sample PS1, the fraction of INA cells was also determined with the droplet freezing method as de-scribed in Sect.3. The lower value of about 10−5(the ratio between the number of INA cells and the number of cells per ml in Table1) compared to the AIDA could be due to
10
the slightly warmer temperature. However, further droplet freezing and AIDA chamber experiments are needed for a better quantitative comparison of both methods. This is in particular important because previous laboratory experiments on the ice nucle-ation efficiency of bacterial cells have also indicated INA fraction of the order of 10−5
(Yankofsky et al.,1981).
15
6 Conclusions
The ice nucleation efficiencies of five different P. syringae, P. viridiflava and E. her-bicola bacteria strains were investigated at simulated cloud conditions in the tempera-ture range from −5.7 to −15◦C. No significant ice activity of the bacteria species was observed above −7◦C. The results indicate that the bacteria investigated in the present
20
study are mainly ice-active in the temperature range between −7 and −11◦C with an INA fraction of the order of 10−4. For the P. syringae strain 31R1, we measured an INA fraction of 4×10⁻⁴ at −10◦C in AIDA experiments, but only 4×10⁻⁶ at −9◦C in a
freezing experiment with droplets deposited on an aluminium foil. From the experi-ments of the present study we are not able to conclude if this difference is only due
25
to the slightly different temperature. Further comparison experiments are needed to investigate if there is a systematic difference between AIDA results and the droplet
BGD
5, 1445–1468, 2008 Ice nucleation of bacterial cells O. M ¨ohler et al. Title Page Abstract Introduction Conclusions References Tables Figures ◭ ◮ ◭ ◮ Back CloseFull Screen / Esc
Printer-friendly Version Interactive Discussion
freezing method according toLindow (1982). For Snomax™ cells an INA fraction of about 0.2 was measured at temperatures around −8◦C. A little ice activity was also observed around −6◦C. The AIDA results are in reasonable agreement withWard and DeMott (1989) who reported two distinct peaks of Snomax™ ice activity around −5 and −8◦C. Some of the AIDA results indicate a possible deactivation of bacterial cells
5
as active ice nuclei during the first ice activation event. Such a deactivation could have a remarkable impact on the role of INA bacteria in cloud formation and should further be investigated.
Acknowledgements. The authors are appreciative to the AIDA operators and technicians for
their skilful support during the Bio02 and Bio03 campaigns. We also acknowledge support
10
from T. Schwartz for preparing the biological samples in the microbilogy lab of the Institute for Technical Chemistry of Forschungszentrum Karlsruhe, and from S. Wagner for assisting the programming and data analysis of the APicT-DLAS system. This work was funded within the Helmholtz Research Programme Atmosphere and Climate and contributes to the Helmholtz Virtual Institute on Aerosol-Cloud Interactions (VI-ACI).
15
References
Amato, P., Parazols, M., Sancelme, M., Laj, P., Mailhot, G., and Delort, A. M.: Microorganisms isolated from the water phase of tropospheric clouds at the Puy de Dome: major groups and growth abilities at low temperatures, FEMS Microbiology Ecology, 59, 242–254, 2007. 1447 Bauer, H., Giebl, H., Hitzenberger, R., Kasper-Giebl, A., Reischl, G., Zibuschka, F., and
20
Puxbaum, H.: Airborne bacteria as cloud condensation nuclei, J. Geophys. Res.-Atmos., 108, 4658, doi:10.1029/2003JD003 545, 2003.1457
Benz, S., Megahed, K., M ¨ohler, O., Saathoff, H., Wagner, R., and Schurath, U.: T-dependent rate measurements of homogeneous ice nucleation in cloud droplets using a large atmo-spheric simulation chamber, J. Photoch. Photobio. A, 176, 208–217, 2005. 1451
25
Constantinidou, H. A., Hirano, S. S., Baker, L. S., and Upper, C. D.: Atmospheric Dispersal of Ice Nucleation-Active Bacteria – the Role of Rain, Phytopathology, 80, 934–937, 1990.1447 Ebert, V., Teichert, H., Giesemann, C., Saathoff, H., and Schurath, U.: Fiber-coupled in-situ
BGD
5, 1445–1468, 2008 Ice nucleation of bacterial cells O. M ¨ohler et al. Title Page Abstract Introduction Conclusions References Tables Figures ◭ ◮ ◭ ◮ Back CloseFull Screen / Esc
Printer-friendly Version Interactive Discussion
laser absorption spectrometer for the selective detection of water vapour traces down to the ppb-level, Technisches Messen, 72, 23–30, 2005. 1451
Franc, G. D. and DeMott, P. J.: Cloud activation characteristics of airborne Erwinia carotovora cells, J. Appl. Meteorol., 37, 1293–1300, 1998.1457
King, E. O., Ward, M. N., and Raney, D. T.: Two simple media for the demonstration of pyocyanin
5
and fluorescein, J. Lab. Clin. Med., 44, 301–307, 1954. 1449
Lee, R. E., Warren, G. J., and Gusta, L. V.: Biological Ice Nuclation and Its Applications, APS Press; The American Phytopathological Society, St. Paul, Minnesota, 1995. 1446
Levin, Z. and Yankofsky, S. A.: Contact Versus Immersion Freezing of Freely Suspended Droplets by Bacterial Ice Nuclei, J. Appl. Meteorol., 22, 1964–1966, 1983. 1447,1458
10
Lindemann, J., Constantinidou, H. A., Barchet, W. R., and Upper, C. D.: Plants as a source of airborne bacteria, including ice nucleation active bacteria, Appl. Environ. Microbiol., 44, 1059–1063, 1982. 1447
Lindow, S. E.: Population dynamics of epiphytic ice nucleation active bacteria on frost sensiteive plants and frost control by means of antagonistic bacteria, in: Plant Cold Hardiness and
15
Freezing Stress, edited by: Sakai, A. and Li, P. H., 2, Academic Press, New York, 1982. 1449,1459
Maki, L. R., Galyan, E. L., Chang-Chien, M. M., and Caldwell, D. R.: Ice nucleation induced by Pseudomonas syringae, Appl. Environ. Microb., 28, 456–459, 1974.1447
Mangold, A., Wagner, R., Saathoff, H., Schurath, U., Giesemann, C., Ebert, V., Kramer, M.,
20
and M ¨ohler, O.: Experimental investigation of ice nucleation by different types of aerosols in the aerosol chamber AIDA: implications to microphysics of cirrus clouds, Meteorol. Z., 14, 485–497, 2005. 1454
M ¨ohler, O., B ¨uttner, S., Linke, C., Schnaiter, M., Saathoff, H., Stetzer, O., Wagner, R., Kr ¨amer, M., Mangold, A., Ebert, V., and Schurath, U.: Effect of sulfuric acid coating on
hetero-25
geneous ice nucleation by soot aerosol particles, J. Geophys. Res.-Atmos, 110, D11 210, doi:10.1029/2004JD005 169, 2005.1450
M ¨ohler, O., Field, P. R., Connolly, P., Benz, S., Saathoff, H., Schnaiter, M., Wagner, R., Cotton, R., Kr ¨amer, M., Mangold, A., and Heymsfield, A. J.: Efficiency of the deposition mode ice nucleation on mineral dust particles, Atmos. Chem. Phys., 6, 3007–3021, 2006,
30
http://www.atmos-chem-phys.net/6/3007/2006/. 1450
M ¨ohler, O., DeMott, P. J., Vali, G., and Levin, Z.: Microbiology and atmospheric processes: the role of biological particles in cloud physics, Biogeosciences, 4, 1059–1071, 2007,
BGD
5, 1445–1468, 2008 Ice nucleation of bacterial cells O. M ¨ohler et al. Title Page Abstract Introduction Conclusions References Tables Figures ◭ ◮ ◭ ◮ Back CloseFull Screen / Esc
Printer-friendly Version Interactive Discussion
http://www.biogeosciences.net/4/1059/2007/. 1447
Morris, C. E., Wen, A.-M., Xu, X.-H., and Di, Y.-B.: Ice nucleation active bacteria on Chinese cabbage in northern China : populations dynamics and characteristics and their possible role in storage decay, Phytopathology, 82, 739–746, 1992. 1448
Morris, C. E., Georgakopoulos, D. G., and Sands, D. C.: Ice nucleation active bacteria and their
5
potential role in precipitation, J. Phys. IV, 121, 87–103, 2004. 1446
Morris, C. E., Sands, D. C., Vinatzer, B. A., Glaux, C., Guilbaud, C., Buffi `ere, A., Yan, S., Dominguez, H., and Thompson, B. M.: The life history of the plant pathogen Pseudomonas syringae is linked to the water cycle, ISME Journal, 2, 321–334, doi:10.1038/ismej.2007.113, 2008. 1447
10
Sands, D. C., Langhans, V. E., Scharen, A. L., and Smet, G.: The association between bacteria and rain and possible resultant meteorological implications, J. Hungarian Meteorol. Serv., 86, 148–152, 1982.1447
Vali, G., Christensen, M., Fresh, R. W., Galyan, L. R., Maki, L. R., and Schnell, R. C.: Biogenic Ice Nuclei. Part II: Bacterial Sources, J. Atmos. Sci., 33, 1565–1570 , doi:10.1175/1520–
15
0469(1976)033, 1976. 1447
Wagner, R., Benz, S., M ¨ohler, O., Saathoff, H., and Schurath, U.: Probing ice clouds by broad-band mid-infrared extinction spectroscopy: case studies from ice nucleation experiments in the AIDA aerosol and cloud chamber, Atmos. Chem. Phys., 6, 4775–4800, 2006,
http://www.atmos-chem-phys.net/6/4775/2006/. 1451
20
Ward, P. J. and DeMott, P. J.: Preliminary experimental evaluation of Snomax, Pseudomonas syringae, as an artificial ice nucleus for wheather modification, J. Wea. Mod., 21, 9–13, 1989. 1447,1455,1456,1458,1459
Wood, S. E., Baker, M. B., and Swanson, B. D.: Instrument for studies of homogeneous and heterogeneous ice nucleation in free-falling supercooled water droplets, Rev. Sci. Instrum.,
25
73, 3988–3996, 2002. 1447,1456
Yankofsky, S. A., Levin, Z., Bertold, T., and Sandlerman, N.: Some basic characteristics of bacterial freezing nuclei, J. Appl. Meteorol., 20, 1013–1019, 1981. 1447,1458
BGD
5, 1445–1468, 2008 Ice nucleation of bacterial cells O. M ¨ohler et al. Title Page Abstract Introduction Conclusions References Tables Figures ◭ ◮ ◭ ◮ Back CloseFull Screen / Esc
Printer-friendly Version Interactive Discussion Table 1. Overview of samples prepared for the experiments. The cell number concentration
was obtained from microscopic analsis for the Snomax™ suspensions and from optical density measurements for the living cell suspensions.
Sample Type of bacteria Cell concentration (ml−1)
SM1 Snomax™ 1 × 10⁹ SM2 Snomax™ 1 × 10⁸ PS1 P. viridiflava FMu107 1 × 10⁹ P. syringae IceHv PS2 P. syringae 31R1 1 × 10⁹ PS3 P. syringae Cit7 1 × 10⁹ EH1 E. herbicola 268 Rb-2 9 × 10⁸
BGD
5, 1445–1468, 2008 Ice nucleation of bacterial cells O. M ¨ohler et al. Title Page Abstract Introduction Conclusions References Tables Figures ◭ ◮ ◭ ◮ Back CloseFull Screen / Esc
Printer-friendly Version Interactive Discussion Table 2. Parameters of AIDA experiments and measured ice active fractions of bacterial cells.
Vsis the sample volume of the bacterial suspension directly sprayed into the AIDA cloud
cham-ber at the beginning of the respective experiments. The resulting aerosol remained in the chamber for the following experiment with expansion cooling by pumping. p and Tg are the initial pressure and temperature in the cloud chamber, and nae, ncells, and ni the measured number concentrations of total aerosol, bacterial cell, and ice particles, respectively. The ice active cell fraction fINA is the ratio of nito ncells, and Tithe temperature at which the peak of ice formation was observed.
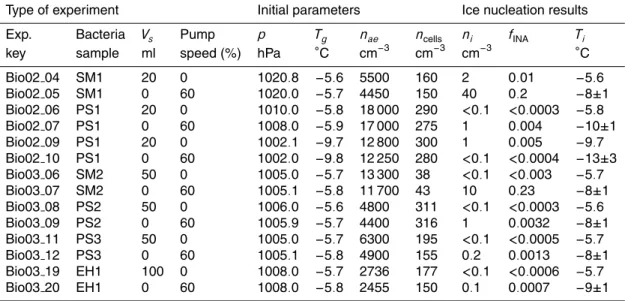
Type of experiment Initial parameters Ice nucleation results Exp. Bacteria Vs Pump p Tg nae ncells ni fINA Ti
key sample ml speed (%) hPa ◦C cm−3 cm−3 cm−3 ◦C
Bio02 04 SM1 20 0 1020.8 −5.6 5500 160 2 0.01 −5.6 Bio02 05 SM1 0 60 1020.0 −5.7 4450 150 40 0.2 −8±1 Bio02 06 PS1 20 0 1010.0 −5.8 18 000 290 <0.1 <0.0003 −5.8 Bio02 07 PS1 0 60 1008.0 −5.9 17 000 275 1 0.004 −10±1 Bio02 09 PS1 20 0 1002.1 −9.7 12 800 300 1 0.005 −9.7 Bio02 10 PS1 0 60 1002.0 −9.8 12 250 280 <0.1 <0.0004 −13±3 Bio03 06 SM2 50 0 1005.0 −5.7 13 300 38 <0.1 <0.003 −5.7 Bio03 07 SM2 0 60 1005.1 −5.8 11 700 43 10 0.23 −8±1 Bio03 08 PS2 50 0 1006.0 −5.6 4800 311 <0.1 <0.0003 −5.6 Bio03 09 PS2 0 60 1005.9 −5.7 4400 316 1 0.0032 −8±1 Bio03 11 PS3 50 0 1005.0 −5.7 6300 195 <0.1 <0.0005 −5.7 Bio03 12 PS3 0 60 1005.1 −5.8 4900 155 0.2 0.0013 −8±1 Bio03 19 EH1 100 0 1008.0 −5.7 2736 177 <0.1 <0.0006 −5.7 Bio03 20 EH1 0 60 1008.0 −5.8 2455 150 0.1 0.0007 −9±1
BGD
5, 1445–1468, 2008 Ice nucleation of bacterial cells O. M ¨ohler et al. Title Page Abstract Introduction Conclusions References Tables Figures ◭ ◮ ◭ ◮ Back CloseFull Screen / Esc
Printer-friendly Version Interactive Discussion APS SMPS CPC 1000 hPa RHi = 95 % Bacteria Suspension Synthetic Air Nozzle APS SMPS CPC 183 K < T < 303 K APS SMPS CPC
BGD
5, 1445–1468, 2008 Ice nucleation of bacterial cells O. M ¨ohler et al. Title Page Abstract Introduction Conclusions References Tables Figures ◭ ◮ ◭ ◮ Back CloseFull Screen / Esc
Printer-friendly Version Interactive Discussion 0.01 0.10 1.00 dp (µm) 0 5.0•103 1.0•104 1.5•104 dN/dlogd p (cm −3 ) SMPS APS Fit
Fig. 2. Size distribution of Snomax™ aerosol measured before expansion experiment Bio03 07
with the scanning mobility particle spectrometer SMPS (circles) and the aerodynamic particle spectrometer APS (tiangles). The size distribution clearly reveals the bi-modal nature of the aerosol with smaller residual particles from evaporated droplets which didn’t contain intact bac-terial cells, and the larger, but less abundant, bacbac-terial cell particles with diameters around 0.8 µm. A bimodal lognormal size distribution (solid line) was fitted to the data.
BGD
5, 1445–1468, 2008 Ice nucleation of bacterial cells O. M ¨ohler et al. Title Page Abstract Introduction Conclusions References Tables Figures ◭ ◮ ◭ ◮ Back CloseFull Screen / Esc
Printer-friendly Version Interactive Discussion 0.01 0.10 1.00 dp (µm) 0 1000 2000 3000 4000 5000 6000 dN/dlogd p (cm −3 ) SMPS APS Fit
Fig. 3. Same as Fig.2for P. syringae 31R1 of experiment Bio03 09. In this example the mode
BGD
5, 1445–1468, 2008 Ice nucleation of bacterial cells O. M ¨ohler et al. Title Page Abstract Introduction Conclusions References Tables Figures ◭ ◮ ◭ ◮ Back CloseFull Screen / Esc
Printer-friendly Version Interactive Discussion 850 900 950 1000 p (hPa) 262 264 266 268 T (K) 262 264 266 268 T (K) 262 264 266 268 T (K) p Tg Tw 80 90 100 110 120 130 RH (%) 0.1 SDR 0 100 200 300 400 500 600 Time (s) 0.1 1.0 10.0 100.0 1000.0 10000.0 Cn (cm −3 ) CPC3010 Welas all Welas ice Welas2 ice
BGD
5, 1445–1468, 2008 Ice nucleation of bacterial cells O. M ¨ohler et al. Title Page Abstract Introduction Conclusions References Tables Figures ◭ ◮ ◭ ◮ Back CloseFull Screen / Esc
Printer-friendly Version Interactive Discussion 850 900 950 1000 p (hPa) 262 264 266 268 T (K) 262 264 266 268 T (K) 262 264 266 268 T (K) p Tg Tw 80 90 100 110 120 130 RH (%) 0.1 SDR 0 100 200 300 400 500 600 Time (s) 0.1 1.0 10.0 100.0 1000.0 Cn (cm −3 ) CPC3010 Welas all Welas ice Welas2 ice