HAL Id: hal-00459138
https://hal.archives-ouvertes.fr/hal-00459138
Submitted on 23 Feb 2010HAL is a multi-disciplinary open access archive for the deposit and dissemination of sci-entific research documents, whether they are pub-lished or not. The documents may come from teaching and research institutions in France or abroad, or from public or private research centers.
L’archive ouverte pluridisciplinaire HAL, est destinée au dépôt et à la diffusion de documents scientifiques de niveau recherche, publiés ou non, émanant des établissements d’enseignement et de recherche français ou étrangers, des laboratoires publics ou privés.
deployment on the EGEE Grid
Erik Pernod, Jean-Christophe Souplet, Javier Rojas Balderrama, Diane
Lingrand, Xavier Pennec
To cite this version:
Erik Pernod, Jean-Christophe Souplet, Javier Rojas Balderrama, Diane Lingrand, Xavier Pennec. Multiple Sclerosis Brain MRI Segmentation Workflow deployment on the EGEE Grid. MICCAI-Grid Workshop, Sep 2008, New York, United States. pp.55–64. �hal-00459138�
MICCAI-Grid Workshop - Olabarriaga, Lingrand and Montagnat (Eds.), Sept. 6, 2008, New York (NY). 55
Multiple Sclerosis Brain MRI Segmentation
Workflow deployment on the EGEE Grid
Erik Pernod
1, Jean-Christophe Souplet
1, Javier Rojas Balderrama
2,
Diane Lingrand
2and Xavier Pennec
11INRIA, Ascl´epios Project team, 2004 Route des Lucioles BP 93 - 06902 Sophia Antipolis Cedex, France
{Erik.Pernod, Jean-Christophe.Souplet, Xavier.Pennec}@sophia.inria.fr
2Univ. Nice - Sophia Antipolis / CNRS - I3S Laboratory, BP 145 - 06903 Sophia Antipolis Cedex, France
{javier, lingrand}@i3s.unice.fr
Abstract
Automatic brain MRI segmentations methods are useful but computationally intensive tools in med-ical image computing. Deploying them on grid infrastructures can provide an efficient resource for data handling and computing power. In this study, an efficient implementation of a brain MRI segmentation method through a grid-interfaced workflow enactor is proposed. The deployment of the workflow en-ables simultaneous processing and validation. The importance of parallelism is shown with concurrent analysis of several MRI subjects. The results obtained from the grid have been compared to the results computed locally on only one computer. Thanks to the power of the grid, method’s parameter influence on the resulting segmentations has also been assessed given the best compromise between algorithm speed and results accuracy. This deployment highlights also the grid issue of a bottleneck effect.
1
Introduction
The segmentation of lesions on brain MRI is required for diagnosis purpose in multiple Sclerosis (MS) [15]. Moreover, the lesion burden is also used in MS patients’ follow-up and in MS clinical researches [5]. Differ-ent methods of lesions segmDiffer-entation are available in the literature [18]. Most of them are based on complex algorithms and require numerous computations. Furthermore, medical images treatments need more and more computation power due to the increase of image size and resolution. Medical image databases also contain an increase amount of MRI subjects to analyze. The use of grids might help us to reduce computa-tion time. For example, an evaluacomputa-tion framework for analyzing the accuracy of rigid registracomputa-tion algorithms has been made possible using a grid [9]; Action potential propagation on cardiac tissue simulations have also been performed on grid to accelerate multiple executions [1].
In this paper, we focus on the MS application aiming at segment MS lesions in brain MRI images. This work is part of the NeuroLOG project1[11] which aims at federating medical data, metadata and algorithms, and sharing computing resources on the grid.
This MS lesion segmentation algorithm has been developed by Dugas et al. [2, 3]. First, brain MRIs are normalized (spatially and in intensity) and skull-stripped. Then, a segmentation of the brain into the
ferent healthy compartments classes (White Matter (WM), Gray Matter (GM), Cerebro-Spinal Fluid (CSF)) is realized using an Expectation Maximization algorithm. Resulting segmentations are used to segment le-sion on the T2-FLAIR sequence. The expectation-maximization algorithm consists in iterating two steps: labelization of the image (Expectation step) and estimation of the Gaussian class parameters (Maximization step). In this last step, the class parameters are computed from the intensities of the different voxels. In order to improve the algorithm speed, only a part of the image voxel can be taken into consideration thanks to a ratio parameter. This parameter fix the percentage of voxel which is used. However, if the algorithm is applied on less voxels, the class parameters change and therefor the segmentation too.
To assess the influence of the ratio parameter, the deployment of the pipeline (until the brain segmentation), on the EGEE production grid using MOTEUR [8] as interface, will be presented. First, the brain segmenta-tion algorithm will be acquainting as well as grid and MOTEUR tools. Then, the deployment of the pipeline will be described and validated. Finally, the grid will be used to assess the influence of the ratio parameter on the algorithm.
2
The Brain MRI segmentation pipeline: a preliminary step towards MS-lesions
detection
The segmentation and the characterization of healthy tissues in multi-spectral MRI is the first step in order to separate them from lesions. This section describes the pipeline used for the brain segmentation.
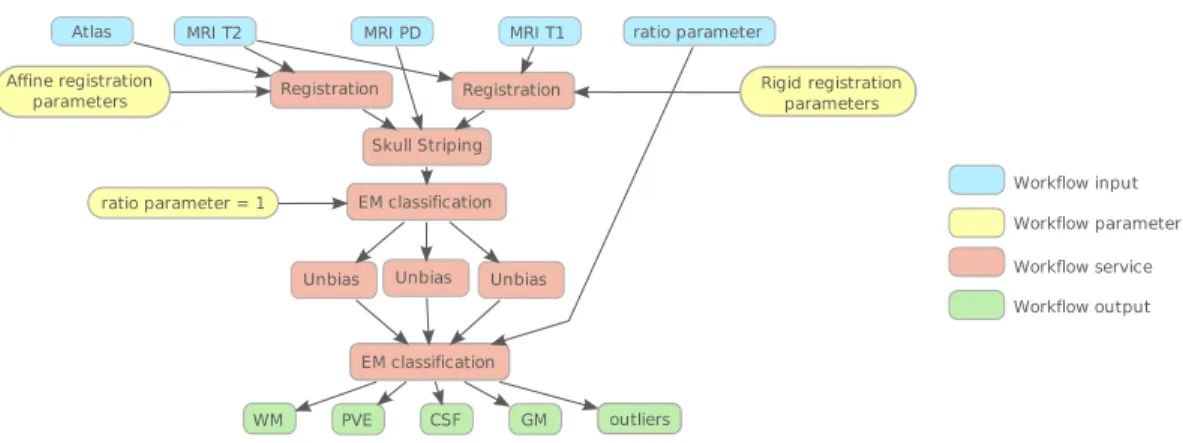
The database of patient images is consistent: Each patient data set is composed by MRI sequences T1, T2 and Proton Density (PD) weights. The data is processed following the pipeline illustrated by Figure1. We detail here the main sub-processes.
Registration T2 and PD sequences are intrinsically co-registered but this is not the case of T1 which has moreover a higher resolution. To limit partial volume effect caused by the re-sampling, a rigid registration of T1 on T2 is performed using the algorithm described in [14]. Furthermore, the classification algorithm needs initial values of the probability of each voxel to belong to one of the healthy tissue compartment. This is given by the MNI atlas2but imply an affine registration of the atlas on the patient data.
Skull-stripping To isolate brain healthy compartments, the skull-striping method described in [4] is applied.
Expectation Maximization The first call to the EM-classification in our pipeline is for the intensity normal-ization. MRI images are often affected by bias [17]. A first classification (with the EM framework) of the brain into WM, GM and CSF classes is realized without bias compensation. From these segmentations, the parameters of the bias field are computed.
Later, the EM framework is used once again to classify brain MRI voxels from unbiased images. The EM algorithm gives the probability for each voxel to belong to each class. To obtain binary segmentations, each voxel is classified to the most probable class.
Unbias Using parameters extracted from the first EM classification, intensities are corrected using the Expectation Maximization (EM) framework described in [16].
Pernod et al. MS Brain MRI Segmentation Workflow deployment on the EGEE Grid 57
3
The EGEE grid and MOTEUR
A grid is a network of shared computing and storage resources connected in a grid topology [6]. In this paper, experiments were done on the EGEE production grid3(Enabling Grid for E-sciencE), the largest multi-disciplinary grid infrastructure in the world, which connects more than 68000 CPUs to some 8000 users.
We express pipelines as workflows of services, described in the Scufl language (using the Taverna de-signer [13]). Each service corresponds to one of the sub-process described earlier and presents inputs and outputs that are connected together.
A Web-Service Description Language (WSDL) file describes a Web-Service by specifying two kinds of XML tags: Tags describing what has to be invoke and tags describing how to invoke it. In our framework, a generic web service description is used. Then, services are wrapped using a Generic Application Service Wrapper (GASW) [7].
Operators acting on the data flow itself define the iteration strategies over the input port of a service. In fact, when a service owns two inputs or more, an iteration strategy defines how to compose data from different inputs. Two different data composition operators have to be considered: the one-to-one (Dot operator) and the all-to-all (Cross operator) data composition operator [12].
The services are executed on the EGEE grid through the MOTEUR enactment engine [8], hiding to the user the complexity of individual services submissions and management.
The MOTEUR enactment engine allows three different kind of parallelism that are relevant for our applica-tion:
• Workflow parallelism which corresponds to the execution of two self-supporting services on two
independent data (the different images can be unbiased in parallel).
• Data parallelism which corresponds to the competitor execution of independent data by a single
ser-vice (the EM-classification using ratio parameter p1 can be run in parallel of the EM-classification using ratio parameter p2).
• Service parallelism which corresponds to the concurrent execution of two independent data items by
two services linked by a precedence constraint (the first EM-classification using parameter p1can be run in parallel with the skull-stripping of data from next patient).
4
Gridification of the application
This section describes the creation of the MS brain MRI segmentation workflow step by step, from the used pipeline to the executable workflow. Then results validations and time performances are proposed. And finally, thanks to the possibility of large multiple executions given by the grid, a study of the influence of the ratio parameters (from the classification step2) on the results has been done.
4.1 Creation of the workflow
For enabling the execution of services workflow, it is first necessarily to describe our pipeline as a workflow. Concretely, the pipeline has to be splitted into services correctly linked together. Then, iteration strategies have to be described between services in order to structure the workflow.
Splitting the pipeline The brain segmentation pipeline has been divided into different blocks, reflecting the description given in2and the already existing division of the pipeline in different legacy applications. For each block, inputs and outputs have clearly been defined, in order to define the corresponding service.
Web-service generation For each service, a Scufl file has been created including: an enumeration of inputs and outputs, as well as the name and the localization of the binary file, corresponding to this service. And if necessarily the name and the localization of the shell file script encapsuling the binary file.
In practice additional shell scripts are needed in some cases. In fact, binary files may have many outputs or may take fixed filenames as inputs. However, for MOTEUR, outputs from a service have to be listed and are automatically renamed. Consequently, shell scripts provide a good solution to overcome these problems. Furthermore, this is also helpful in case of different calls of the same service’s definition. For example, three registrations are needed for the MS lesion segmentation algorithm2and they don’t have the same list of arguments. But only one description of the service is used with a text file (listing the parameters) as an additional input. Then, these files are read in the shell script in order to correctly execute the software.
Services validation Before any transformation of the pipeline into a workflow, a first validation of the services has been made. They all have been independently executed and tested on the grid.
These tests reveal that even if the software are written in a generic language like C++, compiling it directly on a Computing Element (CE) of the EGEE grid without shared libraries is highly advised to avoid any kind of execution problems.
Workflow structure creation Then, Taverna has been used to structure the workflow: images and parameters text files have been defined as inputs, the four different healthy compartments classes as outputs and all services have been correctly linked together and to their corresponding Web-Service description. Figure1
is a simplified scheme of the workflow.
Iteration strategies To allow consecutive execution of the workflow, each service input has been correctly composed with Dot and Cross product operators. Data concerning a patient, either workflow inputs or intermediate results, are composed with a dot product to avoid cross-road composition from images from one patient with images from another and are then composed with a cross product with others data. A tag is used in the input file to express the fact that tagged inputs are referring to the same patient. For example, in the case of the rigid registration of T1 on T2 sequence. Three different cases are possible with two patients (A and B):
• All inputs have the same tag. So they are composed by Dot products. In this case we will have in
inputs: {T 1A,T 1B}; {T 2A,T 2B} and {parametersA,parametersB}. And the results will be obtained
Pernod et al. MS Brain MRI Segmentation Workflow deployment on the EGEE Grid 59
Figure 1: Simplified workflow of the brain segmentation process: a preprocessing step for multiple sclerosis detection.
• T1 and T2 only have the same tag. So they have to be composed by a Dot product and then are
composed with a Cross product with the input parameters. In this case we will have in inputs:
{T 1A,T 1B}; {T 2A,T 2B} and {parameters}. And the results will be obtain from the compositions: {T 1A,T 2A,parameters} and {T 1B,T 2B,parameters}
• All inputs are composed with Cross product. In this case we will have in inputs: {T 1A,T 1B}; {T 2A,T 2B} and {parametersA,parametersB}. And the results will be obtain from the compositions: {T 1A,T 2A,parametersA}; {T 1A,T 2A,parametersB}; {T 1A,T 2B,parametersA};
{T 1A,T 2B,parametersB}; {T 1B,T 2A,parametersA}; {T 1B,T 2A,parametersB}; {T 1B,T 2B,parametersA} and {T 1B,T 2B,parametersB}
4.2 Workflow execution and validation
In this section, we compare results obtained locally and from the grid. For this purpose, a ratio parameter equal to 1 has been used (all voxels from the image are taken for the maximization step cf. 4.3) and execu-tions were done with images of 256×256×64 voxels for T2 and PD sequences and 256×256×152 for T1
sequence (see Figure2). We verified that the results are absolutely identical.
Figure 2: Output binary segmentations from the workflow on the EGEE grid : a) White matter, b) Grey matter, c) CSF, d) PVE.
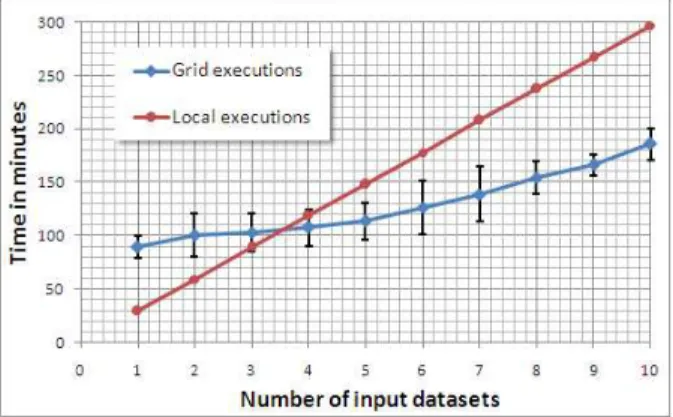
Time performance Local executions have been done on a 2.0 GHz computer. We report the mean value over many “one-patient executions”. As expected the local execution time evolves linearly in function of the number of input datasets (Figure3). This is not the case for grid execution time. First, the execution time of the workflow can change depending on the resources availability and variations. To address this point, the workflow has been run several time on the same number of input datasets and the mean value has been com-puted. Secondly, the execution time is not constant (as it could be expected in case of complete parallelism). Indeed, the multiplication of inputs generate more transfers, so waiting time is more consequent. We can observe that for this application, using the grid appear to be efficient for more than 5 or 6 input datasets.
Figure 3: Mean execution time and its variations with respect of the number of input datasets. Compar-ison between local execution on a single computer and EGEE grid executions. Concerning EGEE grid executions, all points have been computed 3 times in order to compensate the workload variations.
Potential issues The EGEE grid is actually using the gLite middleware4which provides a framework for building grid applications. In this framework, the Resource Broker (RB) is among others in charge of accepting user jobs and then assigning them to the most appropriate CE. This choice is done by selecting CE which, first fulfill the requirements expressed by the user and then have the highest rank. On the EGEE grid, it appears that the rank is reflecting the response time of a CE. This choice can be discussed because the fastest responding CE is not necessarily the most powerful one, and above all, not necessarily directly available. Hence the workload management becomes sometimes a bottleneck for our application.
Moreover, the workload on the EGEE grid is highly variable thus leading to high and variable latencies and many faults, impacting the total execution time. After a delay, jobs have to be canceled and resubmitted. Optimizing job submission strategies is still on a research stage [10].
Of course, in between single computer and production grid, we could have envisaged the use of a cluster, improving the execution time for several (5 or 6) datasets without encountering production grid problems. However, this is not in our scope for different reasons. The first reason is we have in focus to be able to support large databases of patients; increasing the number of patients will conduct to cluster saturation. The second reason is that we are targeting final users that do not necessary have access to a cluster, even for small extend experiments; managing a grid access is thus a solution.
Pernod et al. MS Brain MRI Segmentation Workflow deployment on the EGEE Grid 61
4.3 Application
In the EM step the maximization consists in the estimation of the Gaussian parameters for each healthy tissue compartment class. These assessments are computed from the voxels intensities of the MRI. A ratio parameter define the fraction of voxel to be used (e.g. if the ratio is equal to 1 then the 100% of the voxel is considered). In this part, we will use the percentage of voxels considered. The relation between this percentage and the ratio is given by equation1:
percentage of voxel considered = 100∗ratio parameter1 (1) In this section, we are targeting to assess the influence of ratio parameter on the pipeline results (Figure
2). In fact, by taking only a part of the image voxel, the speed of the algorithm could be improved but it could also affect the accuracy of the resulting segmentations. This is reason for studying the relationship between this parameter and the compromise between accuracy and speed is interesting for further works. To quantitatively evaluate this impact, WM segmentations have been generated for different ratio and have been compared to the segmentation of reference (i.e. ratio equal to 1) by computing the sensitivity and the specificity described in equation2:
sensibility = true positives
true positives+false negatives
specificity = true negatives
true negatives+false positives
(2)
Executions This experiment was made on images from two different patients affected by Relaps-ing/Remitting Multiple Sclerosis and one normal subject. The results of this experiment are similar. The graphic presented as illustration of this section was obtained from one MS patient.
It is important to underline that voxels are chosen randomly in the 3D image. Consequently, different results can be obtained for a same ratio parameter. To minimize the influence of this effect, many executions have been done and means values of the sensibility and the specificity have been computed. The Figure4displays these values in function of the percentage of voxel considered with the variations around mean values. For this application, the power of the grid provides an efficient help to generate all the results (9 executions per ratio value). Indeed, the ratio parameter was written in an input parameter text file and has been as-similated as a relative to the patient (see Figure1). Acting this way allows us to test all the different ratio parameters with each patient’s MRI (case 1 of the iteration strategies in4.1).
Discussion Due to the skull-stripping step, the segmentation of the different healthy compartments is done on approximately 830.000 voxels. On Figure 4, we observe that the sensibility is decreasing while the percentage of voxels considered is decreasing. The specificity is more stable but those two quantities are more and more variable. Taking less than 1% of the voxels in our algorithm leads to results with too high variability: we cannot accept that different execution (with random voxel selections) lead to different results. First, in this case, a WM segmentation with a specificity of 100% would mean that each voxel defined as belonging to (resp. not to) the white matter is really belonging to (resp. not to) the white matter in the segmentation of reference. But this doesn’t mean that our segmentation results are accurate for low percentage ratio. Indeed, in our case, specificity and accuracy should not be confused because there are far more true negatives (voxels out of brain) than true positives (voxels really belonging to WM).
Figure 4: Mean sensibility and specificity of white matter segmentations in function of the percentage of voxel considered, and their variations. Each point corresponds to a mean of 9 executions (where voxels are randomly chosen).
Secondly, the drastic decrease of the sensibility means an increase of the number of false negative which corresponds to the voxel really belonging to the WM but not labelled as such. This reveals that after a certain threshold value of the ratio, there are not enough voxels any more in order to be able to define the Gaussian class parameter from the class estimation step of the EM.
Finally, these results reveal that using only 1% of the voxels of the image in the Expectation Maximization method would divide its execution time by 3 or 4 (compared to the execution with 100% of the voxels), without impacting the WM segmentation quality (Figure5).
Figure 5: White matter binary segmentations from the workflow for different ratio percentage values : a) 100%, b) 0.2%, c) 0.002%.
5
Conclusion and future work
In this paper, a description of our method of brain segmentation into healthy compartments classes and its deployment on the EGEE grid has been presented. Experiments demonstrate that this application is well adapted to grid and provide a sizeable gain of time in multiple executions. Results of the workflow have been confronted to local results and have been successfully validated. Moreover, the power of the grid allows us to test the limit of our method of segmentation in order to improve the algorithm speed.
Pernod et al. MS Brain MRI Segmentation Workflow deployment on the EGEE Grid 63
affect severely the estimation of the Gaussian class parameter until a critical value. Thus, if needed, the brain healthy compartments classes could be generated faster while keeping a good accuracy. Indeed, tests have been repetitively done on a same patient with different value of the ratio of voxels and segmentation have been then compared.
The result of this experiment may be used for the following step which is the deployment of the segmenta-tion of MS lesion, in the framework of the project NeuroLOG. This applicasegmenta-tion is using the brain healthy compartments classes to segment lesion on the T2-FLAIR sequence. Future work will also improve the workflow execution speed on the grid, regrouping small services (to lower the number of resource requests) and testing different gLite parameters to increase the performance.
Acknowledgment
This work is funded by the French National Research Agency (ANR), NeuroLOG project, under contract number ANR-06-TLOG-024.
References
[1] J. M. Alonso, Jr. Ferrero, V. Hern´andez, G. Molt´o, J. Saiz, and B. Tr´enor. A grid computing-based approach for the acceleration of simulations in cardiology. Information Technology in Biomedicine,
IEEE Transactions on, 12:138–144, 2008. 1
[2] G. Dugas-Phocion, M. ´Angel G. Ballester, G. Malandain, C. Lebrun, and N. Ayache. Improved EM-based tissue segmentation and partial volume effect quantification in multi-sequence brain MRI. In
Proc. of MICCAI’04. Springer LNCS 3216, 2004. 1
[3] Guillaume Dugas-Phocion. Segmentation d’IRM C´er´ebrales Multi-S´equences et Application `a la Scl´erose en Plaques. PhD thesis, ´Ecole des Mines de Paris, March 2006. 1
[4] Guillaume Dugas-Phocion, Miguel ´Angel Gonz´alez Ballester, Christine Lebrun, St´ephane Chanalet, Caroline Bensa, Gr´egoire Malandain, and Nicholas Ayache. Hierarchical segmentation of multiple sclerosis lesions in multi-sequence MRI. In International Symposium on Biomedical Imaging: From
Nano to Macro (ISBI’04), Arlington, VA, USA, April 2004. IEEE. 2
[5] Massimo Filippi, Marco Rovaris, Matilde Inglese, Frederik Barkhof, Nicola De Stefano, Steve Smith, and Giancarlo Comi. Interferon beta-1a for brain tissue loss in patients at presentation with syn-dromes suggestive of multiple sclerosis: a randomised, double-blind, placebo-controlled trial. Lancet, 364(9444):1489–96, October 2004. 1
[6] Ian Foster, Carl Kesselman, and Steven Tuecke. The anatomy of the grid: Enabling scalable virtual organizations. International Jounral of Supercomputer Applications, 15(3), 2001. 3
[7] Tristan Glatard, David Emsellem, and Johan Montagnat. Generic web service wrapper for efficient embedding of legacy codes in service-based workflows. In Grid-Enabling Legacy Applications and
Supporting End Users Workshop (GELA’06), Paris, France, June 19-23, 2006. 3
[8] Tristan Glatard, Johan Montagnat, and Xavier Pennec. Efficient services composition for grid-enabled data-intensive applications. In Proceedings of the IEEE International Symposium on High Performance
[9] Tristan Glatard, Xavier Pennec, and Johan Montagnat. Performance evaluation of grid-enabled reg-istration algorithms using bronze-standards. In Proc. of the 9th International Conference on Medical
Image Computing and Computer Assisted Intervention (MICCAI’06), Part II, number 4191 in LNCS,
pages 152–160. Springer, 2-4 October 2006. PMID: 17354767. 1
[10] Diane Lingrand, Johan Montagnat, and Tristan Glatard. Estimating the execution context for refining submission strategies on production grids. In Workshop ASSESS / Modern BIO (CCgrid’08), pages 753 – 758, Lyon, May 2008. IEEE.4.2
[11] Johan Montagnat, Alban Gaignard, Diane Lingrand, Javier Rojas Balderrama, Philippe Collet, and Philippe Lahire. NeuroLOG: a community-driven middleware design. In HealthGrid, Chicago, June 2008. IOS Press. 1
[12] Johan Montagnat, Tristan Glatard, and Diane Lingrand. Data composition patterns in service-based workflows. In Workshop on Workflows in Support of Large-Scale Science (WORKS’06), Paris, France, June 2006.3
[13] Tom Oinn, Matthew Addis, Justin Ferris, Darren Marvin, Martin Senger, Mark Greenwood, Tim Carver, Kevin Glover, Matthew R. Pocock, Anil Wipat, and Peter Li. Taverna: a tool for the com-position and enactment of bioinformatics workflows. Bioinformatics, 20(17):3045–3054, 2004.3
[14] S. Ourselin, A. Roche, S. Prima, and N. Ayache. Block matching: A general framework to improve robustness of rigid registration of medical images. In A.M. DiGioia and S. Delp, editors, Third
Inter-national Conference on Medical Robotics, Imaging And Computer Assisted Surgery (MICCAI 2000),
volume 1935 of Lectures Notes in Computer Science, pages 557–566, Pittsburgh, Penn, USA, octobre 11-14 2000. Springer. 2
[15] C.H. Polman, S.C. Reingold, G. Edan, M. Filippi, H-P. Hartung, L. Kappos, F.D. Lublin, L.M. Metz, H.F. McFarland, P.W. O’connor, M. Sandberg-Wollheim, A.J. Thompson, B.G. Weinshenker, and J.S. Wolinsky. Diagnostic criteria for multiple sclerosis: 2005 revisions to the ”Mc Donald Criteria”. Ann
Neurol, 58(6):840–6, 2005.1
[16] S. Prima, N. Ayache, T. Barrick, and N. Roberts. Maximum likelihood estimation of the bias field in MR brain images: Investigating different modelings of the imaging process. In W.J. Niessen and M.A. Viergever, editors, 4th Int. Conf. on Medical Image Computing and Computer-Assisted Intervention
(MICCAI’01), volume LNCS 2208, pages 811–819, Utrecht, The Netherlands, Oct. 2001. 2
[17] J.G. Sled, A.P. Zijdenbos, and A.C. Evans. A nonparametric method for automatic correction of intensity nonuniformity in MRI data. IEEE Trans Med Imaging, 17(1):87–97, 1998. 2
[18] Jean-Christophe Souplet, Christine Lebrun, St´ephane Chanalet, Nicholas Ayache, and Gr´egoire Ma-landain. Revue des approches de segmentation des l´esions de scl´erose en plaques dans les s´equences conventionnelles IRM. Revue Neurologique, 2008.1