HAL Id: inserm-00426438
https://www.hal.inserm.fr/inserm-00426438
Submitted on 2 Aug 2010HAL is a multi-disciplinary open access
archive for the deposit and dissemination of sci-entific research documents, whether they are pub-lished or not. The documents may come from teaching and research institutions in France or abroad, or from public or private research centers.
L’archive ouverte pluridisciplinaire HAL, est destinée au dépôt et à la diffusion de documents scientifiques de niveau recherche, publiés ou non, émanant des établissements d’enseignement et de recherche français ou étrangers, des laboratoires publics ou privés.
Mika Kivimäki, G David Batty, Archana Singh-Manoux, Hermann Nabi,
Séverine Sabia, Adam Tabak, Tasnime Akbaraly, Jussi Vahtera, Michael
Marmot, Markus Jokela
To cite this version:
Mika Kivimäki, G David Batty, Archana Singh-Manoux, Hermann Nabi, Séverine Sabia, et al.. Asso-ciation between common mental disorder and obesity over the adult life course.. The British Journal of Psychiatry, 2009, 195 (2), pp.149-55. �10.1192/bjp.bp.108.057299�. �inserm-00426438�
Association between common mental disorder and obesity over the adult lifecourse
Mika Kivimäki, G. David Batty, Archana Singh-Manoux, Hermann Nabi, Séverine Sabia, Adam G. Tabak, Tasnime N. Akbaraly, Jussi Vahtera, Michael G. Marmot, Markus Jokela
WORD COUNT: Abstract 154, Text 3253 (excluding references, tables and figures), 46 references, 4 tables, 1 figure
Conflict of interest: No conflict of interest declared (MK, GDB, ASM, HN, SS, AGT, TNA, JV, MGM, MJ)
Mika Kivimäki, PhD, Archana Singh-Manoux, PhD, Tasnime N. Akbaraly, PhD, Adam G. Tabak, MD, PhD, Michael G. Marmot, PhD, Markus Jokela, PhD, Department of Epidemiology
and Public Health, University College London, UK; G. David Batty, PhD, MRC Social & Public Health Sciences Unit, University of Glasgow, Glasgow, UK; Archana Singh-Manoux, PhD,
Hermann Nabi, PhD, Severine Sabia, MSc, INSERM U687-IFR69, Hôpital Paul Brousse, Villejuif
Cedex, France; Mika Kivimäki, PhD, Jussi Vahtera, MD, Finnish Institute of Occupational Health, Helsinki, Finland; Adam G. Tabak, MD, PhD, Semmelweis University Faculty of Medicine, 1st Department of Medicine, Hungary.
Correspondence: Mika Kivimäki, Department of Epidemiology and Public Health, University
College London, 1-19 Torrington Place, WC1E 6BT London, United Kingdom. Tel: +44 207 679 8260; e-mail m.kivimaki@ucl.ac.uk
Background
Prospective data on the association between common mental disorders and obesity are scarce, and the impact of ageing on this association is poorly understood.
Aims
To examine the association between common mental disorders and obesity (BMI>30 kg/m2)
across the adult life course.
Methods
6832 men and 3348 women aged 35-55 were screened 4 times during a 19-year follow-up (the Whitehall II study). Each screening included measurements of mental disorders (the General Health Questionnaire), weight, and height.
Results
The excess risk of obesity in the presence of mental disorders increased with age (p=0.004). The estimated proportion of obese people was 5.7% at age 40 both in the presence and absence of mental disorders, but the corresponding figures were 34.6% and 27.1% at age 70. The excess risk did not vary by sex or according to ethnic group or socioeconomic position.
Conclusion
The association between common mental disorders and obesity becomes stronger at older ages.
Declaration of interests
Owing to their increasing prevalence, common mental disorders (such as symptoms of anxiety and depression) and obesity are widely regarded as major public health issues.1-3 Mental
disorders are associated with considerable disease burden4 5 and obesity is a leading cause of
preventable death and chronic disease.6 There is also some evidence to suggest that common
mental disorders and obesity may be related to one another, such that men and women with common mental disorders experience a higher risk of obesity than those free of such conditions,7-9 although this is not a universal finding.10 11
It remains unclear whether ageing affects the association between mental disorders and obesity, because the majority of previous studies are based on cross-sectional study design and the few published longitudinal studies do not include repeated measurements of both common mental disorders and obesity.12 13 Strengthening of the association between the two
disorders by increasing age is plausible as there is a continuity in both experiencing mental health problems and obesity, potentially leading to cumulated effects.14 Furthermore, chronic
pain and disabling physical conditions are more prevalent at older ages and may lead to both obesity and mental health problems.15-17
In the present study, multiple measurements of common mental disorders and obesity were taken over the adult life course from 35 to 74 years of age. These data therefore provide us the opportunity to examine the manner in which the association between common mental disorders and obesity develops with ageing in more detail than has previously been possible.
Methods Participants
Data are drawn from the British Whitehall II study. The target population was all London based office staff, aged 35-55, working in 20 civil service departments.18 With a response of
73%, the baseline cohort consisted of 10,308 employees (6,895 men and 3,413 women). The true response proportion was, in fact, higher because around 4% of those invited were not eligible for inclusion. Ethical approval for the Whitehall II study was obtained from the University College London Medical School committee on the ethics of human research.
Design
After the first medical examination (Phase 1 1985-1988), screenings by trained research staff were repeated 3 times over a 19-year period: Phase 3 (1991-1993), Phase 5 (1997-1999) and Phase 7 (2003-2004). All these phases included a standardised assessment of common mental disorders and a direct measurement of weight and height to determine obesity.
Measurements
We assessed common mental disorders using the self-administered 30-item General Health Questionnaire (GHQ), which focuses on self-reported symptoms of anxiety and depression, and associated psychosocial dysfunction.19 This device is designed as a screening instrument
for use in community settings. It has been validated against standardised clinical interviews and has shown high reliability.20 In each GHQ item an enquiry is made about a specific
symptom; the response categories are scored either 1 or 0 to indicate whether the symptom is present or not. On the basis of receiver operating characteristics analysis and previous studies, we defined people with a sum score 5 or more in GHQ as cases and those scoring 0-4 as non-cases.21 In the present study in which GHQ scores were validated against a Clinical Interview
Schedule, the sensitivity (73%) and specificity (78%) using this measure of ‘caseness’ was acceptable.21 GHQ-caseness showed temporal stability as the odds of being a case at phase 3
were 3.77 (95% CI 3.38 to 4.20) times higher for those who were cases already at phase 1 than for those who were not. The corresponding odds ratio was 4.11 (95% CI 3.62 to 4.67) for GHQ-caseness at phases 3 and 5 and 4.7 (95% CI 4.18 to 5.50) at phases 5 and 7 (all
p<0.0001).
Weight was measured in underwear to the nearest 0.1 kg on Soehnle electronic scales. Height was measured in bare feet to the nearest 1 mm using a stadiometer with the participant
standing erect with head in the Frankfurt plane. Reproducibility of the weight and height measurements over 1 month (ie between-subject variability/total (between + within subject) variability), undertaken on 306 participants, was 0.99 at phase 7 screening. We calculated BMI by dividing weight (in kilograms) by height (in meters) squared. Following the WHO definition, participants with BMI>30 kg/m2 were considered obese and those with BMI<30
non-obese.22
Other variables in this study were sex, ethnicity (Caucasian vs non-Caucasian) and, at each phase, age, marital status (married or cohabiting vs single, divorced or widow),
socioeconomic position, derived from the civil service employment grade, classified into high (upper administrator categories combined), intermediate (executive officer categories
combined) and low (clerical and office support staff), and use of psychotropic drugs (antidepressants, tranquilisers, sleeping pills, antipsychotics).
Statistical analysis
At each phase, the analytic sample included participants with complete data on GHQ-caseness and obesity. To examine the cross-sectional association between GHQ-caseness and obesity at each study phase we used logistic regression analysis, from which we report odds ratios to
summarise this relationship for the total cohort and separately for men and women. For the analyses of the prospective data, which are structured such that measurement times
(observations) are nested within individuals, we used multilevel logistic regression analysis based on generalized estimating equations (GEE) to model the association between GHQ-caseness and obesity across study phases. The status of GHQ-GHQ-caseness and obesity was allowed to change within subjects over time, i.e., these variables were modelled as time variant, and the analysis used all available measurements from every subject at all phases. Repeated measurements within individuals constitute a cluster and the calculation of standard errors takes into account the non-independence of the measurements; that is, the same
individual contributes more than one observation in the dataset and these observations are of course related. Odds ratios to summarise associations between GHQ-caseness and obesity were adjusted for age, sex, ethnicity, marital status, socioeconomic position and use of psychotropic drugs. To test the association between GHQ-caseness and obesity as a function of age, we included an interaction term 'GHQ-caseness*age' in a model including main effects. This model was used to develop growth curves estimating obesity prevalence for GHQ-cases and non-cases at each age with 95% confidence intervals. We also ran a series of sensitivity analyses. We compared the strength of the age-dependent association between GHQ and obesity before and after adjustment for birth year and study phase to examine whether this association was attributable to cohort effects or the impact of historical trends. As increased sample attrition at later study phases could introduce a healthy survivor bias, we repeated the analyses of age-dependent associations in a sub-cohort with no missing data for GHQ or obesity at any study phase. If results in these analyses were similar to those from the main analyses with all available data, this would provide evidence against a healthy survivor bias. To study whether the age-dependent association was specific to the BMI cut-point used
in defining obesity, we repeated the interaction test with continuous BMI as the outcome. All analyses were performed with Stata 9.0 statistical software, StataCorp LP, Texas, USA.
Results
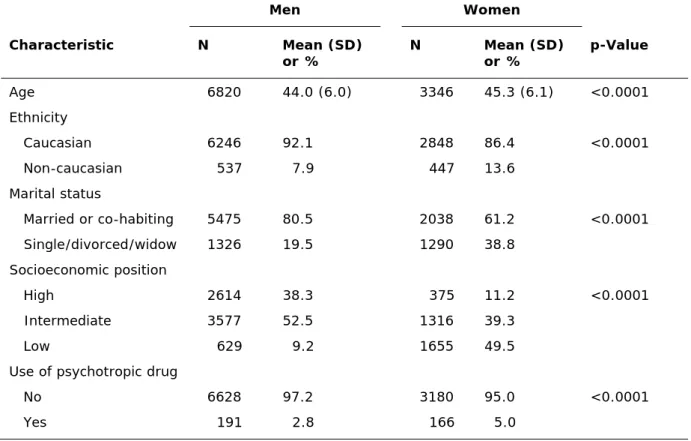
Of all 10,308 baseline cohort members, 10,166 (99%) had complete data on GHQ-caseness and obesity at Phase 1. Their mean age was 44.5 (SD 6.0) years, approximately two thirds were men, around 10% of the study sample were non-Caucasians and 3.5% reported being treated by psychotropic drug. Men were slightly older, less likely to be treated by
psychotropic drugs and were more often Caucasian, married and from high socioeconomic position than women (Table 1). At subsequent data collection phases, complete data on GHQ and obesity were obtained for 54% (the lowest, Phase 5) to 77% (the highest, Phase 3) of all baseline participants. GHQ-caseness at Phase 1 was not associated with having missing data on these measures at Phase 5 (odds ratio for missingness 1.00, 95% CI 0.92 to 1.09, p=0.96), but baseline obesity was associated with greater missing values (odds ratio 1.76, 95% CI 1.51 to 2.06, p<0.001).
The prevalence of GHQ-caseness was 27% at Phase 1, but declined to 22% at Phases 3 and 5 and was 20% at Phase 7. In contrast, there was a gradual increase in obesity prevalence from 7% at Phase 1 to 19% at Phase 7. These trends in GHQ-caseness and obesity were broadly similar for men and women (table 2). They were also replicated in a sub-cohort of
participants with no missing data on GHQ or obesity at any of the four study phases (n = 4,364).
The association between GHQ-caseness and obesity strengthened at each successive study phase with the age- and sex-adjusted odds ratio (OR) being 1.10 (95% confidence interval
0.93 to 1.31) at Phase 1, 1.12 (0.94 to 1.34) at Phase 3, 1.18 (0.99 to 1.42) at Phase 5 and 1.34 (1.15 to 1.56) at Phase 7. As shown in Table 3, there were no large differences in the strength of the association between men and women and in both sexes the association was stronger at the last follow-up than at baseline. Adjustment for ethnicity, marital status, socioeconomic position and treatment by psychotropic drugs had little effect on these associations.
Multilevel analysis
The age-adjusted odds of being obese was 13% higher for GHQ-cases than non-cases in men (OR = 1.13, 95% confidence interval 1.03 to 1.25) and 11% higher in women (OR = 1.11, 95% confidence interval 1.00 to 1.23) across all of the study phases. There was no evidence to suggest that this association differed between men and women (p = 0.92 for GHQ*sex
interaction) or according to ethnicity (p = 0.67), marital status (p = 0.72), or socioeconomic position (p = 0.82).
Table 4 shows multivariably adjusted analyses of the GHQ-obesity association for men and women analysed together. The age- and sex-adjusted odds ratio for this association was 1.12 (model A) and further adjustment for ethnicity, marital status, socioeconomic position and use of psychotropic drugs had little effect on this odds ratio (model B). However, a statistically significant GHQ*age interaction term shows that the association between GHQ and obesity was dependent on age (model C). There was no evidence to suggest that this age-dependent effect differed between men and women (p = 0.33 for ‘GHQ*age*sex’ term in a model including main effects and two-way interactions).
To illustrate the interaction between GHQ and age on obesity, figure 1 shows proportions of obese individuals by GHQ-caseness as a function of age (proportions are estimated based on a
model including age, sex, GHQ-caseness and GHQ*age interaction term as independent variables). There was a general rising trend in obesity by age. Within this general trend there was also a growing divergence in obesity prevalence between GHQ-cases and non-cases. For example, the estimated proportion of obese people was 5.7% at age 40 both in GHQ-cases and non-cases (OR = 1.00); however, by age 70, this had risen to 34.6% of GHQ-cases and 27.1% of non-cases (OR = 1.42). In men, the estimated obesity prevalence was 4.4% among the GHQ-cases and 4.8% among the non-cases at age 40 (OR = 0.91), but 30.8% and 23.4% at age 70 (OR = 1.46). The corresponding figures for women were 8.8% vs. 8.7% at age 40 (OR = 1.01) and 41.0% vs. 35.8% at age 70 (OR = 1.25).
Sensitivity analysis
The interaction term of 'GHQ-caseness * age' with obesity as the outcome was little affected by adjustment for birth year and study phase and remained statistically significant (p<0.02 after both adjustments), suggesting that cohort and historical effects are unlikely to explain our results. There was no evidence of a 'healthy survivor' bias as the statistically significant interaction between GHQ and age on obesity was also found in a sub-cohort with no missing data in GHQ or obesity at any of the study phases (p for interaction = 0.005, n = 4363). Furthermore, the growth curves were very similar as those in the main analysis with all available data. Finally, repeating multilevel analysis with continuous BMI as the outcome showed a significant GHQ*age interaction term both in men (p<0.0001) and women (p = 0.05), confirming that the age-dependent association between GHQ-caseness and obesity was not sensitive to the specific cut-off for BMI used to define obesity.
Discussion
Although ageing is a complex phenomenon involving a range of psychological and physiological changes, the evidence from this 19-year 4-wave study, in fact, suggests a relatively simple overall effect of age on the association between common mental disorders and obesity. We found that people with common mental disorders have an excess risk of obesity and there was no strong evidence of sex or ethnic differences in this association. The excess obesity risk strengthened with age: irrespective of mental health status, about 6% were obese at age 40, but by age 70 the corresponding prevalence rose to 35% in people with common mental disorders and to 27% in others. This finding emphasises the role of common mental disorders in the risk of obesity at older ages.
Comparison with previous studies
Our study is probably the largest longitudinal investigation of the effect of age on the
association between common mental disorders and obesity. Previous studies on this issue are based mostly on cross-sectional comparisons between age groups, they do not include
multiple measurements of both common mental disorders and obesity, and they show mixed findings.7 Such data may not accurately reflect longitudinal trends. We did not found strong
evidence of sex, ethnic or socioeconomic differences in the association between common mental disorders and obesity risk. Although sex and ethnic differences have been reported in some previous studies,11 a large survey of a nationally representative sample of US adults
found, in agreement with our findings, an association between psychiatric disorders and obesity that was equally strong for men and women.23
Our target group was an occupational cohort and therefore likely to be healthier than a general population. We adopted the view that common mental disorders in such samples are validly
represented as a single dimension combining symptoms of anxiety and depression.24-26
Measuring common mental disorders is particularly relevant in community-based samples, such as ours, as mental disorders in the community are frequently characterized by co-morbidity between the disorders and by shifting patterns of symptoms that resist precise clinical classification.24 25 27 The use of such a composite outcome, such as ours, is supported
by studies showing anxiety disorders and mood disorders (depression) to be equally related to excess risk of obesity.23
Across age groups, the odds of being obese was 1.12 times higher for people with common mental disorders than for others. This estimate is smaller than the odds ratios of over 1.20 typically found for obesity in individuals with specific diagnosed mental disorders in general populations.23 28 Factors that can cause this discrepancy in risk estimates between our cohort
and the previous studies include differences in the target group (occupational cohort study vs. general population sample), the definition of mental disorders (GHQ symptoms scale vs. other screening measures and clinical interview), and the assessment of obesity (measured vs. self-reported weight and height).
Plausible mechanisms
Common mental disorders can be a cause and a consequence of obesity and a number of plausible mechanisms may underlie these bidirectional associations, presenting cumulated effects with increasing age. Firstly, common mental disorders are associated with eating disorders, both over- and under-consumption, which could influence future changes in adiposity. Exercise has been found to improve depressive symptoms among those with a diagnosis of depression,29 but physical inactivity, a major contributing factor to obesity, is
pharmacologic treatments for depression have known side-effects that may result in weight gain (tricyclic antidepressants), weight loss (selective serotonin reuptake inhibitors, SSRIs) or both (short- and long-term effects of SSRIs).30-32
Secondly, it is plausible that the direction of the association may also be from obesity to increased future risk of common mental disorder, with adverse effects being more likely in societies where obesity is stigmatised.33 Internalization of negative obesity-related
stereotypes, negative self-body image and unsuccessful weight control by dieting are related to increased risk of mental ill health among obese individuals.34-36 Biological factors, such as
dysregulation of the hypothalamic-pituitary-adrenocortical (HPA) system, may further strengthen the link from obesity to depression.37-39 There is some evidence of abnormal
hormone concentrations of the HPA axis among obese people with and without co-existing depressive symptoms,40 41 and among obese with binge eating disorder.42 Furthermore, studies
show remission in depressive symptoms following surgically induced weight loss among obese patients.43 44
Thirdly, 'common cause' may contribute to the age-dependent association between mental disorders and obesity as chronic bodily pain and disabling sensory and physical conditions are increasingly common at older ages and contribute to both obesity prevalence and common psychiatric disorders.15-17 Underlying disability that accompanies ageing may therefore
reinforce the association between mental health and obesity at older ages.
Study strengths and limitations
Our study is unique in having four measurements of both common mental disorders and obesity across the adult life course. An advantage of such design, compared to cross-sectional
studies, is the possibility of conducting multilevel analyses that not only use information about differences between subjects but also exploit data from the same individuals at different ages. The large sample size and direct measurements of height and weight are also particular strengths of the present study. However, several limitations should be taken into account when interpreting the findings: First, our cohort of civil servants do not include blue collar workers or unemployed people and is therefore not representative of the general population, which potentially limits the generalisability of our findings. Nevertheless, we are not aware of reasons why the age-related strengthening of the association between mental health problems and obesity would be specific to employed people. Second, sample loss due to missing data varied between 1% and 47% depending on study phase and obesity at baseline predicted subsequent non-participation. However, increasing non-participation across successive study phases is not a plausible explanation of the observed age-dependent associations because the findings were reproducible in a sub-cohort with full data at every study phase. Third, common mental disorders were measured using a validated symptom scale, the General Health
Questionnaire that is not a measure of clinically recognised psychiatric disorder.19 Although
the symptom scale is reliable we cannot be certain that our findings would be directly
transferable to patients meeting the DSM-IV or ICD-10 criteria for specific mental disorders, such as major depressive disorder or anxiety disorders. Furthermore, the symptom scale does not measure severity. Fourth, waist circumference and waist hip ratio were not assessed at all the four phases. Thus, it remains unclear whether the age-dependent association of common mental disorders is specific to general obesity or also observable in relation to central obesity and related HPA axis disturbances.40 45 Further research on these issues is needed.
Evidence from a well-characterised occupational cohort shows that the association between common mental disorders and obesity strengthens with age. Given that people aged 65+ is the fastest growing age group worldwide,46 we recommend that this finding is taken into account
both in the prevention of obesity and treatment of mental disorders in ageing populations. Diet and physical activity are central to weight management emphasising the relevance of health policies that improve the opportunities to weight control for older people (e.g. provision of nutrition guidance, availability of exercise places, reimbursement of weight control
treatments, and effective prevention of physical impairments and pain that may increase risk of obesity and distress). There is also a need for more detailed clinical guidelines to help physicians prevent and treat obesity among adults with mental disorders, and promote mental health among obese individuals of older age.
CLINICAL IMPLICATIONS
People with common mental disorders may be at increased risk of obesity.
The excess obesity risk associated with common mental disorders is greater at older ages.
There was no strong evidence to suggest that this association differs between men and women or according to ethnic group or socioeconomic position.
LIMITATIONS
Findings from occupational cohort are not necessarily generalisable to general or clinical populations.
Common mental disorders were assessed using a self-report symptom scale (General Heath Questionnaire) rather than a standardised clinical interview.
Such assessment does not distinguish between specific disorders or indicate their severity.
Acknowledgements
The Whitehall II study has been supported by grants from the Medical Research Council; British Heart Foundation; Health and Safety Executive; Department of Health; National Heart Lung and Blood Institute (HL36310), US, NIH: National Institute on Aging (AG13196), US, NIH; Agency for Health Care Policy Research (HS06516); and the John D and Catherine T MacArthur Foundation Research Networks on Successful Midlife Development and Socio-economic Status and Health. M. K. and J. V. are supported by the Academy of Finland (Projects no. 117604, 124322); G. D. B. is a Wellcome Trust Research Fellow; A. S.-M. is supported by a ‘EURYI’ award from the European Science Foundation; and M. G. M. is supported by a MRC Research Professorship.
References
1 Kopelman PG. Obesity as a medical problem. Nature 2000; 404: 635-43.
2 Compton WM, Conway KP, Stinson FS, Grant BF. Changes in the prevalence of major depression and comorbid substance use disorders in the United States between 1991-1992 and 2001-2002. Am J Psychiatry 2006; 163: 2141-7.
3 Mathers CD, Loncar D. Projections of global mortality and burden of disease from 2002 to 2030. PLoS Med 2006; 3: e442.
4 Penninx BW, Beekman AT, Honig A, Deeg DJ, Schoevers RA, van Eijk JT, et al. Depression and cardiac mortality: results from a community-based longitudinal study. Arch Gen
Psychiatry 2001; 58: 221-7.
5 Everson SA, Roberts RE, Goldberg DE, Kaplan GA. Depressive symptoms and increased risk of stroke mortality over a 29-year period. Arch Intern Med 1998; 158: 1133-8.
6 Must A, Spadano J, Coakley EH, Field AE, Colditz G, Dietz WH. The disease burden associated with overweight and obesity. JAMA 1999; 282: 1523-9.
7 McElroy SL, Kotwal R, Malhotra S, Nelson EB, Keck PE, Nemeroff CB. Are mood disorders and obesity related? A review for the mental health professional. J Clin Psychiatry 2004; 65: 634-51.
8 Simon GE, Von Korff M, Saunders K, Miglioretti DL, Crane PK, van Belle G, et al.
Association between obesity and psychiatric disorders in the US adult population. Arch Gen Psychiatry 2006; 63: 824-30.
9 Farmer A, Korszun A, Owen MJ, Craddock N, Jones L, Jones I, et al. Medical disorders in people with recurrent depression. Br J Psychiatry 2008; 192: 351-5.
10 Carpenter KM, Hasin DS, Allison DB, Faith MS. Relationships between obesity and DSM-IV major depressive disorder, suicide ideation, and suicide attempts: results from a general population study. Am J Public Health 2000; 90: 251-7.
11 Heo M, Pietrobelli A, Fontaine KR, Sirey JA, Faith MS. Depressive mood and obesity in US adults: comparison and moderation by sex, age, and race. Int J Obes (Lond) 2006; 30: 513-9.
12 Pine DS, Cohen P, Brook J, Coplan JD. Psychiatric symptoms in adolescence as predictors of obesity in early adulthood: a longitudinal study. Am J Public Health 1997; 87: 1303-10.
13 Pine DS, Goldstein RB, Wolk S, Weissman MM. The association between childhood depression and adulthood body mass index. Pediatrics 2001; 107: 1049-56.
14 Kessler RC, Berglund P, Demler O, Jin R, Merikangas KR, Walters EE. Lifetime prevalence and age-of-onset distributions of DSM-IV disorders in the National Comorbidity Survey Replication. Arch Gen Psychiatry 2005; 62: 593-602.
15 Weil E, Wachterman M, McCarthy EP, Davis RB, O'Day B, Iezzoni LI, et al. Obesity among adults with disabling conditions. JAMA 2002; 288: 1265-8.
16 Heim N, Snijder MB, Deeg DJ, Seidell JC, Visser M. Obesity in older adults is associated with an increased prevalence and incidence of pain. Obesity (Silver Spring) 2008 (epub ahead of print).
17 Chen J, Devine A, Dick IM, Dhaliwal SS, Prince RL. Prevalence of lower extremity pain and its association with functionality and quality of life in elderly women in Australia. J
Rheumatol 2003; 30: 2689-93.
18 Marmot M, Brunner E. Cohort Profile: the Whitehall II study. Int J Epidemiol 2005; 34: 251-6.
19 Goldberg DP. Detecting Pychiatric Illness by Questionnaire. London: Oxford University Press, 1972.
20 Pevalin DJ. Multiple applications of the GHQ-12 in a general population sample: an investigation of long-term retest effects. Soc Psychiatry Psychiatr Epidemiol 2000; 35: 508-12.
21 Stansfeld SA, Marmot MG. Social class and minor psychiatric disorder in British Civil Servants: a validated screening survey using the General Health Questionnaire. Psychol Med 1992; 22: 739-49.
22 WHO. Physical status: the use and interpretation of anthropometry: report of a WHO expert committee. WHO Technical Report Series. Geneva: World Health Organization, 1995.
23 Simon GE, Fleck M, Lucas R, Bushnell DM. Prevalence and predictors of depression treatment in an international primary care study. Am J Psychiatry 2004; 161: 1626-34.
24 Krueger RF. The structure of common mental disorders. Arch Gen Psychiatry 1999; 56: 921-6.
25 Vollebergh WA, Iedema J, Bijl RV, de Graaf R, Smit F, Ormel J. The structure and stability of common mental disorders: the NEMESIS study. Arch Gen Psychiatry 2001; 58: 597-603.
26 Kendell R, Jablensky A. Distinguishing between the validity and utility of psychiatric diagnoses. Am J Psychiatry 2003; 160: 4-12.
27 Prince M, Patel V, Saxena S, Maj M, Maselko J, Phillips MR, et al. No health without mental health. Lancet 2007; 370: 859-77.
28 Petry NM, Barry D, Pietrzak RH, Wagner JA. Overweight and obesity are associated with psychiatric disorders: results from the National Epidemiologic Survey on Alcohol and Related Conditions. Psychosom Med 2008; 70: 288-97.
29 Mead GE, Morley W, Campbell P, Greig CA, McMurdo M, Lawlor DA. Exercise for depression. Cochrane Database Syst Rev 2008: CD004366.
30 Rapaport MH, Thase ME. Translating the evidence on atypical depression into clinical practice. J Clin Psychiatry 2007; 68: e11.
31 Sussman N, Ginsberg DL, Bikoff J. Effects of nefazodone on body weight: a pooled analysis of selective serotonin reuptake inhibitor- and imipramine-controlled trials. J Clin Psychiatry 2001; 62: 256-60.
32 Demyttenaere K, Jaspers L. Review: Bupropion and SSRI-induced side effects. J Psychopharmacol 2008; 22: 792-804.
33 Andreyeva T, Puhl RM, Brownell KD. Changes in perceived weight discrimination among Americans, 1995-1996 through 2004-2006. Obesity (Silver Spring) 2008; 16: 1129-34.
34 Puhl RM, Moss-Racusin CA, Schwartz MB. Internalization of weight bias: Implications for binge eating and emotional well-being. Obesity (Silver Spring) 2007; 15:19-23.
35 Friedman KE, Reichmann SK, Costanzo PR, Musante GJ. Body image partially mediates the relationship between obesity and psychological distress. Obes Res 2002; 10: 33-41.
36 Ross CE. Overweight and depression. J Health Soc Behav 1994; 35: 63-79.
37 Bornstein SR, Schuppenies A, Wong ML, Licinio J. Approaching the shared biology of obesity and depression: the stress axis as the locus of gene-environment interactions. Mol Psychiatry 2006; 11: 892-902.
38 Stunkard AJ, Faith MS, Allison KC. Depression and obesity. Biol Psychiatry 2003; 54: 330-7.
39 Atlantis E, Baker M. Obesity effects on depression: systematic review of epidemiological studies. Int J Obes (Lond) 2008; 32: 881-91.
40 Ahlberg AC, Ljung T, Rosmond R, McEwen B, Holm G, Akesson HO, et al. Depression and anxiety symptoms in relation to anthropometry and metabolism in men. Psychiatry Res 2002;
112: 101-10.
41 Ljung T, Holm G, Friberg P, Andersson B, Bengtsson BA, Svensson J, et al. The activity of the hypothalamic-pituitary-adrenal axis and the sympathetic nervous system in relation to waist/hip circumference ratio in men. Obes Res 2000; 8: 487-95.
42 Gluck ME, Geliebter A, Hung J, Yahav E. Cortisol, hunger, and desire to binge eat following a cold stress test in obese women with binge eating disorder. Psychosom Med 2004; 66: 876-81.
43 Dixon JB, Dixon AF, O'Brien PE. Improvements in insulin sensitivity and beta-cell function (HOMA) with weight loss in the severely obese. Homeostatic model assessment. Diabet Med 2003; 20: 127-34.
44 Dixon JB, Dixon ME, O'Brien PE. Depression in association with severe obesity: changes with weight loss. Arch Intern Med 2003; 163: 2058-65.
45 Rivenes AC, Harvey SB, Mykletun A. The relationship between abdominal fat, obesity, and common mental disorders: Results from the HUNT study. Journal of Psychosomatic Research in press.
Table 1 Baseline characteristics of the study population Men Women Characteristic N Mean (SD) or % N Mean or % (SD) p-Value Age 6820 44.0 (6.0) 3346 45.3 (6.1) <0.0001 Ethnicity Caucasian 6246 92.1 2848 86.4 <0.0001 Non-caucasian 537 7.9 447 13.6 Marital status Married or co-habiting 5475 80.5 2038 61.2 <0.0001 Single/divorced/widow 1326 19.5 1290 38.8 Socioeconomic position High 2614 38.3 375 11.2 <0.0001 Intermediate 3577 52.5 1316 39.3 Low 629 9.2 1655 49.5
Use of psychotropic drug
No 6628 97.2 3180 95.0 <0.0001
Characteristic Phase 1 (1985-88) Phase 3 (1991-93) Phase 5 (1997-99) Phase 7 (2003-04) Men
N 6820 5473 3857 4484
Mean age (range) 44.0 (35-56) 49.3 (39-63) 55.6 (45-69) 60.9 (51-74)
GHQ category* Non-case 5098 (74.8) 4361 (79.7) 3085 (80.0) 3651 (81.4) Case 1722 (25.3) 1112 (20.3) 772 (20.0) 833 (18.6) Mean (SD) GHQ score 3.4 (5.4) 2.8 (4.9) 2.8 (5.3) 2.7 (5.3) BMI category* Non-obese 6470 (94.9) 5090 (93.0) 3403 (88.2) 3760 (83.9) Obese 350 (5.1) 383 (7.0) 454 (11.8) 724 (16.2) Mean (SD) BMI, kg/m2 24.6 (3.1) 25.1 (3.2) 26.0 (3.5) 26.6 (3.8) Women N 3346 2424 1602 1823
Mean age (range) 45.3 (35-56) 50.2 (39-62) 56.1 (45-68) 61.3 (50-74)
GHQ category* Non-case 2331 (69.7) 1813 (74.8) 1175 (73.4) 1373 (75.3) Case 1015 (30.3) 611 (25.2) 427 (26.7) 450 (24.7) Mean (SD) GHQ score 4.1 (5.8) 3.4 (5.5) 3.9 (6.3) 3.6 (5.3) BMI category* Non-obese 2985 (89.2) 2049 (84.5) 1286 (80.3) 1361 (74.7) Obese 361 (10.8) 375 (15.5) 316 (19.7) 462 (25.3) Mean (SD) BMI, kg/m2 24.8 (4.3) 25.7 (4.7) 26.4 (4.9) 27.2 (5.4) GHQ = General Health Questionnaire (a measure of common mental disorders). BMI = body mass index.
Men: Odds ratio (95% CI) for obesity Women: Odds ratio (95% CI) for obesity
GHQ category Age-adjusted Multiply adjusted Age-adjusted Multiply adjusted
Phase 1
Non-case 1.0 (ref.) 1.0 (ref.) 1.0 (ref.) 1.0 (ref.)
Case 1.12 (0.88 to 1.43) 1.11 (0.86 to 1.42) 1.09 (0.86 to 1.39) 1.19 (0.93 to 1.52)
Phase 3
Non-case 1.0 (ref.) 1.0 (ref.) 1.0 (ref.) 1.0 (ref.)
Case 1.32 (1.03 to 1.68) 1.33 (1.04 to 1.70) 0.96 (0.74 to 1.24) 1.00 (0.76 to 1.30)
Phase 5
Non-case 1.0 (ref.) 1.0 (ref.) 1.0 (ref.) 1.0 (ref.)
Case 1.26 (1.00 to 1.59) 1.26 (0.99 to 1.60) 1.10 (0.83 to 1.45) 1.05 (0.78 to 1.40)
Phase 7
Non-case 1.0 (ref.) 1.0 (ref.) 1.0 (ref.) 1.0 (ref.)
Case 1.33 (1.09 to 1.61) 1.31 (1.08 to 1.60) 1.33 (1.05 to 1.69) 1.30 (1.02 to 1.67) *Adjusted for age, ethnicity, marital status, socioeconomic position and use of psychotropic drugs.
GHQ category Model A Model B Model C
Age (per year) 1.06 (1.06 to 1.07) 1.07 (1.06 to 1.07) 1.06 (1.06 to 1.07) Sex Men 1.0 (ref.) 1.0 (ref.) 1.0 (ref.)
Women 1.83 (1.65 to 2.02) 1.47 (1.30 to 1.65) 1.47 (1.30 to 1.66) Ethnicity
Caucasian 1.0 (ref.) 1.0 (ref.)
Non-caucasian 1.01 (0.85 to 1.19) 1.00 (0.85 to 1.19) Marital status
Married 1.0 (ref.) 1.0 (ref.)
Single/divorced/widow 1.07 (0.98 to 1.18) 1.07 (0.98 to 1.18) Socioeconomic status
High 1.0 (ref.) 1.0 (ref.)
Intermediate 1.28 (1.12 to 1.45) 1.27 (1.12 to 1.45) Low 1.72 (1.46 to 2.03) 1.71 (1.46 to 2.02) Use of psychotropic drugs
No 1.0 (ref.) 1.0 (ref.)
Yes 1.08 (0.93 to 1.26) 1.07 (0.92 to 1.25) GHQ Non-case 1.0 (ref.) 1.0 (ref.) 1.0 (ref.)
Case 1.12 (1.04 to 1.20) 1.12 (1.04 to 1.20) 0.63 (0.41 to 0.97)
GHQ * Age 1.01 (1.003 to 1.02)
p = 0.008
FIGURE 1 Growth curves for obesity risk by age and GHQ-caseness (estimated based on multilevel GEE logistic regression analysis)