The "Coffee-flux collaborative observatory": measuring and modeling carbon, nutrients, water and sediment Ecosystem services in a coffee agroforestry watershed (Costa Rica)
Texte intégral
Figure


Documents relatifs
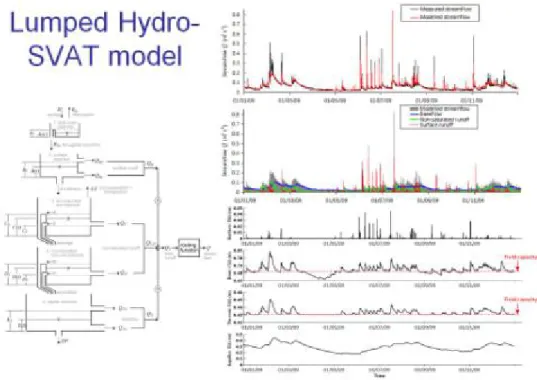
Two other important features of the model are the simulation of the canopy temperature (instead of air temperature) to control the plant growth according to the
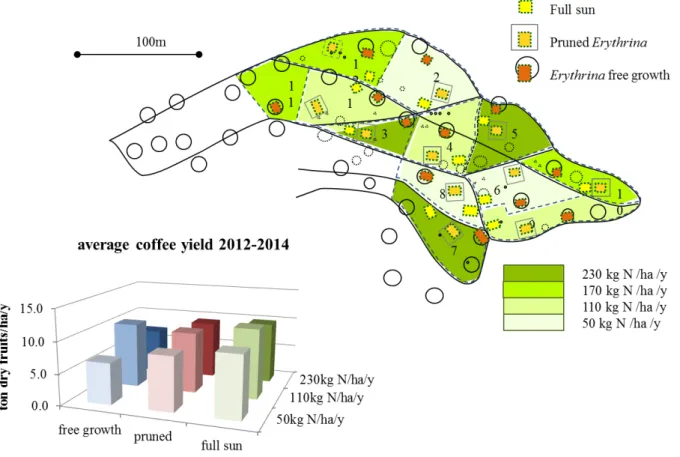
We characterized the structure, productivity, diversity, soil conservation and carbon sequestration of 40 coffee agroforestry systems in two different areas in Northern
Which instruments to foster adoption of agro-environmental practices rebalancing ecosystem services / disservices provision.. Objective 1: Characterize
-Mitigation and adaptation of coffee: microclimate, yield and NPP behaviour according to Shade, Fertilization, under climate change projections : MAESPA, CAF2007 and MACACC-GO+
Our objectives here were to assess coffee root biomass and bNPP along the whole rooting profile (0- 4.5 m) in coffee tree plantations as a function of distance to shade tree,
• Deep root biomass and productivity frequently forgotten; first coffee root biomass estimates on whole rooting profile • 2 times more root biomass located in the row
General method VHSR image Tree locations automatic Tree locations manual Tree crown diameters automatic Tree crown diameters manual Tree height automatic Tree
given plant inside a mixed heterogeneous plot (whatever plant architecture, leaf area, layers, neighbors etc.) allows to 1/ study competition for light in complex plots 2/
