HAL Id: inserm-00089254
https://www.hal.inserm.fr/inserm-00089254
Submitted on 16 Aug 2006
HAL is a multi-disciplinary open access
archive for the deposit and dissemination of
sci-entific research documents, whether they are
pub-lished or not. The documents may come from
teaching and research institutions in France or
abroad, or from public or private research centers.
L’archive ouverte pluridisciplinaire HAL, est
destinée au dépôt et à la diffusion de documents
scientifiques de niveau recherche, publiés ou non,
émanant des établissements d’enseignement et de
recherche français ou étrangers, des laboratoires
publics ou privés.
Detection of susceptibility loci by genome-wide linkage
analysis.
Marie-Claude Babron, Catherine Bourgain, Anne-Louise Leutenegger,
Françoise Clerget-Darpoux
To cite this version:
Marie-Claude Babron, Catherine Bourgain, Anne-Louise Leutenegger, Françoise Clerget-Darpoux.
Detection of susceptibility loci by genome-wide linkage analysis.. BMC Genetics, BioMed Central,
2005, 6 Suppl 1, pp.S18. �10.1186/1471-2156-6-S1-S18�. �inserm-00089254�
Open Access
Proceedings
Detection of susceptibility loci by genome-wide linkage analysis
Marie-Claude Babron*
1, Catherine Bourgain
1, Anne-Louise Leutenegger
2and
Françoise Clerget-Darpoux
1Address: 1INSERM U535, 94817 Villejuif Cedex, Villejuif, France and 2INSERM U679, Paris, France Email: Marie-Claude Babron* - babron@vjf.inserm.fr; Catherine Bourgain - bourgain@vjf.inserm.fr; Anne-Louise Leutenegger - leutenegger@vjf.inserm.fr; Françoise Clerget-Darpoux - clerget@vjf.inserm.fr * Corresponding author
Abstract
The objective of this study is to evaluate the efficacy of a model-free linkage statistics for finding evidence of linkage using two different maps and to illustrate how the comparison of results from several populations might provide insight into the underlying genetic etiology of the disease of interest. The results obtained in terms of detection of the risk loci and threshold for declaring linkage and power are very similar for a dense SNP map and a sparser microsatellite map. The populations differed in terms of family ascertainment and diagnosis criteria, leading to different power to detect the individual underlying disease loci. Our results for the individual replicates are consistent with the disease model used in the simulation.
Background
The Genetic Analysis Workshop 14 (GAW14) simulated problem provided family data ascertained in four differ-ent populations. All members of the family were typed both with a relatively sparse map of microsatellites, and a denser map of single-nucleotide polymorphisms (SNPs). The objective of this study is to evaluate the efficacy of a model-free linkage statistics for finding evidence of link-age in the different populations using the two different maps. We also show how the comparison of several diag-nostic criteria can provide clues to the underlying genetic model. This study was performed blind to the genetic model used to simulate the data provided.
Methods
Material
The disease under study, Kofendrerd Personality Disorder (KPD), results in an unknown combination of 12 sub-phenotypes. Families with this disorder were ascertained in four populations, with a different scheme. In 3 popula-tions (Aipotu (AI), Danacaa (DA) and Karangar (KA)),
ascertainment was based on the presence of at least two affected sibs in nuclear families, while in the last, New York (NY), large pedigrees including more than 4 affect-eds were recruited. The populations differed also in the distribution of the sub-phenotypes. All family members were typed for markers on their 10-chromosome genome, without genotyping error. Two marker sets were available: 416 microsatellites spaced every ~7 cM, and a denser 917-SNP map, with ~3.5 cM inter-marker distances.
Determination of the susceptibility loci
To identify the number and location of the susceptibility loci involved in the simulated disorder, a pooled linkage analysis of all 100 replicates in a given population was performed with the nonparametric linkage (NPL) statis-tics [1] using the ~7-cM microsatellite map and the ~3.5-cM SNP map. The affection status for KPD was as indi-cated by the clinicians in each population. The NPL was calculated using ALLEGRO [2] for the 3 populations AI, DA, and KA. Due to large family sizes and memory limita-tions, the NPL for the NY population was obtained using
from Genetic Analysis Workshop 14: Microsatellite and single-nucleotide polymorphism
Noordwijkerhout, The Netherlands, 7-10 September 2004 Published: 30 December 2005
BMC Genetics 2005, 6(Suppl 1):S18 doi:10.1186/1471-2156-6-S1-S18
<supplement> <title> <p>Genetic Analysis Workshop 14: Microsatellite and single-nucleotide polymorphism</p> </title> <editor>Joan E Bailey-Wilson, Laura Almasy, Mariza de Andrade, Julia Bailey, Heike Bickeböller, Heather J Cordell, E Warwick Daw, Lynn Goldin, Ellen L Goode, Courtney Gray-McGuire, Wayne Hening, Gail Jarvik, Brion S Maher, Nancy Mendell, Andrew D Paterson, John Rice, Glen Satten, Brian Suarez, Veronica Vieland, Marsha Wilcox, Heping Zhang, Andreas Ziegler and Jean W MacCluer</editor> <note>Proceedings</note> </supplement>
BMC Genetics 2005, 6:S18
GENEHUNTER [1] using the microsatellite map only. The NPL statistic was chosen, as the overall value can easily be calculated from the results of the individual replicates.
Determination of the threshold under H0
After the pooled analysis, some chromosomes appeared not to harbor any susceptibility loci. Five chromosomes (see "Results") represented the null hypothesis of no link-age, whatever the population, giving a total of 1,500 rep-licates simulated under H0 (5 chromosomes × 3
populations × 100 replicates). Because of its ascertain-ment scheme, and computing limitations, the NY popula-tion was ignored in this step.
The value of the maxNPL that was exceeded in 0.5% of these 1,500 replicates, was then determined. It corre-sponds to the threshold for declaring linkage at the 5% genome-wide level, after a Bonferroni correction for 10 independent chromosomes.
Power to detect linkage in individual replicates
This was calculated as the number of replicates in which the value of the NPL at the putative disease locus exceeded the 5% genome-wide threshold value.
Results
Determination of the susceptibility loci
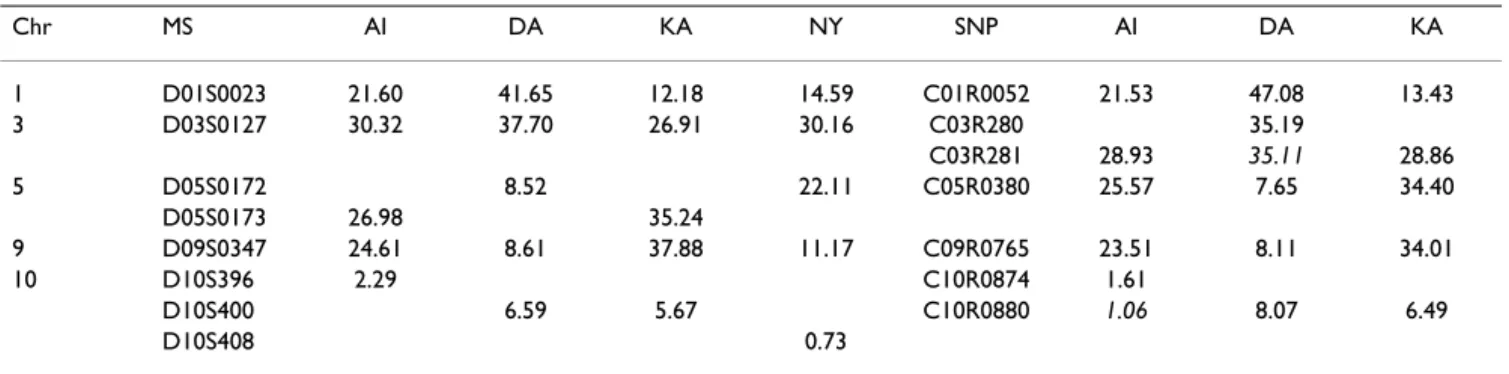
Four, and possibly 5, linkage regions had evidence of link-age by the pooled analysis, as shown in Table 1, where the marker giving the highest NPL score in each region is reported for the microsatellite and SNP map.
Apart from the region on chromosome10, whatever the diagnosis criteria, one can conclude there is a susceptibil-ity factor on chromosome 1, 3, 5, and 9. For these chro-mosomes, in all populations, the peak occurred at the same marker or the one immediately adjacent.
In addition, the different results obtained in the popula-tions AI, DA, and KA, which only differ by the definition
of the affection status, show that the genotype-phenotype relationships vary widely across populations. This is well illustrated for chromosome 9, where the NPL ranges from 8.6 in DA to 37.9 in KA.
In population AI and NY, the diagnosis criteria seem to be the same, as indicated evidenced by the similar distribu-tion of sub-phenotypes among cases, but the ascertain-ment criteria and family structures differ. The NPL values are greater for the AI nuclear families than for the NY extended pedigrees for chromosome 1, 5, and 9, whereas they are similar for chromosome 3. This result is interest-ing in view of the debate "samplinterest-ing large extended pedi-grees vs. smaller familial structures". Here, we show that for the simulated model, two nuclear families with two affected sibs are more informative than one three-genera-tion pedigree with four affected members.
For chromosome 10, the signal is very weak because this NPL value was obtained for 10,000 families in AI, DA, and KA and 5,000 families for NY. So this could well represent a factor with an effect difficult to detect by linkage analysis or a factor observed only in a subgroup of affecteds. Similar observations were obtained in a pooled analysis using the denser SNP map. It was not possible to align the two maps, because no indication was given about merg-ing the two maps. However, the peaks were located about the same distance from the first marker of each map.
Determination of the threshold under H0
For the 5 chromosomes (2, 4, 6, 7, and 8), the highest NPL obtained on the pooled data for the microsatellite map was 2.65. As explained in the "Methods" section, these 5 chromosomes were considered to carry no risk factor and were thus presumably simulated under the null hypothe-sis of no linkage. It is thus possible to establish the 5% genome-wide threshold from the distribution of the NPL scores observed in the individual replicates of the three populations AI, DA, and KA. This threshold was found to
Table 1: Regions detected in the analysis of the pooled 100 replicates.
Chr MS AI DA KA NY SNP AI DA KA 1 D01S0023 21.60 41.65 12.18 14.59 C01R0052 21.53 47.08 13.43 3 D03S0127 30.32 37.70 26.91 30.16 C03R280 35.19 C03R281 28.93 35.11 28.86 5 D05S0172 8.52 22.11 C05R0380 25.57 7.65 34.40 D05S0173 26.98 35.24 9 D09S0347 24.61 8.61 37.88 11.17 C09R0765 23.51 8.11 34.01 10 D10S396 2.29 C10R0874 1.61 D10S400 6.59 5.67 C10R0880 1.06 8.07 6.49 D10S408 0.73
Highest NPL and corresponding marker of the microsatellite (MS) and SNP maps. The value of the maxNPL at the true location for DA on chromosome 3 and AI on chromosome 10 are given in italics.
be NPL = 3.3 and 3.2, using the microsatellite and SNP maps, respectively.
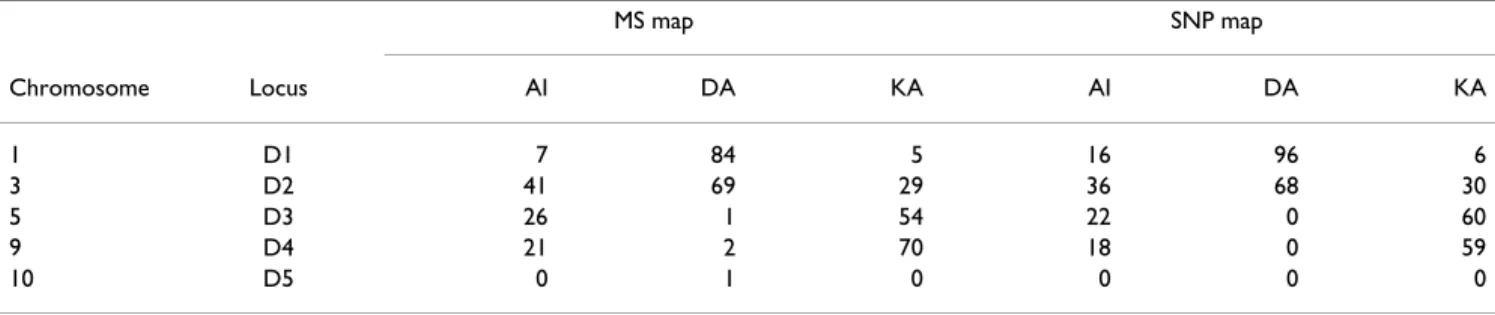
Power to detect linkage in individual replicates
The power to detect linkage in the 5 regions found by the pooled analysis is given by the number of replicates for which the statistic value is over the 0.5% threshold, as shown in Table 2 for the microsatellite and SNP maps. Both maps provide very similar power. Indeed, power depends on the amount of information on the resem-blance between affected individuals that can be extracted from the marker data. Both maps have very similar infor-mation content, with an average of 0.91 and 0.81 for the microsatellite and SNP maps, respectively. The smaller heterozygosity of the SNPs vs. microsatellites (0.34 vs. 0.76) is compensated by the higher density of the map. The power observed in Table 2 reflects the magnitude the NPL observed in Table 1: regions having high NPLs in the pooled analysis are more easily detected in the individual replicates.
Discussion
Before knowing the simulation model
The detection of the different risk factors varies according to the diagnosis strategy and the chromosome, giving clues on the genetic basis of KPD. Let A denote the anxi-ety-related symptoms, B, the behavioral, and C the "com-munally shared emotions" sub-phenotypes. From the indication given to all participants prior to the analysis, individuals in AI are declared affected if they have A or B or C symptoms, while in DA, B is prominent. In KA, only those individuals with either A or C, whatever their B symptoms, are classified as affected, while those with prominent B symptoms are not.
The chromosome 1 risk factor is very well detected in DA, and not in the other populations, suggesting that it is involved only in the determination of behavior B. On the other hand, the risk factors on chromosomes 5 and 9 do not seem to play a role in determining B (lack of evidence
in DA), but are probably involved in the determination of A and C.
Chromosome 3 is detectable in all populations, with var-ying intensities. It is probably involved whatever the diag-nosis criteria. However, in the AI population, this locus is detected in 41% of the replicates, but the NPL values range from 1.38 to 5.71. This observation is true even when the power is high, such as in the DA population where the values range between 1.66 and 6.13. This risk locus illustrates the difficulty of replicating an earlier link-age finding, as shown by Clerget-Darpoux et al. [3]. Finally, the chromosome 10 risk factor is never detected with sample sizes of 100 families. As we have seen in the pooled analysis, it is a factor difficult to detect by linkage analysis. Note that it was detected in DA and KA by asso-ciation analysis [4].
After knowing the simulated model
The disease model used in the simulation was given dur-ing GAW14. Four disease loci and two modifier genes were simulated, and their position on the SNP map was given. Neither D5 nor D6, which act as modifier genes involved in the phenotype P2 that regroups most of the traits defined as behavioral related traits B, are expected to be detectable by linkage analysis, even with the large sam-ple size of the pooled analysis. In fact, disease locus D6 was not detected at all. The other loci were all detected at their exact location on the SNP map, with the exception of D2 on chromosome 3 in DA (maxNPL found at the adja-cent SNP) and D5 on chromosome 10 in AI (maxNPL located 16 cM more centromeric). The value of these two maxNPL are given italics in Table 1.
Analysis of the individual replicates gave results consistent with the disease model used in the simulation. In popula-tion DA, individuals are declared affected when they have phenotype P1, determined by the two loci D1 and D2 on chromosome 1 and 3, respectively, with a highly
pene-Table 2: Number of replicates for which the statistic value is over the 0.5% threshold for the 5 regions, using the microsatellite (MS) and SNP maps. MS map SNP map Chromosome Locus AI DA KA AI DA KA 1 D1 7 84 5 16 96 6 3 D2 41 69 29 36 68 30 5 D3 26 1 54 22 0 60 9 D4 21 2 70 18 0 59 10 D5 0 1 0 0 0 0
Publish with BioMed Central and every scientist can read your work free of charge "BioMed Central will be the most significant development for disseminating the results of biomedical researc h in our lifetime."
Sir Paul Nurse, Cancer Research UK Your research papers will be:
available free of charge to the entire biomedical community peer reviewed and published immediately upon acceptance cited in PubMed and archived on PubMed Central yours — you keep the copyright
Submit your manuscript here:
http://www.biomedcentral.com/info/publishing_adv.asp
BioMedcentral BMC Genetics 2005, 6:S18
trant dominant mode of inheritance. These two loci are therefore easily detected in this population.
Locus D2, on chromosome 3, underlies all the pheno-types. This explains why it is very well detected in all 3 populations, whatever the ascertainment criteria. In con-trast, locus D3 on chromosome 5, and locus D4 on chro-mosome 9 determine phenotype P2 and/or P3. This explains the high level of detection in KA and AI, but not in DA. Note that D4, which acts in a recessive manner with a high penetrance, displays more evidence of linkage than D3.
The answers also provided some explanation of the differ-ence in magnitude of the maxNPL in the pooled analysis of the AI and NY replicates. The ascertainment criteria were not only different; but showed greater heterogeneity in NY. In the NY study, the 4 affected individuals could each have different phenotypes, determined by different combination of the disease loci, thus lowering the resem-blance between affecteds and the expected value of the linkage statistic.
Conclusion
In this simulated problem, the results obtained in terms of detection of the risk loci, threshold and power were very similar for the microsatellite and SNP map. A sparser map, with very polymorphic markers, brings as much informa-tion on the IBD sharing than a denser, less polymorphic marker map, at a smaller genotyping cost. Whether this is true in all cases remains to be explored. However, this point should be kept in mind before embarking on a genome scan using SNPs.
The power to detect linkage varies according to the popu-lation diagnosis criteria and to the disease locus.
Abbreviations
GAW14: Genetic Analysis Workshop 14 IBD: Identical by descent
KPD: Kofendrerd Personality Disorder NPL: Nonparametric linkage
SNP: Single-nucleotide polymorphism
Authors' contributions
M-CB performed the analyses and drafted the manuscript. CB and A-LL provided the file formatting programs. FC-D and M-CB designed the study. All authors read and approved the final manuscript.
References
1. Kruglyak L, Daly MJ, Reeve-Daly MP, Lander ES: Parametric and
nonparametric linkage analysis: a unified multipoint approach. Am J Hum Genet 1996, 58:1347-1363.
2. Gudbjartsson DF, Jonasson K, Frigge ML, Kong A: Allegro, a new
computer program for multipoint linkage analysis. Nat Genet
2000, 25:12-13.
3. Clerget-Darpoux F, Selinger-Leneman H, Babron MC: Why do
complex traits resist DNA analysis? Int J Hum Genet 2001, 1:55-63
[http://www.krepublishers.com/02-Journals/IJHG/IJHG-01-0- 000-000-2001-Web/IJHG-01-1-001-075-2001-Abst-PDF/IJHG-01-1- 055-063-2001-Clerget-Darpoux/IJHG-01-1-055-063-2001-Clerget-Darpoux.pdf].
4. Bourgain C: Comparing strategies for association mapping in
samples with related individuals. BMC Genet 2005, 6(Suppl 1):S98.
![[PDF] Cours bureautique approfondie pdf | Cours informatique](data:image/gif;base64,R0lGODlhAQABAIAAAP///wAAACH5BAEAAAAALAAAAAABAAEAAAICRAEAOw==)