HAL Id: inserm-00189828
https://www.hal.inserm.fr/inserm-00189828
Submitted on 20 Dec 2007
HAL is a multi-disciplinary open access archive for the deposit and dissemination of sci-entific research documents, whether they are pub-lished or not. The documents may come from teaching and research institutions in France or abroad, or from public or private research centers.
L’archive ouverte pluridisciplinaire HAL, est destinée au dépôt et à la diffusion de documents scientifiques de niveau recherche, publiés ou non, émanant des établissements d’enseignement et de recherche français ou étrangers, des laboratoires publics ou privés.
side-chain modelling.
Guilhem Faure, Aurélie Bornot, Alexandre de Brevern
To cite this version:
Guilhem Faure, Aurélie Bornot, Alexandre de Brevern. Protein contacts, inter-residue interac-tions and side-chain modelling.: protein contacts. Biochimie, Elsevier, 2008, 90 (4), pp.626-39. �10.1016/j.biochi.2007.11.007�. �inserm-00189828�
Accepted for publication in Biochimie
Protein contacts, inter-residue interactions and side-chain
modelling.
Guilhem Faure
1, Aurélie Bornot
1& Alexandre G. de Brevern
1*
1
INSERM UMR-S 726, Equipe de Bioinformatique Génomique et Moléculaire (EBGM), Université Paris Diderot - Paris 7, case 7113,
2, place Jussieu, 75251 Paris, France
Short title: protein contacts
* Corresponding author:
Mailing address: Dr. de Brevern A.G., Equipe de Bioinformatique Génomique et Moléculaire (EBGM), INSERM UMR-S 726, Université Paris Diderot - Paris 7, case 7113, 2, place Jussieu, 75251 Paris, France
E-mail : [email protected] Tel: (33) 1 44 27 77 31
Fax: (33) 1 43 26 38 30
HAL author manuscript inserm-00189828, version 1
HAL author manuscript inserm-00189828, version 1
Biochimie 2007;:epub ahead of print
HAL author manuscript inserm-00189828, version 1
Abstract
Three-dimensional structures of proteins are the support of their biological functions. Their folds are stabilized by contacts between residues. Inner protein contacts are generally described through direct atomic contacts, i.e. interactions between side-chain atoms, while contact prediction methods mainly used inter-C distances. In this paper, we have analyzed the protein contacts on a recent high quality non-redundant databank using different criteria. First, we have studied the average number of contacts depending on the distance threshold to define a contact. Preferential contacts between types of amino acids have been highlighted. Detailed analyses have been done concerning the proximity of contacts in the sequence, the size of the proteins and fold classes. The strongest differences have been extracted, highlighting important residues.
Then, we studied the influence of five different side-chain conformation prediction methods (SCWRL, IRECS, SCAP, SCATD and SSCOMP) on the distribution of contacts. The prediction rates of these different methods are quite similar. However, using a distance criterion between side-chains, the results are quite different, e.g. SCAP predicts 50% more contacts than observed, unlike other methods that predict fewer contacts than observed. Contacts deduced are quite distinct from one method to another with at most 75% contacts in common. Moreover, distributions of amino acid preferential contacts present unexpected behaviors distinct from previously observed in the X-ray structures, especially at the surface of proteins. For instance, the interactions involving Tryptophan greatly decrease.
key words : amino acid; protein domain; side-chain side-chain interaction; hierarchical folding; protein stability; contact potential; structural class; structure-sequence relationship; local protein structure; secondary structure, side-chain conformation, side-side-chain prediction.
Introduction
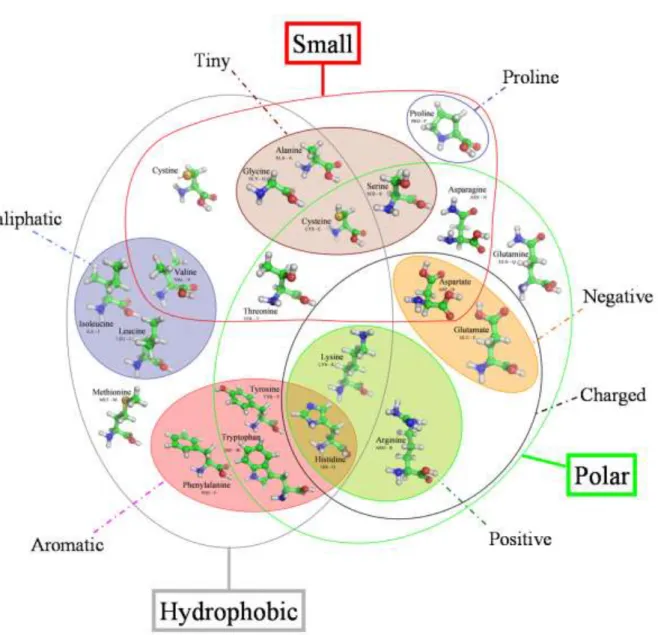
Amino acids are the basic structural building units of proteins. They have very varied physico - chemical properties (see Figure 1 [1, 2]). Inter-residue contacts are the cement of protein structures that control most of biological functions. Numerous research teams have analyzed the sequence – structure relationship for a better understanding of protein fold and to perform structural prediction from sequence. At a local level, secondary structure predictions have been a tremendous research area during the last three decades [3] the prediction rates reaching now 80% [4, 5]. Nonetheless, protein secondary structure prediction progress attains a plateau and prediction rates seem now close to their optimal limit. Secondary structure are also partially determined by tertiary factors [6]. A marginal part of the failures of secondary structure predictions may be attributed to the influence of long-range interactions [7]. Moreover, secondary structures focus on two kinds of regular local structures, i.e. helix and sheet, which compose only a part of protein backbones. The absence of assignment for an important proportion of residues has led to the emergence of new approaches based on local protein structure libraries called structural alphabets able to approximate all local protein structures [8-14]. This kind of approach has proven its relevance by enabling local structure prediction [13, 15], structural alignments [16-18] and the discovery of functional local structural motifs [19].
Nonetheless, few studies do take into account inter-residue interactions, e.g. [20]. Contacts in proteins can be of different nature. Hydrogen bonds are formed by the "sharing" of a hydrogen atom between two electronegative atoms such as N and O, participate in the formation of regular secondary structures [21]. It has also been shown in many studies that even weak hydrogen bonds could be essential for inter-residue contacts [22-24]. Ionic bonds involve interactions between oppositely charged groups of a molecule, e.g. the positively charged basic side chains of Lysine and Arginine, and the negatively charged carboxyl groups
of Glutamic and Aspartic acid [25]. Compared to these electrostatic forces and long-range interactions, van der Waals are weak forces (attractions or repulsions) and involve short-range interactions. The hydrophobic amino acids of a protein will tend to cluster together. It is mainly due to their escape from the hydrogen bonded water network in which the protein is dissolved. Hydrophobic regions of a protein will preferentially locate away from the surface of the molecule [26, 27].
Thus, inter-residue interactions have been one of the main focuses to understand the mechanisms of protein folding and stability [28-34]. Contact exploration in proteins could be of great interest from different perspectives, e.g. to develop potentials [35, 36], to identify amino acid side-chain clusters playing structural and / or functional roles [37-39] or to study dynamics of disordered regions of proteins [40]. For instance, different distributions of noncovalent interactions in proteins reflect their different environments, the extracellular and the intracellular ones [41]. Interestingly, inter-residue interactions can be characterized by contact order (CO) and long-range order (LRO) parameters that have a strong correlation with the folding rate of small proteins [42-45].
In the same way, many researches have been done to predict contacts from the sole knowledge of the sequence [46-54]. In spite of steady progresses, contact map prediction remains a largely unsolved challenge.
Protein structures can be seen as composed of single or multiple functional domains that can fold and function independently [55]. Dividing a protein into domains is useful for more accurate structure and function determination [55, 56, Taylor, 2007 #181, 57]. Hence, methods for phylogenetic analyses and protein modelling usually perform better for single domains [58]. Automatic domain parsing generally makes the assumption that interdomain interaction (under a correct domain assignment) is weaker than the intradomain interaction (PUU [59], DOMAK [60] and 3Dee [61, 62], DETECTIVE [63], DALI [64], STRUDL [65],
DomainParser [66, 67], Protein Domain Parser [68] and DDOMAIN [69]). These approaches maximize the number of contacts within a domain. Some authors have proposed alternative methods to hierarchically split proteins into compact units [70-76]. These folding units are supposed to fold independently during the folding process, creating structural modules which are assembled to give the native structure. In this way, we have developed a method called Protein Peeling [77] based on C -contact matrix translated into contact probabilities.
Due to the low number of high-resolution protein structures available, protein computational modelling techniques are essential. Protein backbone local conformation could be designed using numerous approaches, e.g. homology modelling [78], threading [79], ab
initio [80] and de novo approaches [81]. Side chain conformation prediction is also a difficult
task [82, 83]. Thus, different methods have been proposed to predict side chain conformations [84-88].
At this day, SCWRL is the most widely used method [89-91]. It is based on a simple scoring function and a backbone dependent rotamer library. The side chains positions are predicted by graph theory that decreases greatly the combinatory of possible positions [92]. The prediction accuracy for 1 and 1+2 dihedral angles is respectively 82.6% and 73.7%.
SCCOMP makes a scoring function based on terms for complementarities (geometric and chemical compatibility), excluded volume, internal energy based on probability of rotamers, and solvent accessible surface [93]. SCAP specificities lead to a four coordinate rotamer libraries [94]. The method used a CHARMM force field to perform a minimization. The principle of SCATD is related to SCWRL [95]. Its main difference relies on an optimisation of the graph theory search with a Goldstein criterion DEE to increase the quickness of the computation. Nonetheless, its accuracy is close to SCWRL. IRECS ranks all side-chain rotamers of a protein according to the probability with which each side chain adopts the respective rotamer conformation [96]. This ranking enables to select small rotamer sets. In a
second step, worst effective energy rotamers are removed at each iteration.
In the present paper, we precisely analyse the impact of side chain coordinate prediction on protein contacts. The objective of this study is the analysis of contacts and especially in regards to prediction methods of side-chain conformations. Firstly, we present a classical study of contacts within proteins according to various criteria (lengths of proteins, SCOP classes, secondary structures, amino acid frequencies, accessibility). Secondly, these analyses are compared to the favoured contacts given by different side-chain replacement methods.
Materials and Methods
Dataset. A non-redundant protein databank has been initially built using PDB-REPRDB [97, 98]. It was composed of 1,736 protein chains taken from the Protein DataBank (PDB) [99]. The set contained proteins with no more than 10% pairwise sequence identity. We selected chains with a resolution better than 2.5 Å and a R-factor less than 0.2. Pairwise root mean square deviation (rmsd) values between all chains were more than 10 Å. Only proteins with more than 99% of complete classical amino acids were conserved. Moreover, proteins that cannot be studied by software used during analysis process (see paragraph Analyses) have also been excluded. Thus, we retained 1,230 protein chains corresponding to 377,232 residues.
Contact definitions. Two residues are in contact if they are at a lower distance than a distance one to the other (cf. Figure 2). Thus, we analyze various distances: (1) C - C , noted C , (2) C - C , noted C , (3) minimal distance between the heavy atoms of the protein backbone of the two residues, noted BB, (4) minimal distance between the heavy atoms of the side chains of the two residues, noted SC, (5) minimal distances between all the heavy atoms
of two residues, noted ALL (cf. Figure 3). The distance criteria will be noted with the value of in superscript to facilitate the reading, e.g. for the C distance, a value of threshold equal to 8 Å will be noted C 8. The threshold varies, in this study, between 4 and 20 Å. The
interactions at short distance in the sequence are discarded, i.e. D/2 residues surrounding the studied residue will not be considered. D is the main diagonal of the contact map, classical values have been used [100]. For Glycine, C is used for C and side chain analyses.
Analysis of preferential contacts. Analysis of the observed contacts is carried out mainly by computing the relative contact frequency (noted rf in the text) of the amino acid of type i found in contact (distance lower than ) with the amino acid of type j :
j DB contact ij contact ij f
aa
f
faa
aa
r
(1) withr
faa
ijcontact the frequency of the contacts of the amino acid of type i with aminoacid of type j :
faa
ijcontact =Naa
ijcontact/
Naa
icontact ;Naa
ijcontact is the number of contactsbetween residues of types i et j, and
Naa
icontact the total number of contacts of amino acid of type i. This value is normalized by fDBaaj, the average frequency of amino acid of type j in the studied protein databank.Analyses. Residue accessibilities have been calculated with nAccess software (version 2.1.1) [101]. To analyze the potential influence of side chains replacement, software SCWRL 3.0 [92], IRECS 1.1 [96], SCAP package from JACKAL 1.5 [94], SCATD 1.2 [95] and SCCOMP [93] were used. Secondary structure assignment has been done using DSSP software (version 2000, CMBI). The eight states DSSP have reduced to the classical three states: the helix state contains , 3.10 and helices, the strand state contains only the
sheet and the coil state corresponds to everything else ( -bridges, turns, bends, and coil). Default parameters were used for each software. Outputs were adapted accordingly. Proteins were characterized according to the manually assigned classes of SCOP all- , all– , / and + [102]. The automatic categorization of Michie and co-workers was also used [103]. It defines 3 classes: , and others. The first one contains proteins having more than 40% of -helices and less than 15% of -sheets, the second less than 15% of --helices and more than 30% of -sheets, the last being defined by default. All the data are available at our web site: http://www.ebgm.jussieu.fr/~debrevern/CONTACTS.
Results
The objective of this study is firstly to compare the different associations of amino acids defined by different distance criteria. In a second way, predictions of side-chain conformations are performed; deduced contacts between amino acids are then analyzed and compared to the results obtained with the true X-ray structures.
Preliminary analyses: contacts within proteins.
Distances used in classical approaches of contact prediction involve C (sometimes C ) with thresholds of 8, 10 or 12 Å [54, 104] or definitions of Potentials of Mean Force [36]. Distances SC with lowest thresholds, e.g. = of 4 [105, 106] or 5.5 Å [107], are used for more precise analyses of contacts. We tested five types of distances with D = 6 residues as in [77, 108].
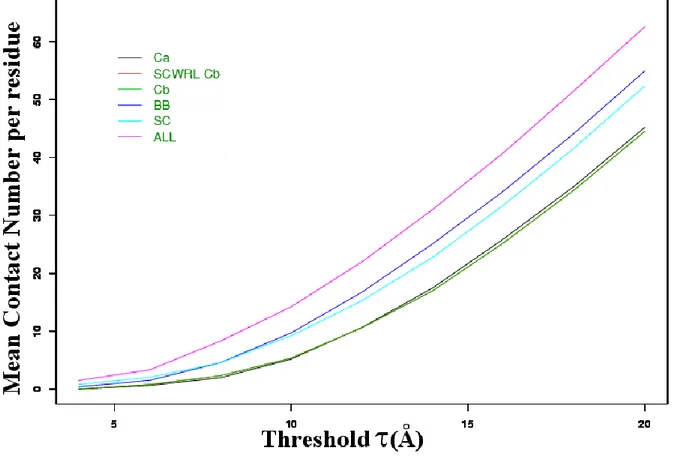
Global analysis. Figure 4 shows the distribution of the mean number of contacts. This value goes from less than 0.01, with a distance C for a equals to 4 Å, to more than 45 for = 20 Å. Three groups of distance types come out from this figure: (1) the distances C and
C have close mean number of contacts, (2) the distances involving the protein backbone (BB) and the side chains (SC) have also rather close values, (3) the distance between all atoms of the residues (ALL) leads to much more contacts. This latter induces in average twice more contacts than BB and SC. For instance, for a value of 8 Å, the ratio C / C is 1.2, SC / C is 2.31 and BB / C 2.30 while ALL / C equals 4.17. Clearly, contacts involving protein backbones and side chains do not relate to the same residues. In addition, the calculation of ratio ALL4 on C 8 gives a ratio less than 1 (0.77). In fact, the differences are
much more important, only 58% of the pairs of amino acids considered by ALL4, are also
found with C 8 and conversely only 44% of the couples of amino acids considered by C 8
are covered by ALL4. This proportion decreases to only 22%, if the analysis relates to SC4
with C 8. These results show that the parameters classically used for the prediction take into
account a greater number of contacts than the ones considered for the analyses of preferential contacts, e.g. [106].
Analysis by amino acid type. Figure 4 gives an average vision of the number of contacts. Because of differences in size, volume or polarity (see Figure 1), the various types of amino acids have different distributions of the number of mean contacts. Moreover, these values vary according to the types of distances and the different values. We performed a hierarchical clustering on the 20 amino acid distributions of mean contact number (for the 5 types of distance and ranging from 4 to 20 Å). Three distinct classes were obtained: (1) D, E, R, K, Q, P, N, (2), G, S, A, T and (3) W, F, Y, V, C, I, L, M, H. These classes are very stable according to the distance used; only Histidine changes class when C distance is considered. Hence, the average tendencies of the different types of amino acids are commonly found whatever the type of distance used.
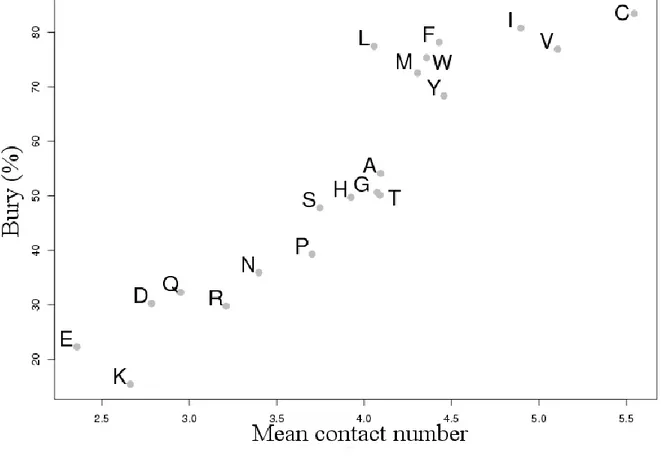
Accessibility. Residue solvent accessibility is defined as the percentage of residue surface being accessible to a solvent molecule, generally water [109]. Exposed residues (relative accessibility > 25%) are thus mainly on the protein surface. Conversely, within the core of proteins, residues are buried. As expected, Figure 5 shows a strong correlation between amino acid accessibility and their mean numbers of contacts. For C 8, Cysteine is
the most buried amino acid (only exposed at 20%) and has the greatest mean number of contacts, i.e. 5.5. This is clearly due to their propensity to form disulfide bonds and the constraints they impose in their close neighbourhood. Charged amino acids are found on the surface of proteins due to their hydrophilic properties. They have a lower mean number of contacts than those of other amino acid. It should be noted that Proline behaves similarly as to polar amino acids. These strong tendencies are also found with the C and BB distances. For SC and ALL distances, the correlation is weaker. A clear distinction in two classes appears: (a) hydrophobic and large amino acids and (b) polar residues. This analysis corroborates the preceding results, the group (1) corresponds to charged amino acids, strongly accessible and having few contacts, the group (2) includes amino acids having a mean accessibility and a mean number of contacts, the group (3) gathers aromatic and aliphatic, buried amino acids with many contacts. Thus, even if the distributions of the average number of the contacts according to the type of distance vary, the general properties of amino acids are always found whatever the type of distance is.
Relative frequencies of amino acid contacts. This section handles with C 8 data (see
supplementary data 1). We have analyzed the 40 highest and 40 lowest rf values. All amino acids have particularly high rf values with Cysteine, i.e. an average value equals to 1.62, thus 1.62 more frequent than expected. The most important rf value is as expected Cysteine with itself (6 times more than random). The minimal rf value with C concerns Arginine (R), it
remains however important (rf = 1.22). The local constraint exerted by the disulphide bridge explains this phenomenon. About a quarter of Cysteine is associated to a disulphide bridge. Aromatic residues (W, Y and F) are found grouped together, with rf values ranging between 1.23 and 1.50. Only one exception is the Tyrosine (Y) which has a weak rf value with Tryptophan (1.18). Interestingly, Methionine (M) has also a strong affinity with Tryptophan (W) and Phenylalanine (F), the two biggest amino acids (rf = 1.23). Glutamine (Q) has a rather low average number of contacts, close to the values of charged amino acids. It has affinities with these two last aromatic residues (rf of 1.30 and 1.22). It is also associated Cysteine (rf = 1.38), but its association for 13 other types of amino acids is under represented. Proline (P) has few amino acid preferences; it favours association with aromatic residues, W and Y, with rf values of 1.33 and 1.24 respectively. The aromatic amino acids play a major role in the interactions between residues. Their large volume explains partially this behaviour from a statistical point of view, but their importance comes especially from their aromatic cycle, which is implied in electrostatic interactions, e.g., aromatic - aromatic interaction, cation - aromatic or anion – aromatic interaction.
Methionine (M), Threonine (T), Histidine (H) and Asparagine (N) are strongly in contacts with themselves. Moreover, T, H and N have no other preferential contacts (rf values ranging between 1.22 and 1.67). Glycine (G) is in preferential contact with Aspartate (D), Asparagine (N) and itself (rf ranging between 1.27 and 1.37). Serine (S) does not have a real preference, except the generic one with Cysteine (rf = 1.48).
Contacts with Valine (V) are under - represented for 14 of the 20 amino acids (not with N, D, G, H, P and S). Valine is the amino acid having the most average number of contacts (after Cysteine) and one of most frequent (7% of the databank). Alanine (A), Isoleucine (I), Leucine (L) and Valine (V) form frequent couples of contacting amino acids (on average rf is 1.41 with a maximum for couple I-I with a rf value of 1.70). Their association with
Asparagine (N), Aspartate (D), Glutamine (Q), Glutamate (E) or Lysine (K) is not favoured as expected. Hydrophobic associations are thus one of the most important cements of the protein fold.
The negatively charged Aspartate (D) and Glutamate (E) have a strong repulsion for many residues (18 residues for E and 13 for D), they are associated to positively charged residues (Arginine and Lysine). In an equivalent way, positively charged Arginine (R) and Lysine (K), have a strong repulsion for many residues (18 residues for K and 11 for R) and are naturally associated residues of opposite charge (D and E). The inter-residue interactions between opposite charged amino acids are thus well found due to the importance of ionic interactions.
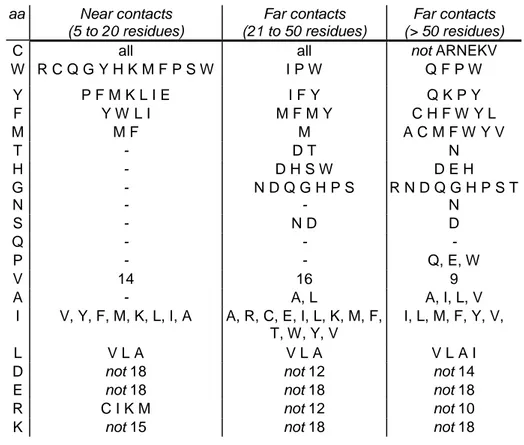
Analysis of contacts according to their proximity in sequence. We defined three zones of contacts: near (5 to 20 residues), far (21 to 50 residues) and very far (more than 50 residues) contacts. For this analysis and the ones which follow, we selected interactions having a difference of rf higher than 0.2 compared to the values in complete databank. Each zone contains an equivalent number of protein contacts. Influence of distance in the sequence is clear (see Table 1). However, it does not imply critical modifications, no association privileged becomes unfavourable and conversely. For the near contacts in the sequence, Cysteines remain always the main amino acid. The aromatic ones (W, Y and F) prevail too; moreover, they have higher rf values. Y, W, M, L and I have preferential contacts with F; P, F, M, K, L, I, E, Q and N with Y; and R, C, Q, G, Y, H, K, M, F, P, W and S with W. The hydrophobic character of Tryptophan thus seems to have more weight in near contacts compared to what is observed in the whole data bank [110, 111]. Methionine has here also a strong affinity with Tryptophan and itself. The aliphatic (I, L and V) and charged residues (D, E, R, K) show the same characteristics as those observed for the complete databank. For other
residues (T, H, G, N, S, Q, P and A), no privileged contacts are observed. The far contact analyses give different results. Cysteine contacts remain privileged by all residues. Aromatic residues (W, Y and F) have less privileged associations compared to the near contact case (3 to 4 preferential amino acids). Other amino acids have a higher number of amino acid types in privileged contacts. By observing far and very far contacts, three amino acids show a specific behaviour. Methionine for the far contacts is associated only with itself and for the very far contacts with itself, A, C, F, and V, and also with W and Y. Glycine which has few preferential contacts in the whole databank, is frequently associated with 7 amino acids for far contacts (N, D, Q, G, H, P and S) and 9 amino acids for very far contacts (R, N, D, Q, G, H, P, S and T). Its small size, i.e. absence of side – chain, which makes possible drastic changes of orientation of the protein backbone, and its frequency in turns and loops [8], explains partially this result. Proline make privileged contacts only for the far contacts with Q, E and W [112]. The other residues have behaviours close to the ones observed in the complete databank.
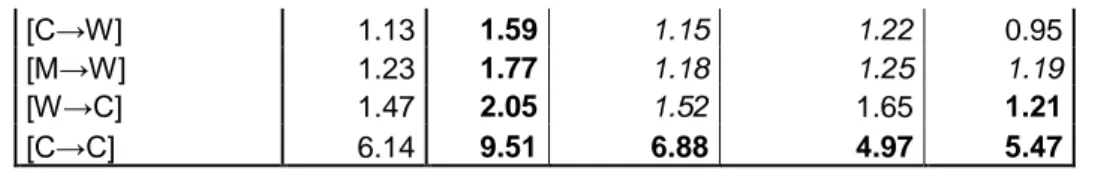
Analysis according to the size of proteins. We defined four protein sizes: (a) < 150 residues, i.e. small proteins, (b) 151 – 250, (c) 250 – 400 and (d) > 400. For 52 couples of amino acids (out of 400 possible), a difference of rf higher than 0.2 was observed corresponding 51 times to small protein class and 4 times to the other classes (see Table 2). It should be noted that small proteins represent only 10% of proteins in the databank and possess amino acid frequencies slightly different from it. Three main behaviours may be distinguished: (1) a reduction in the rf which goes from a favoured association to an underprivileged one [12 cases], (2) a reduction in rf, but without inversion of tendency [12 cases] and (3) an increase of a favoured rf [28 cases]. Among the 52 observations, Tryptophan was concerned 8 times, Cysteine 11 times, Histidine 6 times and Methionine 4 times. For
small proteins, the strong change of rf values for Cysteine may be due to the amino acid
frequency change (+50% in regards to the databank). In small proteins, the number of disulphide bridges is also more important, to maintain the protein fold. The interactions established with Tryptophan are reinforced, whereas its contact frequency is weaker (-5%). Its associations with residues charged positively (K and R), Methionine (M) and the other aromatic ones are accentuated.
Analysis according to class SCOP. Amino acids frequencies in protein SCOP classes (all - , all - / and + ) often strongly diverge from databank values; this phenomenon was not observed for the analysis on proteins size influence. Surprisingly, less rf differences are found (see Table 3). Only 18 rf inversions are observed (change of favourable interactions to unfavourable one and reciprocally) and only 18 other changes are notable. These changes are not equally distributed between the various classes. Indeed 21 cases concern all- class, 15 + class, and, only 4 times the class all- and 3 the / . This result is surprising because the all- class is the one for which the amino acid distribution is the most distant from the databank distribution. The amino acids implied in these changes are Tryptophan, 7 times, Cysteine, 8 times, Histidine, 6 times, Methionine, 4 times and in a more surprising way Proline, 5 times. Important variations of amino acid frequencies are observed between classes. Differences in contact distributions are not due to the effect of the occurrences, but clearly to a specialization of contacts according to the protein classes. The particular role of Proline is not exclusively due to its property of breaker, but also to specific interaction stabilizing property. Indeed, this amino acid being in connection mainly with polar residues. Proline has been often linked to stabilizing interactions of -helices, thus its behaviour in all- class is comprehensible [113].
Various thresholds ( for various distance types. Precedent analyses used a C 8
distance. However, this kind of distance and this distance threshold are not the only one used [107, 113]. In this study, has been increased from 4 to 20 Å by steps of 2 Å. For C 4,
the number of contacts is close to 0. From our reference, C 8 until C 20, no notable change of
the tendencies of interactions between residues are observed. rf values show a slow decrease towards random when the distance threshold increases. To assess the relevance of this observation, we have computed the difference between rf for C 8 and rf for C 20, and
evaluated if the differences are correlated with the initial values of rf of C 8. It is also
possible to simply compute the correlation between rf for C 8 and rf for C 20. Nonetheless,
the first approach allows looking at the contacts that are specifically found at distance more than 8 Å. The excellent Pearson’s correlation coefficient of (PCC) of 0.94 shows that the correlation is obvious (see Figure 6). Only the Cysteine - Cysteine interaction decreases more strongly than the others, it passes from the high rf value of 6.14 to 1.90.
Comparison with SC highlights strong dissimilarities. Inter-residue interactions are different. The PCC between (A) the rf of C 8 and (b) those of SC4 is only equal to 0.52.
Naturally, the more the value of increases, the more SC4 values tend towards those of C 8.
For SC20, PCC largely increased to 0.70. Between C 8 and SC4, the average of the rf
differences equals to 0.42, and, more of the 2/3 of interactions have a difference value higher than 0.20, the threshold previously used for analysis. Aromatic residues (W, F and Y) and especially the Tryptophan have the most important rf gains with SC4 (10 couples have gains
more than one unit, for example W-W passes from 1.50 to 2.88). Histidine - Histidine interaction, a well studied interaction [107], presents also an increase of the rf value from 1.37 to 2.55. Cysteine - Cysteine interaction has a rf value higher than 10. In contrast, Glycine is the residue which loses the most; 18 of the 20 amino acids which are in contacts with it are
of side chain of Glycine is an easy explanation. It is implied in changes of local topology, the number of stabilizing connections is thus weaker and it has the smallest volume. This assertion is corroborated by the reduction in the rf value of Asparagine (N) with Glycine (G) from 1.29 to 0.66, N is known to interact with the polypeptide backbone [114, 115].
Side-chain replacements.
Contacts induced by side-chain conformation predictions. Homology modelling or de
novo approaches, implies the use of prediction methods for placing the side chains [116]. We
analyzed the influence of this type of approach on the distribution of the contacts, i.e. the validity of the approach in the context of contact prediction. Thus, we tested several different software : SCWRL, SCATD, IRECS, SCAP and SSCOMP. All these conformation prediction methods add side-chains to a protein backbone using backbone-dependent rotamer library. The library provides lists of 1- 2- 3- 4 values and their relative probabilities for residues at
given - values. The methods explore these conformations to minimize side-chain-backbone clashes and side-chain-side-chain clashes. For instance, SCWRL represents the side-chains as graphs and used dead-end elimination step, based on the simple Goldstein criterion to determine reasonable clusters of rotamers [92]. Being presently, the most commonly used method, we have deeply analyzed its results. Moreover, this method is very fast.
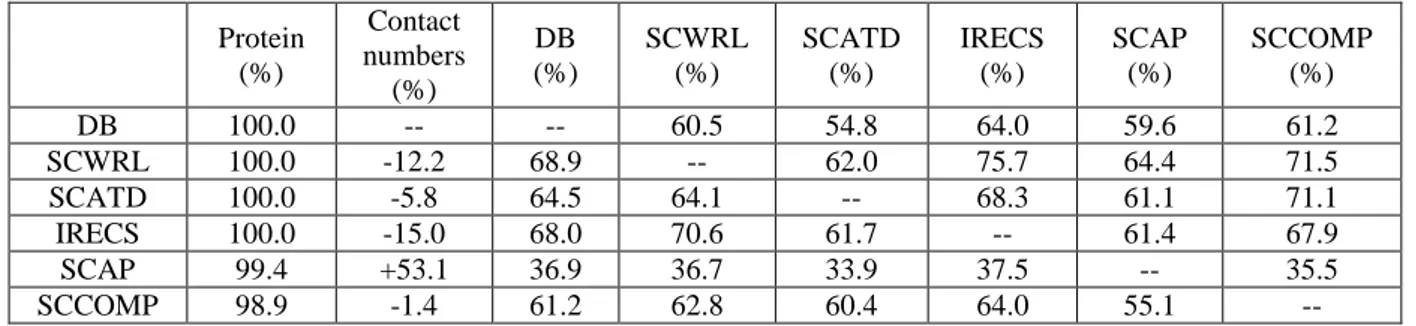
All the side chains of the proteins of our databank have been repositioned. Only 0.6% of proteins can not be treated by SCAP and 1.1% by SCCOMP. Analysis of contacts distributions for these predicted side-chains was carried out for the distances C with = 8 Å and SC with equals to 4 Å. For C 8, the new positions of the side chains by SCWRL involve
a light reduction in the average number of contacts (5% less). The contacts are rather close to those observed in the protein databank (92.8% in common). Similar results are observed for IRECS, SCCOMP and SCATD. At the opposite, SCAP generates a higher number of contacts
(+22%).
With SC4, the number of contacts is smaller than found for the protein databank with
most of the methods, i.e. between -1.4% for SCCOMP and -15.0% for IRECS (see Table 4). Only SCAP behaves very differently. It generates 53 % more contacts than observed. We can also notice that computation time per proteins was greatly superior with this approach.
Interestingly, even if the prediction methods give roughly the same number of contacts, they predict different contacts. For instance, SCWRL prediction rate for angle 1 position is
quite good [92]. If we consider contacts, e.g. SC4, it is not the case; SCWRL has only 55% of
common contacts observed in the protein databank. The difference is thus far from being negligible. An analysis carried out according to accessibility, shows that hidden residues are slightly better in concord (64%) with SC4 than those exposed (49%). This result corroborates
well the data of the literature on the quality of the side chain predictions [84, 93]. All methods find between 55% and 65% of the contacts observed in the protein databank, but at most they share ¾ of them (75.7 % of contacts defined by SCWRL are found by IRECS, and 70% by IRECS are also observed by SCWRL). Even with SCAP, that have 53 % more contacts than observed, finds only 59.6% of the true contacts and shares between 55.1% and 64.4% of the contacts find by the other prediction methods. Thus, the contacts predicted by the different methods are clearly not the same.
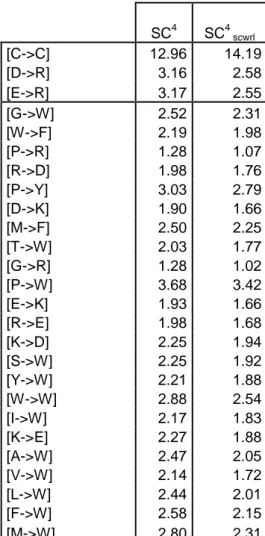
Amino acid contact preferences with side-chain conformation prediction methods. At a global level, few rf variations before and after replacement are observed. However, some tendencies can be noticed. To evaluate the potential impact of these variations on the favoured protein contacts, the average difference between rf values for SC4 have been computed and
are shown in Table 5. These values are low; they range from 0.049 to 0.096 with the notable exception of SCAP for which difference values are comprised in the range from 0.210 to
0.244. Strangely, most of the methods have higher average rf value divergence with the protein databank (SCWRL 0.074, SCATD 0.096, SCAP 0.244 and SCCOMP 0.062) than between themselves. From this global point of view, SCWRL, SCATD, IRECS and SCCOMP seem to be quite equivalent and SCAP an outlier.
For SCWRL (see Table 6), the rf of the charged interactions are weaker after replacement of side chains (more than 0.2 of difference with SC4). It is an important loss, but
comprehensible as the exposed rotamers are more difficult to place. At the opposite, rf of Cysteine – Cysteine interaction increases again. The weight of the "positioning" of the disulphide bridges can explain this observation. Lastly, the rf of amino acids associated to Tryptophan strongly decreases (12 amino acids). W being the biggest amino acids, the prediction of its side-chain conformation is associated to an important 3D space. Thus, use of predicted side-chain position shows a limited number of differences in terms of preferential amino acid contacts. Nonetheless, all the interactions implicated in theses divergences are of major importance, and, theses variations of rf are thus less negligible than at first sight.
SCCOMP amino acid contact rf values are very close to the one of the protein databank. Only 16 rf values have a difference higher than 0.2. These variations touch only overrepresented associations. Moreover, they are mainly the same associations as observed for SCWRL, i.e. 13 of the 16 variations are also found with SCWRL (see Table 4). Interestingly, the rf values of Cysteine – Cysteine interaction is quite identical to the one of the protein databank, i.e. 12.95 vs. 12.96.
IRECS has similar behaviours with 21 rf values having a difference higher than 0.2 with the protein databank and 14 found also by SCWRL. Its C-C rf value is higher, i.e. 13.94. The divergences of amino acid associations already highlighted by SCWRL are higher with this method. These latter mainly impacts charged residues (D, E, R and K), e.g. R association with E goes from 1.76 for SCWRL to 2.09 for IRECS.
Precise analysis of SCATD shows a high similarity with SCWRL results. Indeed, 23 of the 26 variations of SCWRL better than 0.2 (cf. Table 4) are also determined by SCATD.
SCAP is associated to the highest number of contacts and shows a high difference of rf values from the protein databank and all positioning methods. SCAP has 37 rf values variation higher than 0.5 in regards to the protein databank, 10 are inversions, 1 is an increase (rf value of N interaction with E climbs from 1.01 to 1.53) and others are diminution. Indeed, for the great majority of rf values, SCAP values diminished with respect to the protein databank values, i.e. specificities are lost.
Analysis of C for SCAP reinforces this analysis. Firstly, SCAP still generates a higher number of contacts (+22%). Nonetheless, 99.6% of the native contacts are described by SCAP. Average divergence of rf values is lower than previously seen for SC4, i.e. 0.037
and only 10 amino acid couples have rf value deviation more than 0.2.
Discussion
Contact maps are a widely used approach to analyse protein structures, protein folding molecular dynamic simulations, to define coarse grain potentials or to superimpose protein structures [117-121]. This short survey on protein contacts with different views aims at: (i) analyzing different measures and distance thresholds. Indeed, analysis and prediction methods used sometimes very different measurements, and highlighting significant differences could give new insights for future works. Thus, our research has been done on a recent non-redundant protein databank. (ii) comparing different side – chain prediction methods. We have highlighted mainly two points. From a classical point of view, most-side chain prediction methods yield very similar results. Firstly, we show that according to a contact distance criteria it is not the case. Secondly, this last point has repercussion on the distribution
of amino acid interactions.
Analysis of the protein databank shows that the increase of databank size does not influence the features examined, for instance, on accessibility [122]. The distribution of the average contact number is clearly dependent on atoms chosen as references. One of the most interesting results is the fact that contacts taken into account according to a given type of distance is not compulsorily taken into account by another one, e.g. only 22% of the contacts of SC4 are considered by C 8. As we showed with reduced amino acid alphabets, the use of
different definitions could lead to diverging results [123]. Distribution of the privileged interactions shows expected results, like the importance of Cysteine and of aromatic residues [105, 106, 124-130]. Specificities are found according to the distance in the sequence between residues in contact. Some differences are observed compared to the literature. For instance, our results are not directly in agreement with the results presented by Brocchieri and Karlin on near, far and very far range in the sequence [131]. Indeed, these authors studied the number of occurrence of contacts whereas we analyzed the preferences by the use of the relative frequencies. Thus, they did not see the significance of aromatic interactions for near contacts as it was shown in other studies [23]. A contrario, our observations on Tryptophan are in agreement with literature [106] as most studies on specific interactions between residues are mainly devoted to close side-chain interactions. Concerning influence of the protein sizes, only the small proteins have particular characteristics, with key roles for W, C, M and H. The analysis of rf differences between SC4 and C 8 reinforces our first observation:
different contacts are taken into account and thus different interactions are highlighted with W, F, Y, H, C. At the opposite, contacts with Glycine are underprivileged.
For protein larger than 150 residues, the chain length of the chain does not have an impact. At the opposite, small proteins show strong specificities even if they have classical amino acid distribution. Cysteine and Tryptophan contact numbers are higher. This could
have some importance for protein modelling approach. At the opposite, amino acids frequencies according to SCOP classes diverge clearly from databank values, but it has few consequences on rf values. Nonetheless, we could notice specialisation according to protein classes.
In the same way, prediction of side-chain positioning also shows strong divergences; SCWRL prediction gives only 55% of contacts in common with SC4. This result reveals that
the percentage of correctly positioned rotamers is not the only way to assess the correctness of a prediction. More precisely, SCWRL brings an over-representation of the disulphide bridges and decreases the interactions between charged residues. This may be due to the importance of the energetic term in the new SCWRL [92]. The interactions with Tryptophan are also badly evaluated: it is clearly related with the poor 2 rotamer prediction rate of this huge
amino acid [92]. For charged residues, the poor prediction is linked to their high accessibilities, i.e. they are difficult to predict and frequently associated to lower electron density [132]. Nonetheless, a step of molecular minimization of the structures with side chains repositioned by SCWRL could be done to know if these errors can be corrected. It could be especially interesting for SCAP which uses a classical forcefield that strongly influence on the results.
The prediction accuracies for 1 and 1+2 dihedral angles are 82.6% and 73.7%,
respectively for SCWRL and SCAP, 88.5% and 79.2% for SCCOMP, 94 % and 89 % for SCAP and 84.7% and 71.6% for IRECS as given in their respective papers. Thus, most side-chain prediction methods yield very good prediction rates. In many ways this is due (i) to the relative similarity of methods and (ii) to rotamer libraries that share also great similarity. The difference we observe shows that a prediction assessment simply based on 1 and 1+2 as
some limitation and mask significant differences in the predicted structures. Indeed, other angles are very important like for aromatic and aliphatic residues, and these angles are not
assessed for each method. At the opposite, for side-chain distances, positions of all atoms are important. In the same way, due to the absence of correct representation of the solvent, prediction of exposed residues is difficult to evaluate. The crystal could also constrain exposed residues and so most of prediction accuracy is given only for core residues [94]. This study highlights the interest of using other criteria to evaluate side-chain prediction methods. Moreover, it could have consequence on protein structure modelling.
A simple fact is observed here: methods have recurrent biases that have been highlighted by the computation of rf values. Hence, it will be possible to correct it using this information. In the same way, it could be interesting to combine multiple to create a consensus approach.
For future works, we would like to go deeper in this analysis, but also analyze protein structure dissection done by the Protein Peeling approach. This latter dissects a protein into Protein Units (PUs). A PU is a compact sub-region of the 3D structure. Protein Peeling works from the C -contact matrix translated into contact probabilities with an optimization procedure [133, 134]. We will characterize the potential specificities of contacts within PUs (intra-PUs) or at the interface, between PUs (inter-PUs).
Acknowledgments
The authors want to express their appreciation and wish to acknowledge the contribution of Pr. Catherine Etchebest for her kind help in the course of this research. This work was supported by French Institute for Health and Medical Care (INSERM) and University Paris Diderot – Paris 7. AB benefits from a grant of the Ministère de la Recherche.
Figure Legends
Figure 1. Venn diagram grouping amino acids according to their properties (adapted from
[1, 2]). The representation has been done using PyMol [135].
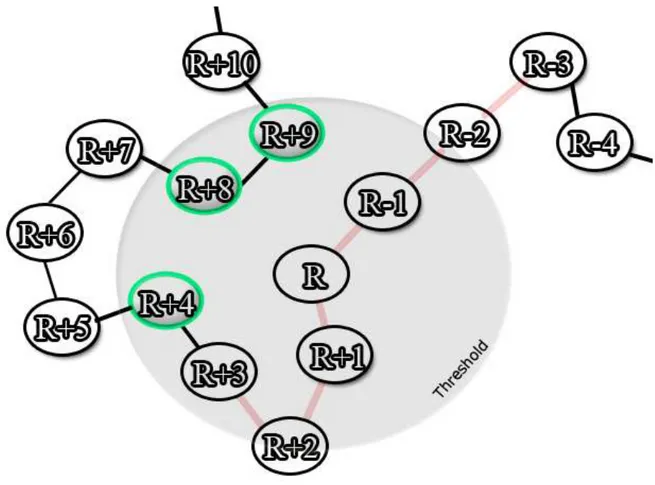
Figure 2. Contact definition. The gray circle represents the distance threshold , i.e. the
authorized maximum distance. In red the neighboring of the residue R is indicated (with D = 6 residues are not taken into account for the analysis). The residues in green are considered in contact with the residue R.
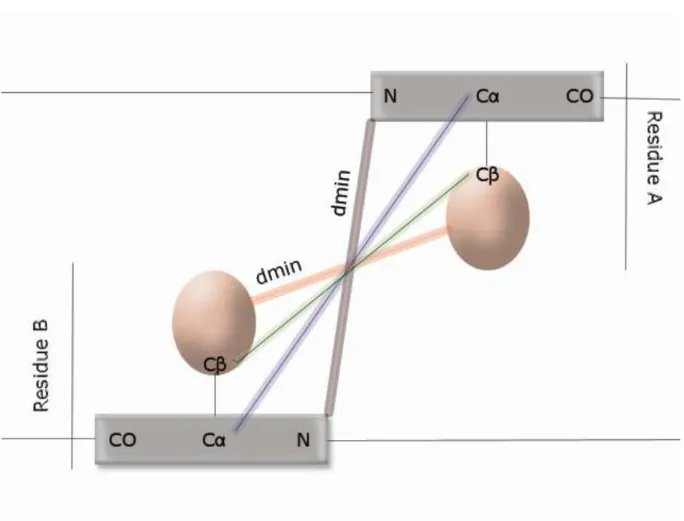
Figure 3. Schematic representation of various distances: (blue) distance C - C , (green)
distance C - C (red) minimal distances between heavy atoms of the side chains of the two residues, (grey) minimal distance between heavy atoms of the protein backbone of the two residues.
Figure 4. Evolution of the mean contacts number per residue. (x-axis) threshold , (y-axis)
mean number of contacts. Distances C , C , BB, SC and ALL are given; the distance C with side-chains replaced by SCWRL is also shown.
Figure 5. Relative accessibility according to the mean number of contacts for C 8.
Figure 6. Correlation between (x-axis) the difference between rf for C 8 and C 20 and (y-axis) rf of C 8.
Table 1. Analysis of contacts according to their proximity in the sequence. aa Near contacts (5 to 20 residues) Far contacts (21 to 50 residues) Far contacts (> 50 residues)
C all all not ARNEKV
W R C Q G Y H K M F P S W I P W Q F P W Y P F M K L I E I F Y Q K P Y F Y W L I M F M Y C H F W Y L M M F M A C M F W Y V T - D T N H - D H S W D E H G - N D Q G H P S R N D Q G H P S T N - - N S - N D D Q - - - P - - Q, E, W V 14 16 9 A - A, L A, I, L, V I V, Y, F, M, K, L, I, A A, R, C, E, I, L, K, M, F, T, W, Y, V I, L, M, F, Y, V, L V L A V L A V L A I
D not 18 not 12 not 14
E not 18 not 18 not 18
R C I K M not 12 not 10
K not 15 not 18 not 18
Table 2. Analysis of contacts according to the size of the proteins. protein length amino acids C 8 <150 150 to 251 251 to 400 > 400 inversion [A→M] 1.12 0.68 1.04 1.07 1.21 [M→A] 1.11 0.69 1.06 1.05 1.20 [C→M] 1.18 0.78 1.18 1.22 1.22 [C→H] 1.09 0.70 1.10 1.17 1.05 [F→M] 1.22 0.86 1.12 1.27 1.24 [K→C] 1.28 0.98 1.22 1.37 1.29 [S→W] 1.12 0.85 1.20 1.08 1.14 [T→H] 1.04 0.80 1.03 1.09 1.03 [W→P] 1.15 0.91 0.97 1.11 1.27 [N→H] 1.08 0.85 1.09 1.14 1.03 [E→S] 1.05 0.84 1.00 1.04 1.10 [S→M] 1.05 0.85 0.96 1.05 1.08 change: [M→C] 1.55 1.17 1.68 1.62 1.55 [H→C] 1.57 1.19 1.70 1.69 1.45 [H→H] 1.35 1.02 1.31 1.33 1.43 [W→S] 0.98 0.67 0.97 0.96 1.04 [Y→C] 1.41 1.11 1.51 1.44 1.41 [Q→Q] 0.86 0.56 0.92 0.80 0.92 [C→A] 0.99 0.71 0.87 1.07 1.03 [A→C] 1.32 1.06 1.22 1.44 1.32 [F→C] 1.50 1.25 1.35 1.61 1.52 [D→H] 1.28 1.05 1.14 1.39 1.25 [K→H] 0.86 0.64 0.85 0.86 0.90 [M→F] 1.27 1.06 1.24 1.29 1.28 [N→N] 1.39 1.52 1.26 1.61 1.21 [V→F] 1.19 1.40 1.23 1.19 1.15 [S→C] 1.48 1.69 1.60 1.48 1.41 [M→L] 1.09 1.30 1.13 1.07 1.08 [R→W] 1.27 1.48 1.32 1.24 1.23 [M→V] 1.39 1.61 1.49 1.49 1.26 [Q→W] 1.30 1.52 1.45 1.27 1.25 [H→V] 1.20 1.42 1.29 1.18 1.15 [Y→I] 1.37 1.59 1.42 1.42 1.28 [K→F] 1.09 1.31 1.13 1.06 1.06 [Y→F] 1.28 1.51 1.28 1.27 1.26 [S→Y] 1.07 1.32 1.14 1.02 1.06 [T→I] 1.24 1.49 1.22 1.27 1.20 [H→Y] 1.11 1.38 1.22 1.05 1.10 [Y→Y] 1.39 1.67 1.40 1.33 1.40 [F→Y] 1.28 1.56 1.29 1.26 1.26 [W→M] 1.23 1.52 1.09 1.28 1.19 [F→W] 1.27 1.57 1.42 1.26 1.18 [Q→C] 1.38 1.70 1.60 1.27 1.33 [W→F] 1.32 1.66 1.46 1.31 1.23 [M→M] 1.67 2.01 1.54 1.74 1.55 [H→F] 1.15 1.49 1.30 1.09 1.11 [W→W] 1.50 1.85 1.34 1.51 1.52 [D→C] 1.33 1.70 1.50 1.35 1.20 [K→W] 1.04 1.42 1.08 1.03 1.00
[C→W] 1.13 1.59 1.15 1.22 0.95
[M→W] 1.23 1.77 1.18 1.25 1.19
[W→C] 1.47 2.05 1.52 1.65 1.21
[C→C] 6.14 9.51 6.88 4.97 5.47
G. P. I. L nothing special
bold : difference > 0.2; italics : < 0.1. underline : change
Table 3. Analysis of protein contacts within SCOP classes.
C 8 all- all- / inversion [H→W] 1.21 1.77 1.02 0.95 1.22 [W→W] 1.50 1.80 1.60 1.54 0.98 [W→H] 1.09 1.47 0.94 0.92 1.17 [N→N] 1.39 1.21 1.34 1.51 0.93 [C→W] 1.13 0.99 1.17 0.89 1.37 [C→M] 1.18 0.95 1.34 1.17 0.94 [W→Q] 0.89 0.80 0.87 0.83 1.16 [H→P] 1.03 1.24 0.90 1.05 0.89 [C→H] 1.09 0.81 1.19 1.08 1.09 [M→W] 1.23 1.27 1.26 1.08 0.96 [M→P] 0.93 1.05 0.86 0.99 0.72 [K→P] 0.92 1.14 0.79 0.93 0.96 [R→P] 1.03 1.24 0.93 0.99 0.96 [H→M] 1.14 0.92 1.20 1.22 1.08 [N→W] 1.08 0.87 1.04 1.15 1.17 [M→H] 1.04 0.83 1.12 1.11 1.01 [P→M] 1.07 1.08 1.05 1.12 0.86 [W→M] 1.23 1.16 1.24 1.15 0.98 change: [M→M] 1.67 1.73 1.88 1.68 1.67 [E→C] 1.29 1.05 1.31 1.24 1.17 [G→H] 1.10 1.00 1.14 1.12 1.30 [C→R] 0.70 0.74 0.91 0.58 0.73 [C→F] 1.18 1.44 1.15 1.16 1.14 [W→N] 0.86 0.62 0.85 0.96 0.88 [P→C] 1.40 1.11 1.22 1.46 1.30 [W→P] 1.15 1.41 1.09 1.17 1.08 [P→W] 1.33 1.59 1.36 1.25 1.26 [D→H] 1.28 1.20 1.41 1.25 1.55 [A→C] 1.32 1.41 1.10 1.39 1.49 [T→C] 1.34 1.06 1.23 1.47 1.41 [H→H] 1.35 1.26 1.43 1.31 1.70 [M→C] 1.55 1.18 1.68 1.56 1.28 [H→C] 1.57 1.11 1.59 1.58 1.57 [Q→W] 1.30 1.30 1.17 1.20 1.69 [W→C] 1.47 1.13 1.45 1.25 1.90 [C→C] 6.14 7.91 7.18 4.55 5.73 I. L. F. S. Y. V nothing special
bold : difference > 0.2; italics : < 0.1. underline : change
Table 4. Analysis of contacts predicted by side-chain conformation prediction methods (for SC4). Protein (%) Contact numbers (%) DB (%) SCWRL (%) SCATD (%) IRECS (%) SCAP (%) SCCOMP (%) DB 100.0 -- -- 60.5 54.8 64.0 59.6 61.2 SCWRL 100.0 -12.2 68.9 -- 62.0 75.7 64.4 71.5 SCATD 100.0 -5.8 64.5 64.1 -- 68.3 61.1 71.1 IRECS 100.0 -15.0 68.0 70.6 61.7 -- 61.4 67.9 SCAP 99.4 +53.1 36.9 36.7 33.9 37.5 -- 35.5 SCCOMP 98.9 -1.4 61.2 62.8 60.4 64.0 55.1 --
Table 5. Difference of rf values between side-chain predictionconformation methods (values x 10-2).
DB SCWRL SCATD IRECS SCAP SCCOMP
DB -- 7.4 9.6 5.7 24.4 6.2 SCWRL -- -- 4.0 5.1 22.0 4.6 SCATD -- -- -- 6.6 21.0 5.6 IRECS -- -- -- -- 23.0 4.9 SCAP -- -- -- -- -- 22.0 SCCOMP -- -- -- -- -- --
Table 6. Analysis of amino acid contact with side-chain prediction conformation method SCWRL. SC4 SC4 scwrl [C->C] 12.96 14.19 [D->R] 3.16 2.58 [E->R] 3.17 2.55 [G->W] 2.52 2.31 [W->F] 2.19 1.98 [P->R] 1.28 1.07 [R->D] 1.98 1.76 [P->Y] 3.03 2.79 [D->K] 1.90 1.66 [M->F] 2.50 2.25 [T->W] 2.03 1.77 [G->R] 1.28 1.02 [P->W] 3.68 3.42 [E->K] 1.93 1.66 [R->E] 1.98 1.68 [K->D] 2.25 1.94 [S->W] 2.25 1.92 [Y->W] 2.21 1.88 [W->W] 2.88 2.54 [I->W] 2.17 1.83 [K->E] 2.27 1.88 [A->W] 2.47 2.05 [V->W] 2.14 1.72 [L->W] 2.44 2.01 [F->W] 2.58 2.15 [M->W] 2.80 2.31
Reference
[1] Taylor W.R., The classification of amino acid conservation, J Theor Biol 119 (1986) 205-218.
[2] Livingstone C.D., Barton G.J., Protein sequence alignments: a strategy for the hierarchical analysis of residue conservation, Comput Appl Biosci 9 (1993) 745-756.
[3] Rost B., Review: protein secondary structure prediction continues to rise, J Struct Biol 134 (2001) 204-218.
[4] Jones D.T., Protein secondary structure prediction based on position-specific scoring matrices, J Mol Biol 292 (1999) 195-202.
[5] Pollastri G., McLysaght A., Porter: a new, accurate server for protein secondary structure prediction, Bioinformatics 21 (2005) 1719-1720.
[6] Moult J., Fidelis K., Zemla A., Hubbard T., Critical assessment of methods of protein structure prediction (CASP)-round V, Proteins 53 Suppl 6 (2003) 334-339.
[7] Fiser A., Dosztanyi Z., Simon I., The role of long-range interactions in defining the secondary structure of proteins is overestimated, Comput Appl Biosci 13 (1997) 297-301.
[8] Offmann B., Tyagi M., de Brevern A.G., Local Protein Structures, Current Bioinformatics 2 (2007) 165-202.
[9] de Brevern A.G., Etchebest C., Hazout S., Bayesian probabilistic approach for predicting backbone structures in terms of protein blocks, Proteins 41 (2000) 271-287.
[10] de Brevern A.G., Hazout S., 'Hybrid protein model' for optimally defining 3D protein structure fragments, Bioinformatics 19 (2003) 345-353.
[11] Schuchhardt J., Schneider G., Reichelt J., Schomburg D., Wrede P., Local structural motifs of protein backbones are classified by self-organizing neural networks, Protein Eng 9 (1996) 833-842.
[12] Unger R., Harel D., Wherland S., Sussman J.L., A 3D building blocks approach to analyzing and predicting structure of proteins, Proteins 5 (1989) 355-373.
[13] Sander O., Sommer I., Lengauer T., Local protein structure prediction using discriminative models, BMC Bioinformatics 7 (2006) 14.
[14] de Brevern A.G., Etchebest C., Benros C., Hazout S., "Pinning strategy": a novel approach for predicting the backbone structure in terms of protein blocks from sequence, J Biosci 32 (2007) 51-70.
[15] Etchebest C., Benros C., Hazout S., de Brevern A.G., A structural alphabet for local protein structures: improved prediction methods, Proteins 59 (2005) 810-827.
[16] Tyagi M., Gowri V.S., Srinivasan N., de Brevern A.G., Offmann B., A substitution matrix for structural alphabet based on structural alignment of homologous proteins and its applications, Proteins 65 (2006) 32-39. [17] Tyagi M., Sharma P., Swamy C.S., Cadet F., Srinivasan N., de Brevern A.G., Offmann B., Protein Block Expert (PBE): a web-based protein structure analysis server using a structural alphabet, Nucleic Acids Res 34 (2006) W119-123.
[18] Tyagi M., de Brevern A.G., Srinivasan N., Offmann B., Protein structure mining using a structural alphabet, Proteins (2008) in press.
[19] Dudev M., Lim C., Discovering structural motifs using a structural alphabet: application to magnesium-binding sites, BMC Bioinformatics 8 (2007) 106.
[20] Hvidsten T.R., Kryshtafovych A., Komorowski J., Fidelis K., A novel approach to fold recognition using sequence-derived properties from sets of structurally similar local fragments of proteins, Bioinformatics 19 Suppl 2 (2003) ii81-91.
[21] Baker E.N., Hubbard R.E., Hydrogen bonding in globular proteins, Prog Biophys Mol Biol 44 (1984) 97-179.
[22] Burley S.K., Petsko G.A., Weakly polar interactions in proteins, Adv Protein Chem 39 (1988) 125-189.
[23] Brandl M., Weiss M.S., Jabs A., Suhnel J., Hilgenfeld R., C-H.pi-interactions in proteins, J Mol Biol 307 (2001) 357-377.
[24] Weiss M.S., Brandl M., Suhnel J., Pal D., Hilgenfeld R., More hydrogen bonds for the (structural) biologist, Trends Biochem Sci 26 (2001) 521-523.
[25] Mitchell J.B., Thornton J.M., Singh J., Price S.L., Towards an understanding of the arginine-aspartate interaction, J Mol Biol 226 (1992) 251-262.
[26] Stickle D.F., Presta L.G., Dill K.A., Rose G.D., Hydrogen bonding in globular proteins, J Mol Biol 226 (1992) 1143-1159.
[27] Rose G.D., Wolfenden R., Hydrogen bonding, hydrophobicity, packing, and protein folding, Annu Rev Biophys Biomol Struct 22 (1993) 381-415.
[28] Gromiha M.M., Selvaraj S., Importance of long-range interactions in protein folding, Biophys Chem 77 (1999) 49-68.
[29] Bahar I., Kaplan M., Jernigan R.L., Short-range conformational energies, secondary structure propensities, and recognition of correct sequence-structure matches, Proteins 29 (1997) 292-308.
[30] Russell R.B., Saqi M.A., Bates P.A., Sayle R.A., Sternberg M.J., Recognition of analogous and homologous protein folds--assessment of prediction success and associated alignment accuracy using empirical substitution matrices, Protein Eng 11 (1998) 1-9.
[31] Drablos F., Clustering of non-polar contacts in proteins, Bioinformatics 15 (1999) 501-509.
[32] Gromiha M.M., Thangakani A.M., Selvaraj S., FOLD-RATE: prediction of protein folding rates from amino acid sequence, Nucleic Acids Res 34 (2006) W70-74.
[33] Capriotti E., Casadio R., K-Fold: a tool for the prediction of the protein folding kinetic order and rate, Bioinformatics 23 (2007) 385-386.
[34] Punta M., Rost B., Protein folding rates estimated from contact predictions, J Mol Biol 348 (2005) 507-512.
[35] Zhang L., Skolnick J., How do potentials derived from structural databases relate to "true" potentials? Protein Sci 7 (1998) 112-122.
[36] Miyazawa S., Jernigan R.L., Residue-residue potentials with a favorable contact pair term and an unfavorable high packing density term, for simulation and threading, J Mol Biol 256 (1996) 623-644.
[37] Heringa J., Argos P., Side-chain clusters in protein structures and their role in protein folding, J Mol Biol 220 (1991) 151-171.
[38] Dosztanyi Z., Fiser A., Simon I., Stabilization centers in proteins: identification, characterization and predictions, J Mol Biol 272 (1997) 597-612.
[39] Kannan N., Selvaraj S., Gromiha M.M., Vishveshwara S., Clusters in alpha/beta barrel proteins: implications for protein structure, function, and folding: a graph theoretical approach, Proteins 43 (2001) 103-112.
[40] Dedmon M.M., Lindorff-Larsen K., Christodoulou J., Vendruscolo M., Dobson C.M., Mapping long-range interactions in alpha-synuclein using spin-label NMR and ensemble molecular dynamics simulations, J Am Chem Soc 127 (2005) 476-477.
[41] Gugolya Z., Dosztanyi Z., Simon I., Interresidue interactions in protein classes, Proteins 27 (1997) 360-366.
[42] Baker D., A surprising simplicity to protein folding, Nature 405 (2000) 39-42.
[43] Pandit A.D., Jha A., Freed K.F., Sosnick T.R., Small proteins fold through transition states with native-like topologies, J Mol Biol 361 (2006) 755-770.
[44] Paci E., Lindorff-Larsen K., Dobson C.M., Karplus M., Vendruscolo M., Transition state contact orders correlate with protein folding rates, J Mol Biol 352 (2005) 495-500.
[45] Plaxco K.W., Simons K.T., Baker D., Contact order, transition state placement and the refolding rates of single domain proteins, J Mol Biol 277 (1998) 985-994.
[46] Grana O., Baker D., MacCallum R.M., Meiler J., Punta M., Rost B., Tress M.L., Valencia A., CASP6
assessment of contact prediction, Proteins 61 Suppl 7 (2005) 214-224.
[47] Olmea O., Valencia A., Improving contact predictions by the combination of correlated mutations and other sources of sequence information, Fold Des 2 (1997) S25-32.
[48] Hamilton N., Burrage K., Ragan M.A., Huber T., Protein contact prediction using patterns of correlation, Proteins 56 (2004) 679-684.
[49] Fariselli P., Olmea O., Valencia A., Casadio R., Progress in predicting inter-residue contacts of proteins with neural networks and correlated mutations, Proteins Suppl 5 (2001) 157-162.
[50] Fariselli P., Olmea O., Valencia A., Casadio R., Prediction of contact maps with neural networks and correlated mutations, Protein Eng 14 (2001) 835-843.
[51] Lund O., Frimand K., Gorodkin J., Bohr H., Bohr J., Hansen J., Brunak S., Protein distance constraints predicted by neural networks and probability density functions, Protein Eng 10 (1997) 1241-1248.
[52] Pollastri G., Baldi P., Fariselli P., Casadio R., Improved prediction of the number of residue contacts in proteins by recurrent neural networks, Bioinformatics 17 Suppl 1 (2001) S234-242.
[53] Pollastri G., Baldi P., Prediction of contact maps by GIOHMMs and recurrent neural networks using lateral propagation from all four cardinal corners, Bioinformatics 18 Suppl 1 (2002) S62-70.
[54] Punta M., Rost B., PROFcon: novel prediction of long-range contacts, Bioinformatics 21 (2005) 2960-2968.
[55] Taylor W.R., Evolutionary transitions in protein fold space, Curr Opin Struct Biol 17 (2007) 354-361. [56] Joshi R.R., A Decade of Computing to Traverse the Labyrinth of Protein Domains, Current Bioinformatics 2 (2007) 113-131.
[57] Holland T.A., Veretnik S., Shindyalov I.N., Bourne P.E., Partitioning protein structures into domains: why is it so difficult? J Mol Biol 361 (2006) 562-590.
[58] Ponting C.P., Russell R.R., The natural history of protein domains, Annu Rev Biophys Biomol Struct 31 (2002) 45-71.
[59] Holm L., Sander C., Parser for protein folding units, Proteins 19 (1994) 256-268.
[60] Siddiqui A.S., Barton G.J., Continuous and discontinuous domains: an algorithm for the automatic generation of reliable protein domain definitions, Protein Sci 4 (1995) 872-884.
[61] Dengler U., Siddiqui A.S., Barton G.J., Protein structural domains: analysis of the 3Dee domains database, Proteins 42 (2001) 332-344.
[62] Siddiqui A.S., Dengler U., Barton G.J., 3Dee: a database of protein structural domains, Bioinformatics 17 (2001) 200-201.
[63] Swindells M.B., A procedure for detecting structural domains in proteins, Protein Sci 4 (1995) 103-112. [64] Holm L., Sander C., Dictionary of recurrent domains in protein structures, Proteins 33 (1998) 88-96. [65] Wernisch L., Hunting M., Wodak S.J., Identification of structural domains in proteins by a graph heuristic, Proteins 35 (1999) 338-352.
[66] Xu Y., Xu D., Gabow H.N., Protein domain decomposition using a graph-theoretic approach, Bioinformatics 16 (2000) 1091-1104.
[67] Guo J.T., Xu D., Kim D., Xu Y., Improving the performance of DomainParser for structural domain partition using neural network, Nucleic Acids Res 31 (2003) 944-952.
[68] Alexandrov N., Shindyalov I., PDP: protein domain parser, Bioinformatics 19 (2003) 429-430.
[69] Zhou H., Xue B., Zhou Y., DDOMAIN: Dividing structures into domains using a normalized domain-domain interaction profile, Protein Sci 16 (2007) 947-955.
[70] Lesk A.M., Rose G.D., Folding units in globular proteins, Proc Natl Acad Sci U S A 78 (1981) 4304-4308.
[71] Sowdhamini R., Blundell T.L., An automatic method involving cluster analysis of secondary structures for the identification of domains in proteins, Protein Sci 4 (1995) 506-520.
![Table 2. Analysis of contacts according to the size of the proteins. protein length amino acids C 8 <150 150 to 251 251 to 400 > 400 inversion [A→M] 1.12 0.68 1.04 1.07 1.21 [M→A] 1.11 0.69 1.06 1.05 1.20 [C→M] 1.18 0.78 1.18](https://thumb-eu.123doks.com/thumbv2/123doknet/14615897.546306/30.892.124.704.161.1148/table-analysis-contacts-according-proteins-protein-length-inversion.webp)