HAL Id: hal-02191212
https://hal.archives-ouvertes.fr/hal-02191212
Submitted on 8 Dec 2020
HAL is a multi-disciplinary open access
archive for the deposit and dissemination of
sci-entific research documents, whether they are
pub-lished or not. The documents may come from
teaching and research institutions in France or
abroad, or from public or private research centers.
L’archive ouverte pluridisciplinaire HAL, est
destinée au dépôt et à la diffusion de documents
scientifiques de niveau recherche, publiés ou non,
émanant des établissements d’enseignement et de
recherche français ou étrangers, des laboratoires
publics ou privés.
Synthesis and photoluminescence of Eu3+ activated
alkali mixed (Li, Na)Y(PO3)4 under VUV-UV
excitation
S. Sebai, D. Zambon, A. Watras, P.J. Dereń, A. Megriche, Rachid Mahiou
To cite this version:
S. Sebai, D. Zambon, A. Watras, P.J. Dereń, A. Megriche, et al.. Synthesis and photoluminescence of
Eu3+ activated alkali mixed (Li, Na)Y(PO3)4 under VUV-UV excitation. Optical Materials, Elsevier,
2019, 92, pp.217-222. �10.1016/j.optmat.2019.04.037�. �hal-02191212�
1 Introduction
One important strategy to further enhance the VUV absorption lies in broadening the light absorption in this VUV wavelength region. The mixing of phosphors is a common solution in the case of obtaining a desired color in the case of WLED. However, the VUV region is very sensitive for the considered materials for such purpose, since the deep penetration is very weak and is very affected by the surface of the grains constituting the phosphor (grain size, morphology) [1]. Consequently the collected fluorescence under VUV excitation is not really representative of the mixture of phosphors when this solution is needed. For this reason, we have explored the possibility to develop strategy where the broadening of the VUV absorption can be reached by one pot synthesis since tunability of the band gap can be allowed simply by modifying the alkali ions in the case of phosphates. Adjusting the ratio between mixed alkali ions in the same material is a promising solution.The luminescence of mixed alkali rare earth cyclo- or poly-phosphates with respective formulas MREP4O12 or MRE(PO3)4 (M = alkali and RE = rare earth ions) has attracted much attention during the last decades. These compounds are characterized by relatively large cyclic anions or long chains built up by PO43−3- tetrahedral connected from each other by at least one or two corners. Such structures are favorable for designing rare-earth (RE)-based
Synthesis and photoluminescence of Eu
3+activated alkali mixed (Li, Na)Y(PO
3)
4under VUV-UV excitation
S. Sebaia, b D. Zambonb A. Watrasc P.J. Dereńc A. Megrichea R. Mahioub, ∗ Rachid.Mahiou@uca.fr aUniversité de Tunis El Manar, Faculté des sciences de Tunis, UR11-ES18, Unité de Recherche de Chimie Minérale appliquée, Campus Universitaire Farhat Hached El Manar, 2092, Tunis, Tunisia bUniversité Clermont Auvergne, Institut de Chimie de Clermont Ferrand UMR 6296 CNRS/UBP/Sigma Clermont, Campus des Cézeaux, TSA 60026-CS 60026, F-63000, Clermont-Ferrand, France cInstitute of Low Temperature and Structure Research, Polish Academy of Sciences, ul. Okólna 2, P.O. Box 1410, 50-950, Wroclaw, Poland ∗Corresponding author. AbstractA series of LixNa1-xY(PO3)4: 10% Eu3+ samples (x = 0; 0.25; 0.5; 0.75; 1) were synthesized by a solid state reaction method. They were characterized at room temperature using X-ray diffraction and luminescence spectroscopy. The obtained powders crystallize in monoclinic systems with space groups C2/c and P21/n respectively for x = 1 and x = 0. However, according to XRD data, the LixNa1-x(PO3)4: Eu3+ material seems to be a mixture of the Li and Na homologues when x = 0.5. This situation has been considered as an option to broaden the VUV absorption instead of mixing of both Li and Na based compositions which has been considered as representative of the discrimination between the two extremes. The VUV excitation and emission spectra of as-synthesized compounds were measured. The broad bands near 200 nm in VUV excitation spectra are attributed to both contribution of overlapped O2−2- -Y3+ and O2−2- -Eu3+ absorption charge transfer states while the host absorption band is estimated at 150 nm. The emission spectra are dominated by three bands characteristics of the radiative de-excitation connecting the first excited state 5D
0 of Eu3+ to the main 7F1, 7F2 and 7F4 manifolds of the ground state. Based on Judd–Ofelt (J–O) theory, the intensity parameters (Ω2 and Ω4) have been evaluated from the emission spectra.
phosphors where the distance between the embedded RE is large enough for avoiding the discriminable distance leading to the most common non-radiative pathway. On the other hand, the phosphates have an effective absorption and emission properties under VUV-UV excitation when they are activated by RE ions, notably by Eu3+ [2] and may be applied as phosphor for mercury-free fluorescent lamps or in plasma display panels (PDP).
In that sense, the entire family of MRE(PO3)4 polyphosphate compounds form a nice study material for VUV-UV excited phosphors by selecting an appropriate combination of M and RE ions. Since Y3+ can be substituted by each trivalent lanthanide we decided to use MY(PO3)4 as such potential benchmark and studied the spectroscopy of Eu3+, under Vacuum Ultra Violet (VUV) excitation to determine the VUV region where the anion phosphate groups absorb and to define the potential effect of alkali ions on the luminescence properties.
The MY(PO3)4: Eu3+ phosphors are of particular interest for production of luminescent materials. Various synthesis techniques can be found in literature. However, unlike the solid state reaction approach, most of these methods cannot be applied economically on large scale because of their complicated synthesis routes. Despite that, such synthesis method offers the possibility to check the optical properties in easy way.
Eu3+ is usually the rare earth ion of choice for several studies due to its simple electronic energy level scheme. The electronic configuration of Eu3+ ion is 4f6 and its emission spectrum shows emission lines extending from visible to the near infrared region. Eu3+ ions exhibit pure magnetic and electric dipole transitions which make it a very sensitive probe for the rare earth ion site structure/symmetry. The transition probability of hypersensitive transition with ΔJ = 2 (5D
0→7F2) of Eu3+ ion is depressed under higher symmetric environment whereas the magnetic dipole transitions (5D0→7F1) are not affected by the environment, because they are parity-allowed, and their emission intensities are often used as internal standard [3].
In this context, the present work aims at the synthesis and investigation of Eu3+ doped MY(PO
3)4 polyphosphate with M = Li, Na. The physico-chemical analysis of doped materials was investigated by means of X-Ray diffraction measurements. The results are correlated with the VUV luminescence properties. For such purpose, we exploit the fact that the energy band gaps of the mixed Li/Na compounds do not follow a linear trend (the Vegard's law) in between these two extremes.
Due to the unique luminescent properties of Eu3+ ions, it is quite easy to analyze the luminescent center local surrounding and its symmetry using only emission spectrum. The asymmetry ratio, defined as intensity ratio of forced electric dipole 5D
0→7F2 and magnetic dipole 5D0→7F1 transitions, gives information about surrounding and environmental changes around the Eu3+ ions. Further, the Judd–Ofelt intensity parameters, radiative emission rates and branching ratios were calculated from the luminescence data.
2 Experimental
2.1 Chemical preparation
The polyphosphates LixNa1-xY(PO3)4: 10 mol % Eu3+ (x = 0; 0.25; 0.5; 0.75; 1) were obtained by a conventional solid state reaction. Stoichiometric quantities of high purity lithium carbonate (Li2CO3, Aldrich, 99%), sodium carbonate (Na2CO3, Acros Organics, 99.6%), yttrium oxide (Aldrich, Y2O3, 99.9%), europium oxide (Eu2O3, Aldrich, 99.9%) and ammonium dihydrogenphosphate (NH4H2PO4, Acros Organics, 99+%) were accurately mixed in an agate mortar to ensure a best homogeneity and reactivity. The obtained mixtures were placed in an alumina crucible and pre-heated at 200 °C for 12 h for the decomposition of the alkali carbonates and ammonium dihydrogenphosphate and then at 400 °C for 12 h in air for the completeness of the reaction. The samples were finally cooled inside the furnace to the room temperature.
For commodity, the samples are later on abbreviated as LiY(for LiY(PO3)4: 10% Eu3+; x = 1), NaY(for NaY(PO3)4:10% Eu3+; x = 0) and Li0.5Na0.5Y(for LixNa1-xY(PO3)4: 10% Eu3+; x = 0.5).
2.2 Characterization
Phase identification and related structural properties of phosphors were investigated by X-ray diffraction (XRD) technique thanks to a PANanalytical X'Pert Pro using CuKα radiation (λ = 1.54059 Å) operating at 45 kV and 40 mA. Symmetric (θ-θ) scans were performed from 10° to 80° (2θ) with a step width of 0.05°. The Rietveld refinement method was employed using the FullProf program to estimate the unit cell parameters [4,5].
VUV luminescence excitation spectra were recorded at room temperature using a specific system built by McPherson allowing excitation in the range 112–370 nm. It comprises a 150 W Deuterium lamp monochromatized through Model 234/302 200 mm focal length f/4.5 corrected holographic (1200 L/mm) grating vacuum monochromator. The output beam of the D2 lamp is focused on the sample. The emitted photons are collected at the right angle from the excitation and analyzed utilizing Model 218, 300 mm focal length f/5.3 vacuum crisscross Czerny-Turner plane grating monochromator equipped with Hamamatsu R980 PMT (200–800 nm range). The system operates under vacuum better than 4.10−9 mbar. Fixing the excitation wavelength and scanning the M218 monochromator allows recording the emission spectra. The luminescence spectra were corrected for spectral response of the apparatus (grating, PM, spectral repartition of the D2 lamp). Photoluminescence (PL) spectra were recorded, under UV excitation, at room temperature using as excitation source a CW 450W xenon lamp monochromatized by a TRIAX180 from Jobin-Yvon/Horiba and analyzed by a TRIAX550 Jobin-Yvon/Horiba monochromator equipped either with a R928 Hamamatsu photomultiplier or a nitrogen-cooled CCD camera (Jobin-Yvon LN2 series) as detector.
Luminescence decays were recorded using a second-harmonic generation on a pulsed Nd:YAG OPO Ekspla NT342A laser (3–5 ns pulse duration, 10 Hz, 5 cm−1 line width, 0.3 mJ in the UV). The emitted photons are detected at right angle from the excitation and analyzed through Edinburgh FLS980 spectrometer (Czerny-Turner monochromator, 300 mm focal length, 1200 groove mm−1 grating and minimum band-pass of 0.1 nm) equipped with Hamamatsu R928P PMT (200–870 nm range).
3 Crystallographic background
The long-chain polyphosphates with MIREIII(PO3)4 formula (MI = alkaline ions or Tl+, REIII = trivalent lanthanide and yttrium ions) are known to show seven structural types labeled as I to VII [6,7]. The lithium LiY(PO3)4 and sodium NaY(PO3)4 materials belong to the type I and II respectively and are isotypic with the archetypes LiNd(PO3)4 and NaNd(PO3)4 [8,9].
LiY(PO3)4 crystallizes in the monoclinic system with the C2/c space group and unit cell parameters a = 16.236(5) Å, b = 7.0183(16) Å, c = 9.548(3) Å, β = 125.98(3)°, Z = 4, ICSD card n° 162784 [10]. NaY(PO3)4 crystallizes in the monoclinic system with the P21/n space group and unit cell parameters a = 7.1615(2) Å, b = 13.0077(1) Å, c = 9.7032(3) Å, β = 90.55 (1)o, Z = 4, ICSD card n° 246197 [11].
The basic structural units of these materials are built of infinite chains of helical ribbons (PO3)n formed by corner-sharing of (PO4) tetrahedra. Especially, the crystal structure of LiY(PO3)4 shows a 3D framework made up from corner sharing [PO4] tetrahedra forming 1D zig-zag (PO3)∞ chains parallel to the b axis and 1D chains involving [YO8] and [LiO4] polyhedral. Li+ is tetrahedrally coordinated whereas the Y3+ shows an 8-fold coordination with anti-prismatic geometry. [YO8] and [LiO4] polyhedra are edge-connected featuring straight 1D Y–Li chains parallel to b-axis. Y–Li and phosphate chains are interconnected via corner- and edge-sharing forming the 3D network of LiY(PO3)4.
In NaY(PO3)4, the phosphate infinite chains run along the a direction. The [YO8] polyhedra are distorted antiprisms. The Na coordination is demonstrated to be 8 by El Masloumi et al. [11] forming irregular [NaO8] polyhedra. However, Zhu et al. [12] consider that Na+ ions are hexa-coordinated in NaLa(PO
3)4 materials forming irregular octahedra. Actually, in the yttrium compound [11] the 7th distance in the Na polyhedron is a Na-P one and not a Na-O one. Thus in this work we consider that the Na coordination is equal to 6. [YO8] and [NaO6] polyhedra alternate linearly in a direction surrounded by four (PO3)∞ chains. [YO8] polyhedra share all their oxygen atoms with the corners of neighbouring [PO4] tetrahedra and with the faces of neighbouring [NaO6] polyhedra.
In the sodium material, the [YO8] polyahedra and the (PO3)n chains are less symmetrical than in the lithium homologue. In LiY(PO3)4 and NaY(PO3)4 the Y3+ ions are located in unique crystallographic sites with a C2 symmetry for the Li material and with no symmetry (C1) for the Na compound.
4 Results and discussion
4.1 Phase identification
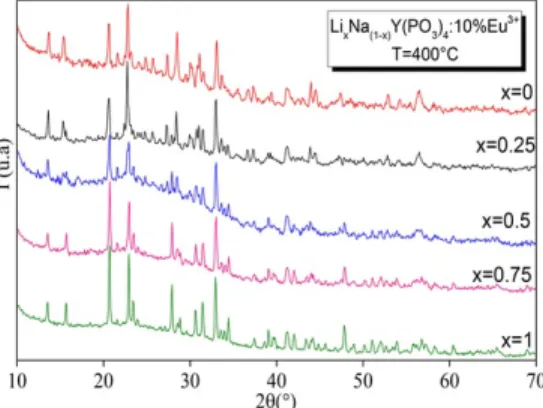
Fig. 1 shows the XRD patterns of the LixNa(1-x)Y(PO3)4: 10% Eu3+ (x = 0; 0.25; 0.5; 0.75; 1) polycrystalline samples prepared by solid state reaction. For the LiY(PO3)4 and NaY(PO3)4 doped samples all the diffraction peaks are well indexed using standard patterns of LiY(PO3)4 (space group C2/c, ICSD #162784) and NaY(PO3)4 (space group P21/n, ICSD #246197). The very small ionic radii difference between Eu3+ (107 pm) and Y3+ (102 pm) ions (taking into account an 8-fold coordination) allows the substitution of Eu3+ ions for Y3+ ones. The doped polyphosphates LiY(PO
3)4: Eu3+ and NaY(PO3)4: Eu3+ are thus observed to be isostructural with the undoped host materials. No by-products are evidenced according to XRD data.
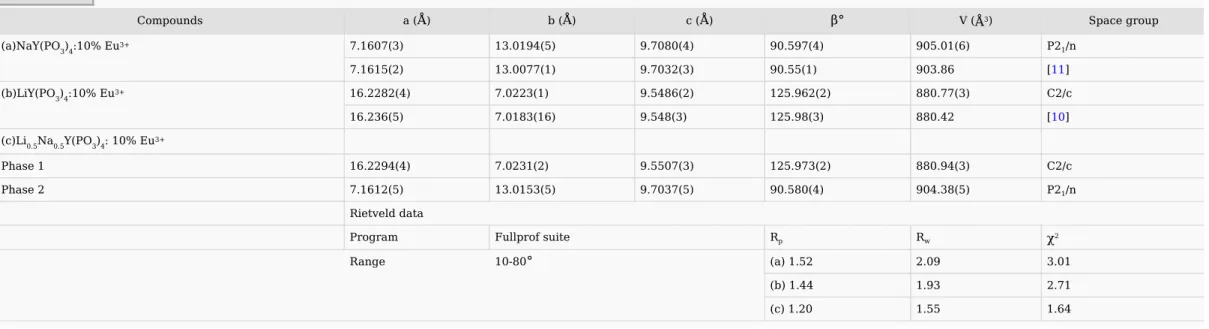
The cell parameters obtained by least squares fitting from XRD data using the Fullprof software [4] are gathered in Table 1. Values are much closer to that already published [10,11]. Moreover, an increasing of the cell volume is observed for the Eu3+ doped samples in comparison with the host materials, due to the fact that Eu3+ has a greater ionic size than Y3+. This means that Y3+ ions were substituted by Eu3+ ones in these polyphosphates.
Table 1 Refined unit cell parameters of LixNa1-xY(PO3)4: 10% Eu3+ (x
=
0; 0.5; 1) obtained by Rietveld refinement of XRD data. alt-text: Table 1
Compounds a (
Å
) b (Å
) c (Å
)β°
V (Å
3) Space group(a)NaY(PO3)4:10% Eu3+ 7.1607(3) 13.0194(5) 9.7080(4) 90.597(4) 905.01(6) P2
1/n
7.1615(2) 13.0077(1) 9.7032(3) 90.55(1) 903.86 [11]
(b)LiY(PO3)4:10% Eu3+ 16.2282(4) 7.0223(1) 9.5486(2) 125.962(2) 880.77(3) C2/c
16.236(5) 7.0183(16) 9.548(3) 125.98(3) 880.42 [10]
(c)Li0.5Na0.5Y(PO3)4: 10% Eu3+
Phase 1 16.2294(4) 7.0231(2) 9.5507(3) 125.973(2) 880.94(3) C2/c Phase 2 7.1612(5) 13.0153(5) 9.7037(5) 90.580(4) 904.38(5) P21/n Rietveld data Program Fullprof suite Rp Rw
χ
2 Range 10-80°
(a) 1.52 2.09 3.01 (b) 1.44 1.93 2.71 (c) 1.20 1.55 1.64The XRD patterns for the x = 0.25 and x = 0.75 samples are very similar to the respective x = 0 and x = 1 patterns indicating that a partial substitution of Li for Na (x = 0.25) or Na for Li (x = 0.75) is possible.
A careful study of the peak positions in the range 10–35° (2θ) for the Li0.5Na0.5Y(PO3)4: 10% Eu3+ sample allows concluding that this sample is a mixture of the stoichiometric LiY(PO3)4: 10% Eu3+ and NaY(PO3)4: 10% Eu3+ materials, indicating that mixing an equal atomic amount of alkaline ions, starting from a mixture of raw lithium and sodium carbonates, in order to obtain a solid solution is not possible for the x = 0.5 sample. By means of the Fullprof software, it was actually possible to identify two phases named 1 and 2 (see Table 1) respectively related to LiY(PO3)4 and NaY(PO3)4. The absence of a total solid solution by substitution of alkali ions in the host materials is obviously due to the large difference between the respective ionic radii (59 pm for Li in a 4-fold coordination and 102 nm for Na in a 6-fold coordination).
The IR and Raman spectra, not presented in this paper, are similar to that reported for LixNa1-xSm(PO3)4 [13].
4.2 Luminescence properties
Fig. 2 shows room temperature VUV-UV excitation spectra of Eu3+ in Li
xNa1-xY(PO3)4: Eu3+ (x = 0; 0.5, 1) by monitoring the most intense peaks observed in the emission spectra which correspond namely to the 5D0→7F1 and 5D
0→7F2 transitions. The results indicate that the shape and the main features of the recorded excitation spectra are independent of the monitored transition. The positions of the main recorded peaks are gathered in Table 2.
Table 2 Positions of the different excitation bands and related transitions of LixNa(1-x)Y(PO3)4: 10% Eu3+ (x
=
0; 0.5; 1). alt-text: Table 2
Sample Position of the Charge Transfer Bands(CTB) related to the O2−2- -(Y3+, Eu3+) nm (cm−1) f-f transitions of Eu3+
NaY 179.3 (55779) 204.6 (48870) 7F 0
→
5F2,4 7F 0→
5HJ 7F 0→
5D4 7F 0→
7L7,7F0→
5GJ 7F 0→
5L6 7F 0→
5D3 7F 0→
5D2 Splitting (6909) - Barycenter (48596) HWHM: 13300cm−1 LiY 173.9 (57519) 196.5 (50880) Splitting (6639) - Barycenter (53356) HWHM: 13460
cm−1 Li0.5Na0.5Y 176.5 (56671) 205.1 (48747) Splitting (7924) - Barycenter (52363) HWHM: 15500
cm−1 CTB(O2-
–
Y3+) CTB(O2-–
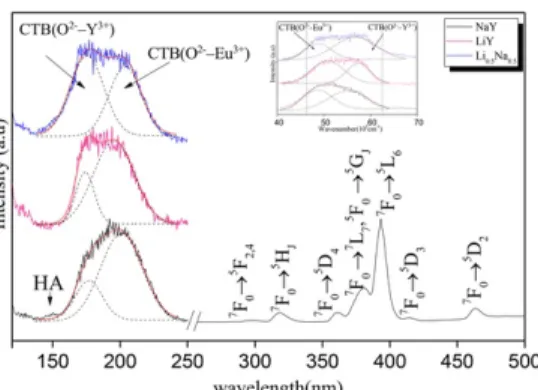
Eu3+) 297 318.5 360.6 380.7 393.6 414.7 463.3These excitation spectra image the relative efficiencies of different wavelength absorptions by the samples and the abilities of energy transfer to the emitting center (Eu3+). Several types of transition are observed in the investigated energy range: (i) intraconfigurational 4f6 transitions of Eu3+; (ii) charge transfer transitions which involve the transfer of an electron from the valence band to Eu3+ (iii) interconfigurational parity-allowed absorption transition 4f6→ 4f55d1 by the Eu3+center; (iv) host related absorptions.
The VUV excitation spectra are dominated by a broad intense band, the shape of which is asymmetric and peaking at around ∼200 nm (50.000 cm−1). In addition, we observe a shoulder which appears around ∼150 nm (66.667 cm−1), notably in the case of NaY(PO
3)4: 10% Eu3+. This shoulder is attributed to the host lattice absorption by the (PO3)4− groups, since several phosphates exhibit intrinsic absorption around 132–186 nm (76.000–54.000 cm−1) [2]. Moreover, the 4f6→ 4f55d1 transition of Eu3+, which is expected to lies at about ∼140 nm as reported for example for LaP
5O14: Eu3+ [14] has been considered that can contribute to these excitation bands and can be overlapped with them. However the intensity of this absorption band is generally weak. The Gauss fitting curves (dot lines on Fig. 4, deconvolution based on the spectra in wavenumber scale as show in the insert of same Fig. 4) of the excitation band located at around ∼ 200 nm (50.000 cm−1) indicate clearly two contributions. The Gauss fitting curves are coincident with the obtained experimental curve, which indicates that the simulative results of the Gauss fitting curves are
Fig. 2 VUV-UV excitation spectra of the Eu3+ in. Li
xNa1- xY(PO3)4 (x = 0; 0.5; 1) and the Gauss fitting curves. The insert represents the fitting of the VUV part of the spectra in wavenumber scale (cm−1).
reliable. The two derived bands lie at around 174 nm for the first one and at 196 nm for the second one. It is well known that the CTB (Charge Transfer Band) is formed by the electron transition from the oxygen 2p states to the outer-shell electron of rare earth ion, and the oxygen 2p states are highly sensitive to the local environment. We can assign the bands at 174–177 and 195–204 nm to the CTB absorption of O2-–Y3+ and the CTB absorption of O2-–Eu3+, respectively. On comparing the position of the CTB of O2--Sm3+ in Li
xNa1-xSm(PO3)4, (∼161 nm) [13]. It could be found that the CTB of Eu3+ is redshifted. This phenomenon demonstrated the electronic transfer capability from O2−2- to RE3+ in RE–O (RE = Eu, Sm).
The UV excitation spectra are composed on narrow bands which are characteristics of electronic absorption transitions of Eu3+ from the ground 7F
0 state to the 5F2,4, 5HJ, 5D4, 5GJ-5L7, 5L6, 5D3 and 5D2 at wavelengths 297 nm, 318 nm, 360 nm, 375–380 nm, 394 nm, 415 nm and 463 nm, respectively [15,16]. These spectra present the same features for the three samples.
According to our attribution as reported in Table 2, it seems that the crystal field is higher in the NaY than in the LiY, since the barycenter of the CTB(O2-–Y3+-Eu3+) is shifted for the NaY to the low energy side with an increase of the splitting's of the VUV bands; results which are estimated from the position of the Gauss deconvolution of the experimental spectra. The Li0.5Na0.5Y exhibits a VUV excitation spectrum, where both main LiY and NaY compositions are mixed. An important information lies in the half-width at half maximum (HWHM), since it's quite similar for LiY and NaY, ∼13.300–13400 cm−1, while this value is around 15.500 cm−1 for Li
0.5Na0.5Y. Such observation indicates clearly that the VUV absorption band is broadened in the case of the alkali mixed sample.
The emission of Eu3+ could be observed whenever the samples were excited by VUV at 196 nm or UV at 394 nm, and the emission lines position of Eu3+ excited under VUV light are consistent with that excited under UV light. The emission lines of Eu3+ are composed of a group of typical 5D
0→7FJ (J = 1, 2, 3, 4) transitions and the main lines are 5D0→7F1 at around 591 nm 5D0→7F2 at around 611 nm and 5D0→7F4 at around 695 nm as shown in Fig. 3. A very weak emission is recorded at around 648 nm and corresponds to the 5D
0→7F3 transition. No emission from higher excited states was detected because of the efficient multiphonon relaxation processes from 5DJ (J = 4-1) states. Particularly, no emission related to the 5D
0→7F0 transition was detected. This means that the Eu3+ ions are embedded in crystallographic environment of which the site symmetry is higher than Cs, Cn or Cnv.
Fig. 3 Emission spectra of LixNa(1-x)Y(PO3)4: 10% Eu3+ (x = 0; 0.5; 1) (excitation at 394 nm, RT).
alt-text: Fig. 3
Fig. 4 High resolution emission spectra of the 5D
In Fig. 4, we have reported the zoom related to the two transitions of interest 5D
0→7F1 and 5D0→7F2. For the three samples, its appears clearly that for the main two principal samples that the 5D0→7F1 transition consist of two Stark components for LiY(PO3)4: Eu3+ and three Stark components for NaY(PO3)4:Eu3+. For the Li0.5Na0.5(PO3)4: Eu3+compound, four Stark components are observed for the 5D0→7F1 transition. This confirm that this compound is a mixture of both stoichiometric NaY(PO3)4: Eu3+ and LiY(PO3)4: Eu3+ compounds.
We can state then the local symmetries of Eu3+ checked by luminescence spectroscopy diverge from the theoretical analysis derived from XRD analysis.
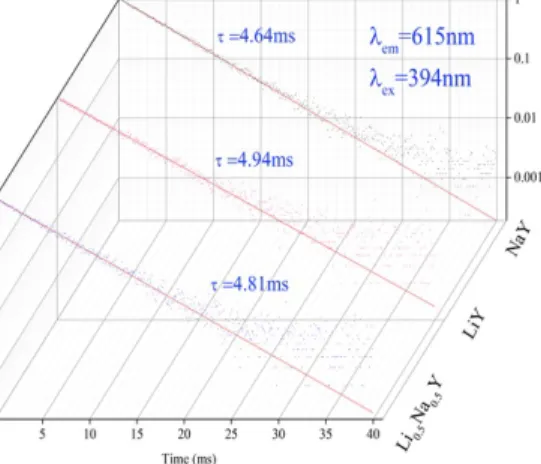
Fig. 5 reports the room temperature luminescence decays of LixNa1-xY(PO3)4: 10% Eu3+ phosphors recorded under excitation in the 5L6 level (at 394 nm) of Eu3+, monitoring either the 5D0→7F1 or 5D0→7F2 transitions. All the decays are purely exponential and are independent of the monitored emission. The derived time constants from the fits are of 4.64 ms, 4.94 ms and 4.81 ms for NaY(PO3)4: 10%Eu3+, LiY(PO3)4: 10%Eu3+ and Li0.5Na0.5Y(PO3)4: 10 %Eu3+ respectively. The time constants values found for the three samples are higher than that found for Eu3+ doped KLa(PO
3)4 [17] where the reported time constants are around 3.5 ms over Eu3+ doping range from 2 to 30% mol.
4.3 Eu
3+local environment and Judd–Ofelt analysis
It is well known that Eu3+ ions substitute Y3+ ions sites and this substitution almost does not affect the local environment. The intensity of the 5D
0→7F2 transition is extremely sensitive to chemical bonds in the vicinity of Eu3+, and increases with the decreasing of the site symmetry of Eu3+ center. On the other hand, the intensity of the 5D
0→7F1 transition is independent of the surroundings of Eu3+. Therefore, the asymmetry ratio (R) is widely used as a criterion of the coordination state and the site symmetry for the RE ions. Higher the value of R, lower the symmetry around the Eu3+ ions and higher the Eu–O covalence, and vice versa [18,19]. The obtained values are close to that found comparing to Eu3+ in LiLaEu(PO
3)4 (0.992) [20].
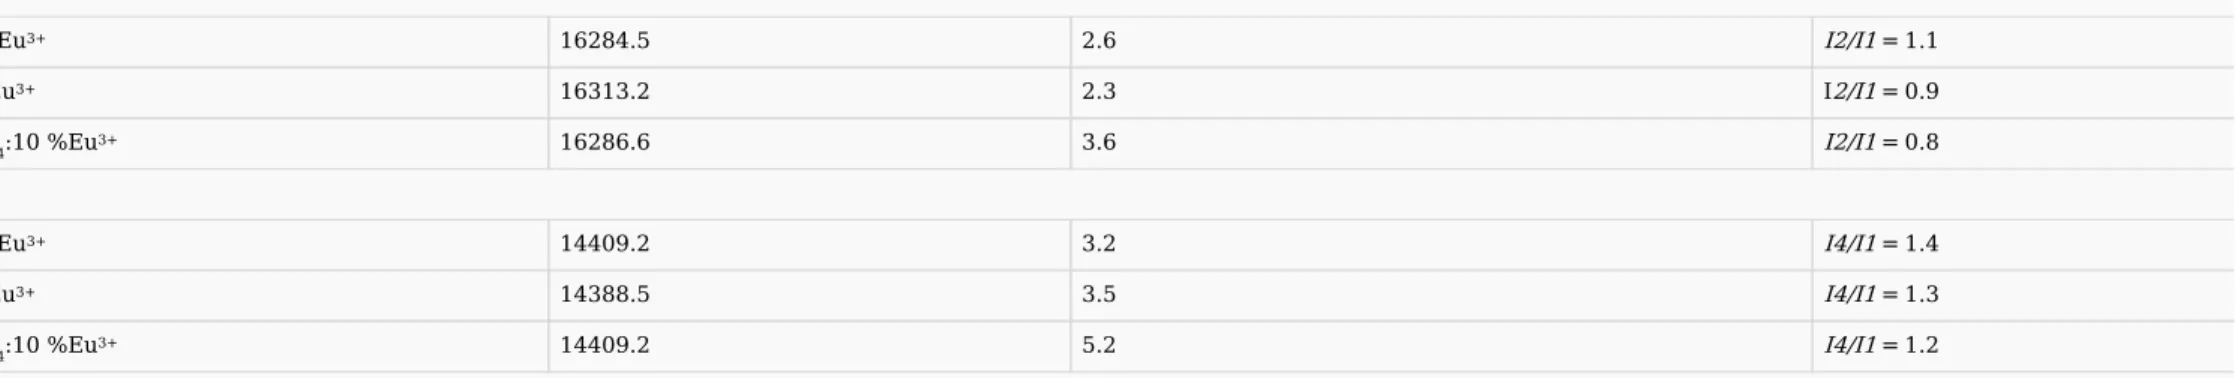
The integrated emission intensities and the intensity ratios were derived and listed in Table 3.
Table 3 Integrated emission intensities and intensity ratios in LixNa(1-x)Y(PO3)4: 10% Eu3+(x
=
0; 0.5; 1) compounds (The notation In/I1 refers to the intensity ratios 5D0
→
7Fn/5D0→
7F1 where n=
2, 4). alt-text: Table 3
Item Barycenter (cm−1) Integrating intensity (a.u.) Intensity ratio
5D
0
→
7F1 (I1)NaY(PO3)4:10%Eu3+ 16879.3 2.4
LiY(PO3)4:10%Eu3+ 16920.5 2.6
alt-text: Fig. 4
Fig. 5 Decays curves of LixNa(1-x)Y(PO3)4: 10% Eu3+ (x = 0; 0.5; 1) (λexc = 394 nm, λem = 615 nm).
Li0.5Na0.5Y(PO3)4:10 %Eu3+ 16949.2 4.5 5D
0
→
7F2 (I2)NaY(PO3)4:10%Eu3+ 16284.5 2.6 I2/I1 =
1.1
LiY(PO3)4:10%Eu3+ 16313.2 2.3 I2/I1 =
0.9
Li0.5Na0.5Y(PO3)4:10 %Eu3+ 16286.6 3.6 I2/I1 =
0.8
5D
0
→
7F4 (I4)NaY(PO3)4:10%Eu3+ 14409.2 3.2 I4/I1 =
1.4
LiY(PO3)4:10%Eu3+ 14388.5 3.5 I4/I1 =
1.3
Li0.5Na0.5Y(PO3)4:10 %Eu3+ 14409.2 5.2 I4/I1 =
1.2
Judd-Ofelt (J–O) [21,22] intensity parameters are essential indicators in judging radiative potential of RE ions in different hosts, which are usually derived from absorption spectrum. Effective absorption measurement is very difficult for powdered phosphors. However, owing to the special energy level structure of Eu3+, as stated above, they can be calculated from the emission spectra.
The hypersensitive ratio R and J-O Ω2 parameter reveal quite similar physical significance of the symmetric/asymmetric and covalent/ionic bonding nature between Eu3+ ions and the surrounding ligands. Ω2 is very sensitive to the environment in which Eu3+ ions exist. Therefore, the maximum value of Ω
2 can be related to changes in the structural environment around the Eu3+ ion because of the hypersensitivity of the 5D0→7F2 transition. The larger Ω2 parameter is a good indication that the symmetry of the Eu3+ sites is distorted [23]. On the other hand, Ω
4 is related to the rigidity and stability of the matrix in which the rare earth ions are situated [24,25]. The J-O concepts and steps for the calculation of the λ parameters have been reported in several papers and don't need to be repeated [24,25]. For this raison, we shorten this presentation by retaining only two equations, since they are connected on the nature of the material.
The transitions of Eu3+ from 5D
0 to 7FJ (J = 2–4) are electronic-dipole allowed and the spontaneous emission probability A from initial manifold J to terminal manifold J is given using the following expression.
The factor takes into account that the europium ion is not in a vacuum, but in a dielectric medium where n is refractive index of the medium (n = 1.63) [26].
υ is the average transition energy (in cm−1), h is the Planck constant (6.63*1027 erg s) and (2J + 1) is the degeneracy of the initial state. D
ED and DMD are the electric and magnetic dipole strengths. The strength of all induced dipole transitions can be calculated on basis of only three phenomenological J–O parameters using the following equation:
where e is the elementary charge, and is the squared reduced matrix element of unit tensor operator which are independent of the chemical environment of the ion. For the case of Eu3+ these values are given in Table 4 [21,22]. Table 4 Squared reduced matrix elements used for the calculation of dipole strengths of the allowed induced ED transitions in the emission spectra of Eu3+, taken from Ref. [27]. alt-text: Table 4 5D 0
→
7F 2 0.0032 0 0 7F 4 0 0.0023 0 Ω (1) (2) |áΨJ||U(λ)||ΨJ'ñ|2 |áΨJ||U(2)||ΨJ'ñ|2 |áΨJ||U(4)||ΨJ'ñ|27F
6 0 0 0.0002
The J
–
O intensity parameters, for 5D0→
7FJ transitions are presented in Table 5.Table 5
Ω
2,4 Judd–
Ofelt intensity parameters calculated from the emission spectra data of (Li,Na)Y(PO3)4: 10% Eu3+. alt-text: Table 5Ω
2 (10−20cm2)Ω
4 (10−20cm2) NaY(PO3)4: 10 %Eu3+ 1.1 2.7 LiY(PO3)4: 10 %Eu3+ 0.9 2. 9 The values of the branching ratios and the radiative life times for the 5D0 level calculated are given in Table 6. Table 6 Calculated branching ratios and radiative lifetimes of LixNa(1-x) Y(PO3)4: 10% Eu3+ (x=
0; 1). alt-text: Table 6
β
(0→
1)β
(0→
2)β
(0→
3)β
(0→
4) NaY(PO3)4: 10 %Eu3+ 0.29 0.32 0.005 0.39 6.5 LiY(PO3)4: 10%Eu3+ 0.31 0.28 0.007 0.41 6.8 The obtained values for the branching ratios are very indicative and close to relative intensities between the main emission transitions connecting the first excited state 5D0 to the manifolds 7FJ (J = 1–4) as observed in Fig. 3. The estimated value of τr is also close to that derived from J-O theory for KLa(PO3)4: Eu3+ for which is around 5.5 ms [22].
5 Conclusion
In the present work, the (Li,Na)Y(PO3)4: Eu3+ polyphosphates were synthesized by a conventional high temperature solid state method in the aim to check the effect of the alkaline ion on the structural and optical properties. For this purpose VUV-UV PL and PLE spectra were achieved. The VUV-excited PL spectra revealed that both CT of Y3+-O2- and Eu3+-O2- act as the effective media in energy transfer in the VUV in comparison with the host absorption band. The VUV absorption band is broadened more than 10% in the mixed 0.5Li/0.5Na comparatively to the extremes Li and Na polyphosphates. The recorded emission spectra agree well with a lowering of the rare earth local symmetry from the LiY(PO3)4: Eu3+ to the NaY(PO3)4: Eu3+ as evidenced by numbering the Stark components of the 5D0 → 7F1,2 transitions. Despite that, the luminescence decays relative to radiative emission from the 5D0 level of Eu3+ remains quite constant and so high in comparison with the measured values in other cyclo or polyphosphates activated by Eu3+.
Prime novelty statement
The paper reports on some new insights on the VUV spectroscopy of alkaline mixed polyphosphates prepared by conventional solid state reaction, activated by Eu3+.The broad bands near 200 nm in VUV excitation spectra are attributed to both contribution of overlapped O2- -Y3+ and O2- -Eu3+ absorption charge transfer states while the host absorption band is estimated at 150 nm. The VUV absorption band is broadened in the mixed sample. The recorded emission spectra disagree with the structural description We confirm that this manuscript has not been published elsewhere and is not under consideration in another journal. All the authors have approved the manuscript and agree with its submission to OM-VSI-ICOM2018.
References
[1] B. Moine, J. Mugnier, D. Boyer, R. Mahiou, S. Schamm and G. Zanchi, VUV absorption coefficient measurements of borate matrices, J. Alloy. Comp. 323–324, 2001, 816–819. [2] D. Wang, Y. Wang and Y. Shi, Photoluminescence properties of Eu3+ in Y (PO 3)3 under VUV excitation, J. Lumin. 131, 2011, 1154–1157. [3] D. Levy, R. Reisfeld and D. Avnir, Fluorescence of europium (III) trapped in silica gel-glass as a probe for cation binding and for changes in cage symmetry during gel dehydration, Chem. Phys. Lett. 109, 1984, τr(ms)593–597.
[4] J. Rodrı́guez-Carvajal, An Introduction to the Program Fullprof, 2000.
[5] H.M. Rietveld, A profile refinement method for nuclear and magnetic structures, J. Appl. Crystallogr. 2, 1969, 65–71.
[6] M. Bagieu-Beucher and J.-C. Guitel, Crystal structure of the yttrium-ammonium polyphosphate YNH4(PO3)4, Z. Anorg. Allg. Chem. 559, 1988, 123–130.
[7] K. Jaouadi, H. Naili, N. Zouari, T. Mhiri and A. Daoud, Synthesis and crystal structure of a new form of potassium--bismuth polyphosphate KBi(PO3)4, J. Alloy. Comp. 354, 2003, 104–114. [8] H.Y.-P. Hong, Crystal structure of NdLiP4O12, Mater. Res. Bull. 10, 1975, 635–640. [9] H. Koizumi, Sodium neodymium metaphosphate NaNdP4O12, Acta Crystallogr. B 32, 1976, 2254–2256. [10] D. Zhao, H. Zhang, S.P. Huang, M. Fang, W.L. Zhang, S.L. Yang and W.D. Cheng, Syntheses, crystal structures, and characterizations of LiM(PO3)4 (M = Y, Dy), J. Mol. Struct. 892, 2008, 8–12. [11] M. El Masloumi, V. Jubera, S. Pechev, J.P. Chaminade, J.J. Videau, M. Mesnaoui, M. Maazaz and B. Moine, Structure and luminescence properties of silver-doped NaY(PO3)4 crystal, J. Solid State Chem. 181, 2008, 3078–3085. [12] J. Zhu, W.D. Cheng, D.S. Wu, H. Zhang, Y.J. Gong and H.H. Tong, Structure, energy band, and optical properties of NaLa(PO3)4 crystal, J. Solid State Chem. 179, 2006, 597–604.
[13] S. Sebai, S. Hammami, A. Megriche, D. Zambon and R. Mahiou, Synthesis, structural characterization and VUV excited luminescence properties of LixNa(1−x)Sm(PO3)4 polyphosphates, Opt. Mater. 62, 2016, 578–583.
[14] S. Hachani, B. Moine, A. El-akrmi and M. Férid, Luminescent properties of some ortho-and pentaphosphates doped with Gd3+-Eu3+: potential phosphors for vacuum ultraviolet excitation, Opt. Mater. 31, 2009, 678–684.
[15] Y. Xia, Y.H. Huang, Q.W. Long, S. Liao, Y. Gao, J.Q. Liang and J.J. Cai, Near-UV light excited Eu3+, Tb3+, Bi3+ co-doped LaPO
4 phosphors: synthesis and enhancement of red emission for WLEDs, Ceram. Int. 41, 2015, 5525–5530. [16] Y. Kumar, M. Pal, M. Herrera and X. Mathew, Effect of Eu ion incorporation on the emission behavior of Y2O3 nanophosphors: a detailed study of structural and optical properties, Opt. Mater. 60, 2016, 159–168. [17] M. Ferhi, C. Bouzidi, K. Horchani-Naifer, H. Elhouichet and M. Ferid, Judd-Ofelt analysis of spectroscopic properties of Eu3+ doped KLa(PO 3)4, J. Lumin. 157, 2015, 21–27. [18] K. Binnemans, K. Van Herck and C. Görller-Walrand, Influence of dipicolinate ligands on the spectroscopic properties of europium (III) in solution, Chem. Phys. Lett. 266, 1997, 297–302. [19] R. Reisfeld, E. Zigansky and M. Gaft, Europium probe for estimation of site symmetry in glass films, glasses and crystals, Mol. Phys. 102, 2004, 1319–1330.
[20] M. Ferhi, C. Bouzidi, K. Horchani-Naifer, H. Elhouichet and M. Ferid, Judd–Ofelt analysis and radiative properties of LiLa(1−x)Eux(PO3)4, Opt. Mater. 37, 2014, 607–613.
[21] B.R. Judd, Optical absorption intensities of rare-earth ions, Phys. Rev. 127, 1962, 750–761. [22] G.S. Ofelt, Intensities of crystal spectra of rare-earth ions, J. Chem. Phys. 37, 1962, 511–520. [23] K. Binnemans, Interpretation of europium (III) spectra, Coord. Chem. Rev. 295, 2015, 1–45.
[24] C. Görller-Walrand and K. Binnemans, Spectral Intensities of ff Transitions, Handbook on the Physics and Chemistry of Rare Earths vol 25, 1998, Elsevier, 101–264.
[25] G. Anjaiah, S.K. Nayab Rasool and P. Kistaiah, Spectroscopic and visible luminescence properties of rare earth ions in lead fluoroborate glasses, J. Lumin. 159, 2015, 110–118. [26] J. Nakano, Thermal properties of a solid-state laser crystal LiNdP4O12, J. Appl. Phys. 52, 1981, 1239–1242.
[27] W.T. Carnall, H. Crosswhite and H.M. Crosswhite, Energy Level Structure and Transition Probabilities in the Spectra of the Trivalent Lanthanides in LaF3, 1977, Report Argonne National Laboratory, Chemistry Division; Argonne IL.
Queries and Answers
Query: Please confirm that the provided email “Rachid.Mahiou@uca.fr” is the correct address for official communication, else provide an alternate e-mail address to replace the existing one, because private e-mail addresses should not be used in articles as the address for communication. Answer: OK Query: Please check the layout of Table(s) 1, 2, and correct if necessary. Answer: OK Query: Correctly acknowledging the primary funders and grant IDs of your research is important to ensure compliance with funder policies. We could not find any acknowledgement of funding sources in your text. Is this correct? Answer: Yes Query: Please confirm that given names and surnames have been identified correctly and are presented in the desired order and please carefully verify the spelling of all authors’ names. Answer: Yes Query: Your article is registered as belonging to the Special Issue/Collection entitled “ ICOM2018”. If this is NOT correct and your article is a regular item or belongs to a different Special Issue please Highlights • The solid state reaction was used to obtain Li(x)Na(1-x)(Y,Eu) (PO3)4 (x = 0; 0.25; 0.5; 0.75; 1). • XRD confirmed formation of the proper phases for x = 0 and 0.25 in one side and for x = 0.75 and 1 in other side. • For x = 0.5, the compound is bi-phasic. • The VUV excited luminescence is analyzed. The VUV band is broadened for the mixed phase. • The emission spectra disagree with the structural description. Graphical abstract alt-text: Image 1contact s.nataraj@elsevier.com immediately prior to returning your corrections. Answer: Yes