HAL Id: hal-01654827
https://hal.archives-ouvertes.fr/hal-01654827
Submitted on 6 Nov 2020
HAL is a multi-disciplinary open access archive for the deposit and dissemination of sci-entific research documents, whether they are pub-lished or not. The documents may come from teaching and research institutions in France or abroad, or from public or private research centers.
L’archive ouverte pluridisciplinaire HAL, est destinée au dépôt et à la diffusion de documents scientifiques de niveau recherche, publiés ou non, émanant des établissements d’enseignement et de recherche français ou étrangers, des laboratoires publics ou privés.
High-Flow-Rate Impinger for the Study of
Concentration, Viability, Metabolic Activity, and
Ice-Nucleation Activity of Airborne Bacteria
Tina Šantl-Temkiv, Pierre Amato, Ulrich Gosewinkel, Runar Thyrhaug, Anaïs
Charton, Benjamin Chicot, Kai Finster, Gunnar Bratbak, Jakob Löndahl
To cite this version:
Tina Šantl-Temkiv, Pierre Amato, Ulrich Gosewinkel, Runar Thyrhaug, Anaïs Charton, et al.. High-Flow-Rate Impinger for the Study of Concentration, Viability, Metabolic Activity, and Ice-Nucleation Activity of Airborne Bacteria. Environmental Science and Technology, American Chemical Society, 2017, 51 (19), pp.11224 - 11234. �10.1021/acs.est.7b01480�. �hal-01654827�
A high-flow-rate impinger for the study of concentration, viability, metabolic
1activity, and ice nucleation activity of airborne bacteria
23
Tina Šantl-Temkiv1,2,3*, Pierre Amato4, Ulrich Gosewinkel5*, Runar Thyrhaug6Ω, Anaïs 4
Charton4, Benjamin Chicot4, Kai Finster2,3, Gunnar Bratbak6, and Jakob Löndahl1 5
6
1 Lund University, Department of Design Sciences, Ergonomics and Aerosol Technology, P.O. box 118, SE-22100
7
Lund, Sweden
8
2 Aarhus University, Stellar Astrophysics Centre, Department of Physics and Astronomy, Ny Munkegade 120,
DK-9
8000 Aarhus, Denmark
10
3 Aarhus University, Department of Bioscience, Microbiology Section, Ny Munkegade 116, DK-8000 Aarhus,
11
Denmark
12
4 Université Clermont Auvergne, CNRS, Institut de Chimie de Ferrand, BP 10448, F-63000
Clermont-13
Ferrand, France.
14
5 Aarhus University, Department of Environmental Science, Frederiksborgvej 399, DK-4000 Roskilde, Denmark
15
6 University of Bergen, Dept. of Biology, Thormøhlensgt. 53 A/B, PO box 7803, N-5020 Bergen, Norway.
16 17
* Correspondence to: U Gosewinkel: Ulrich.Gosewinkel@envs.au.dk, tel: +45 871 58617; T 18
Šantl-Temkiv: temkiv@phys.au.dk, tel: + 45 871 68464 19
20
Ω We dedicate this paper to our colleague Runar Thyrhaug, who initiated the study, but sadly 21
passed away during its initial phase. 22
Abstract
23 24
The study of airborne bacteria relies on a sampling strategy that preserves their integrity and in 25
situ physiological state, e.g. viability, cultivability, metabolic activity, and ice-nucleation activity.
26
As ambient air harbours low concentrations of bacteria, an effective bioaerosol sampler should 27
have a high sampling efficiency and a high airflow. We characterize a high-flow-rate impinger 28
with respect to particle collection and retention efficiencies in the range 0.5- 3.0 µm, and we 29
investigated its ability to preserve the physiological state of selected bacterial species and 30
seawater bacterial community in comparison with 4 commercial bioaerosol samplers. The 31
collection efficiency increased with particle size and the cut-off diameter was between 0.5 and 1 32
µm. During sampling periods of 120-300 min, the impinger retained cultivability, metabolic 33
activity, viability, and ice-nucleation activity of investigated bacteria. Field studies in semi-urban, 34
high-altitude, and polar environments included periods of low bacterial air-concentrations thus 35
demonstrating the benefits of the impinger’s high flow rate. In conclusion, the impinger 36
described here has many advantages compared with other bioaerosol samplers currently on the 37
market: a potential for long sampling time, a high flow rate, a high sampling and retention 38
efficiency, low costs, and applicability for diverse downstream microbiological and molecular 39
analyses. 40
1.
Introduction
42Knowledge on the activity and abundance of primary biological aerosol particles (PBAP) is 43
important for a variety of fields and applications, including atmospheric chemistry and physics, 44
biogeography, meteorology, hospital hygiene, epidemiology as well as industry that is sensitive 45
to contamination, such as pharmaceutics or food processing. For the assessment of PBAP, a 46
sampling strategy is needed that preserves the integrity and in situ state of these particles. 47
Airborne bacteria are a particularly important group of PBAP. (i) They are potential human, 48
animal and plant pathogens1. (ii) Airborne bacteria that maintain their metabolic activity can 49
affect atmospheric chemical processes, in particular radical chemistry2, carbon3–5 and nitrogen6 50
cycles. (iii) Some bacterial species, such as Pseudomonas syringae, can be involved in cloud 51
formation, thus influencing patterns of precipitation, meteorology and climate7–11 due to 52
physiological properties like ice-nucleation activity12 and biosurfactant production13. 53
54
Atmospheric concentrations of bacteria are much lower than in many other environments, 55
including deep marine and terrestrial subsurfaces14. It has been observed that there are on average 56
between 5 and 350 cells found per L of air over terrestrial and marine surfaces15. These low 57
bacterial concentrations imply sampling at high air flow rates (on the order of 100 L/min or 58
higher), and/or for prolonged duration (on the order of hours or days) in order to obtain sufficient 59
biomass for downstream analyses. Nevertheless, excessively long sampling time may deteriorate 60
the physiological state of sampled bacterial cells16, and prevent the assessment of short-term 61
variability17. Consequently, bioaerosol sampling requires efficient particle collection at high flow 62
rate, while preserving biological properties of interest, such as cell integrity and metabolic 63
activity. 64
A number of samplers are available on the market for collection of bacteria on filters, on agar, or 66
into liquid18. Filter samplers typically capture most of the biological material with a high 67
efficiency and can be adapted for the use at high flows19. However, cell properties are largely 68
affected by desiccation and other stresses over prolonged sampling time by air filtration20. 69
Alternatives include the collection of microorganisms directly on nutrient plates for cultivation-70
dependent studies21–23. However, aside from being biased towards the cultivable fraction of the 71
collected cells, this method impedes downstream community analysis using state-of-the-art 72
molecular approaches and single-cell analyses. Living biological material is therefore often 73
preferably sampled into a liquid (i.e. by impingement), which more efficiently preserves cell 74
viability and allows fixation of cellular biological properties in real-time20,24,25. 75
76
Among the most common devices for sampling into liquid, both the all-glass impinger (AGI-30) 77
and the SKC BioSampler use airflows of 12.5 L/min24. There are also devices for sampling at 78
higher flow rates, such as the XMX-CV that collects particles in the 1-10 µm range at a flow rate 79
of 530 L/min. However, due to evaporation of the sampling liquid, the total sampling duration 80
cannot exceed 10 min according to user’s manual. Hence, the current impingers appear poorly 81
adapted to sampling airborne microorganisms in environments where their concentration is 82
lowest, like at high altitude and in remote areas. 83
84
The objective of this study was to evaluate the use of a commercially available vacuum cleaner, 85
which collects aerosols into a liquid, as a high-flow-rate impinger. We hypothesize that: (i) The 86
performance of this impinger in terms of sampling and retention efficiency is comparable to 87
currently available impingers for bio-aerosol sampling; (ii) The high-flow rate of the impinger 88
allows it to be used in diverse environments, including pristine environments with low bacterial 89
loads; (iii) The impinger preserves bacterial cultivability, viability, metabolic activity, and ice-90
nucleation activity; and (iv) The samples collected by the impinger are suitable for downstream 91
analyses. 92
93
2.
Materials and Methods
9495
2.1 Description of the impinger and tests performed 96
97
The characterized high-flow-rate impinger is a new application of a water based commercial 98
vacuum cleaner by Kärcher (Alfred Kärcher GmbH & Co. KG, Germany, SI-Figure 1). Air 99
samples were collected using the two models, DS5600, and its more recent version DS5800. The 100
Kärcher impinger consists of an outer part that generates the suction, and an inner part, the 101
“vortex chamber”26 that contains the sampling liquid. The air flow within the vortex chamber of 102
the Kärcher DS5600/DS5800 is illustrated in Figure 1. Both models operate by the same 103
principle, but the DS5800 has been slightly modified by the manufacturer, reducing the size of 104
the vortex chamber to facilitate higher airflow. The Kärcher impinger works as a high-flow-rate 105
aerosol collector: the air enters the vortex chamber and swirls through the sampling liquid, which 106
thereby captures the airborne particles and water-soluble gases. The sampling liquid is added by 107
lifting the lid of the vortex chamber. The air flow through the vortex chamber was measured 108
using a wind speed meter with a rotating vane sensor (Kimo LVB, Marne-la-Vallee, France) 109
connected to the inlet pipe. For measuring the flow, the impinger was run in the same way as 110
when collecting samples. The effect of different collecting liquids was evaluated, but did not 111
have a large impact on the flow (data not presented). The flow was kept at (0.8-0.9)×103 L/min 112
during sampling when powered by generators in the field and at 3.1×10³ L/min when connected 113
to the electrical circuit, which was close to the values provided by the manufacturer (3.3×10³ 114
L/min). For the model DS5800, the airflow rate specified by the manufacturer (4.1×10³ L/min) 115
was adopted, as it was run connected to the electrical circuit. 116
117
The samplers were validated using: (i) sampling efficiency laboratory tests, (ii) retention 118
efficiency laboratory tests, and (iii) validation field tests. An overview of all experiments is 119
presented in Table 1. Field tests were performed in Norway, France, and Greenland. In two of the 120
tests commercially available bioaerosol samplers were used as references. 121
122
2.2. Cleaning and sterilizing the impinger 123
124
Samplers and sampling liquids were decontaminated prior to each assay by applying sterilization 125
and rinsing procedures depending on the application (Table 1). E.g. a simple rinsing (Milli-Q 126
H2O rinse) was required when using microspheres for determining sampling efficiency, a mild 127
sterilization (consecutive Ethanol and Milli-Q H2O rinses) was required when examining 128
retention and preservation efficiency with model bacteria, and a stronger sterilization procedure 129
was required when collecting environmental samples (consecutives rinses with either HCl / 130
sterile Milli-Q H2O / 96% Ethanol or 10% HNO3 / deionized H2O / bleach / deionized sterile 131
H2O). The different sterilization liquids were either applied manually or by running the impinger 132
for 5 min having the vortex chamber filled with the respective liquid. The filter that protects the 133
motor (filter in Figure 1) was rinsed with the same sterilization liquids and replaced to its original 134
position. When transported into the field, the containers were kept enclosed in sterile plastic bags 135
and opened just before use. All sampling solutions were autoclaved (1-3 times) and then filtered 136
(0.22 μm or 0.1 μm porosity) to remove particles. Sterility and absence of particulate 137
contaminants were verified by collecting control samples at the start of each sampling event. For 138
negative controls, the impinger was run for 5 min with the sampling solution, so that the liquid 139
came into contact with the entire container. An aliquot of the sampling solution was then 140
withdrawn from the chamber and analysed in parallel to the samples. In most cases the negative 141
control was produced under sterile conditions, with the exception of samples collected in 142
Greenland, where the negative control was taken in the field. For the latter negative controls, we 143
present the values in SI-Figure 9A. 144
145
2.3 Experimental evaluation of the impinger 146
147
2.3.1. Collection efficiency using an aerosol chamber 148
149
The collection efficiency of the samplers was evaluated with monodisperse fluorescent 150
polystyrene microspheres (Corpuscular Inc., Thermo Fisher Scientific Inc.) of different diameters 151
(500 nm, 790 nm, 1000 nm, 1400 nm, 2000 nm, and 3000nm) (Figure 1). The microspheres were 152
sprayed into an aerosol mixing chamber made of galvanized steel (diameter 0.5 m, volume 0.2 153
m3) and sampled with the impinger. Fluorescent microspheres were mixed by shaking and a brief 154
ultrasonication (~5 s) in an ultrasonic bath. Thereafter, the microspheres were diluted in Milli-Q 155
(MQ) water to a final concentration of 1.3×10⁷–1.8×10⁸ beads mL-1. The microsphere suspension 156
was fed into a sparging liquid aerosol generator at 60 mL h-1 (SLAG, CH Technologies, Inc), 157
which creates a relatively high particle number concentration at an airflow of 12 L/min of 158
aerosols that is stable over time27. A high dilution, 3100 L/min, was needed in order to achieve 159
sufficient flow rates for the impinger. The collection efficiency was determined by measuring 160
particle concentration in the air and in the impinger liquid. The particle concentration in the 161
aerosol chamber was kept at the same order of magnitude as atmospheric concentrations of 162
bacteria (SI-Figure 2): 270±2 L-1 for 500 nm microspheres (average ± standard error of the 163
mean), 41±2 L-1 for 790 nm microspheres, 198±4 L-1 for 1000 nm microspheres, 46±1 L-1 for 164
1400 nm microspheres, 84±2 L-1 for 2000 nm microspheres, and 32±1 L-1 for 3000 nm 165
microspheres. The concentration was measured at one-minute time resolution and typically 166
varied by ±30% over time with periods of low concentration when the microsphere solution was 167
refilled. 168
169
Aerosolized fluorescent microspheres were collected from the aerosol chamber using impinger 170
model DS5600 for either 1 h or 5 hrs. Three 1.5 mL MQ water aliquots were taken as negative 171
controls before pouring the MQ water into the vortex chamber, and from the vortex chamber after 172
collecting clean air within the aerosol chamber for 5 min. During the 1 h tests, triplicate 1.5 mL 173
sub-samples were removed from sampling liquid every 10 min, and during the 5 h tests 1.5 mL 174
sub-samples were withdrawn after 5, 30, 60, 90, 120, 180, 240, and 300 min. Both negative 175
controls and samples were kept in the dark at 4°C before they were analysed by flow cytometry 176
(FC). 177
178
A scanning mobility particle sizer SMPS (10-900 nm particles, design: Lund University) and an 179
aerodynamic particle sizer (0.5-20 µm particles, APS, model 3321, TSI Inc., US) were used to 180
obtain the aerosol number concentrations aloft in the chamber. Usually, microspheres appeared as 181
monodisperse particle number concentration peaks, which were integrated to determine airborne 182
concentrations. These were used to infer the theoretical numbers of microspheres sampled by the 183
impinger and to calculate size-resolved particle collection efficiencies by comparison with the 184
concentration derived from FC counts in the sampling liquid (cFCM) as: Eff [%] = (cFC / (cAPS 185 +cSMPS)) · 100. 186 187 188
2.3.2 Retention efficiency of the Kärcher impinger and of four bioaerosol impingers 189
190
The retention efficiency for the Kärcher impingers DS5600, DS5800 and four commercially 191
available bioaerosol impingers were assessed in either laboratory or field tests (Supporting 192
Information, SI, Section SI-1.1). The sampling liquid was spiked with an ice nucleation active 193
(INA) Pseudomonas syringae 32b-74 (GenBank A.N. HQ256872)28, Pantoea agglomerans 194
(ATCC 33243), Bacillus atrophaeus (ATCC 9372), or seawater bacterial community that was 195
collected in a sterile container just before the experiments. The retention efficiency was assessed 196
by running the impingers for 2-5 hrs. The ability of the Kärcher DS5600 impinger to maintain 197
cell integrity was compared to four commercially available impingers (XMX-CV, SKC 198
BioSampler, SASS 2000PLUS, and SpinCon) in field tests, and the retention efficiency of 199
Kärcher DS5800 was texted in a laminar flow hood. The samples were assessed by FC for total 200
(Sybr Green I staining) and viable cell (Live/Dead staining) concentrations, colony forming units 201
(CFU) on R2A nutrient plates, protein synthesis activity measurements using tritium-labelled 202
leucine29, and ice nucleation activity (droplet-freezing assays) (Table 1, Supporting Information, 203
SI, Section SI-1.3). 204
205
2.4 Bioaerosol collection in ambient air 206
Bioaerosol sampling in ambient outdoor air was performed using Kärcher DS5800 impinger at 2 208
locations: from the roof of a building at the Clermont-Auvergne University campus “Les 209
Cézeaux” (45.76111 N, 3.116667 E), at ~4 m above the ground, and from the roof platform of the 210
atmospheric observatory of the Puy de Dôme mountain, nearby the city of Clermont-Ferrand 211
(45.77222 N, 2.96583 E, 1465 m asl) (Table 1). Sampling was performed for 3 to 12 consecutive 212
hours, with subsamples of the sampling liquid (sterile NaCl 0.9% solution) taken every hour in a 213
laminar flow hood. Before subsampling, evaporation losses were determined by weighing and 214
corrected by addition of sterile fresh sampling liquid or deionized water. For all calculations, we 215
assumed 100% sampling efficiency and no significant cell loss from the sampling liquid (based 216
on the laboratory test: see Figures 2A and 4A). 217
218
Three air samples were collected in duplicates in southwest Greenland from the M500 peak (500 219
m above sea level, 64.12264 N, 51.36619 W) at the Nuuk Basic research station (Table 1). The 220
Kärcher impinger was powered by generators, thus the air flow was kept at (0.8-0.9)×103 L/min 221
during the sampling period of 5 hrs, which resulted in the collection of aerosols from (1.30– 222
1.45)×105 L of air. The samples were collected into a high-salt solution, which is designed for 223
real-time preservation of sensitive RNA molecules30. Duplicate samples were collected using two 224
Kärcher impingers DS5600 in order to evaluate sampling reproducibility. The samples and the 225
negative controls where concentrated onto SterivexTM filter units, and stored in presence of 1 226
mL of RNA later (Thermo Fisher Scientific Inc, Massachusetts) as described by Lever et al30. 227
The sampling solution was autoclaved twice and filter sterilized (0.1 μm, VacuCap 90 Devices, 228
Pall Corporation, New York). During sampling, evaporated water was replaced with sterile MQ 229
water. 230
3.
Results and discussion
232233
3.1 Sampling efficiency at different particle sizes 234
235
236
Figure 1: (Left) Model of the airflow in the Kärcher DS5800 impinger. Aerosol enters by the inlet (on the left), 237
impacts and rotates through the liquid at the bottom, and leaves through an outlet on the top. Filter has the function
238
of sealing the vortex chamber and protecting the motor of the vacuum. (Right) Schematic of the experimental setup
239
deployed for sampling efficiency tests. SLAG stands for Sparging Liquid Aerosol Generator, APS for Aerodynamic
240
Particle Sizer, and SMPS for Scanning Mobility Particle Sizer.
241 242
The collection efficiency and cut-off diameters of the sampler were assessed by sampling 243
microspheres of defined size and known concentration from an aerosol chamber. The collection 244
efficiency (Figure 2A) increased with increasing microsphere diameter, with 25±5% for 500 nm 245
microspheres and 69±17%–199±28% for larger particles. Based on these experiments we 246
estimated a cut-off diameter of between 0.5 and 1 µm. Efficiencies higher than 100 % are likely 247
due to microsphere doublets causing the APS to underestimate their actual number concentration 248
in air. Thus, there may be an overall overestimate of sampling efficiency. There is an additional 249
uncertainty from particle losses at the sampling inlets and heterogenous particle mixing, as 250
laminar homogenous isokinetic sampling was not possible to achieve at these high flow rates. 251
252
There was no saturation with microspheres in the sampling liquid over a sampling period of 5 253
hours at microsphere air concentrations comparable to high bacterial concentrations in ambient 254
air (~100 L-1). Figure 2B confirms that the concentrations of microspheres with a diameter of 500 255
nm and 1400 nm in the sampling liquid increased linearly with sampling time (1400 nm: 256
R2=0.97, p < 0.001, 500 nm: R2= 0.97, p < 0.001). 257
258
Collecting subsamples of the sampling liquid at dedicated times allowed us to follow the particle 259
number concentration in air at various time resolutions, which were higher than achievable with 260
most bioaerosol samplers (Figure 2D). The concentrations measured in the collection liquid of 261
the impinger reflected the airborne particle number concentrations measured with the APS, 262
within an order of magnitude (Figure 2C). At bacterial number concentrations of ~100 L-1, which 263
is at the higher end of bacterial cell concentrations in outdoor air15, sampling for analyses at a 264
time resolution of 30 min was feasible. 265
267
Figure 2: Five-hour sampling tests of fluorescent microspheres in an aerosol chamber at relevant particle number 268
concentrations (32-270 L-1 for 2A, ~100 L-1for 2B-D). 2A: Particle size resolved sampling efficiency. Experiment
269
was performed twice with 790 nm microspheres and both values are presented. 2B: Comparison of the
270
concentrations of microspheres in the sampling liquid measured by FC and the predicted concentration based on the
271
aerosol concentration measured by APS. The linear model (dashed lines) is shown for the microspheres
272
concentration measured by FC. 2C: Correlation between particle number concentration measured with the impinger
273
and with the optical particle counter (APS) for different sphere sizes and for experiments performed for 1 h. An
274
asterix next to the legend indicates a significant linear regression model (p < 0.001). 2D: The average number
275
concentration of microspheres in the aerosol chamber as assessed with the optical particle counter (APS) and the
276
impinger (FC) for experiments performed for 5 hours.
277 278
Dybwad et al20 showed that, aside from filter samplers, all bioaerosol samplers had low collection 279
efficiency for 1 µm fluorescent microspheres and efficiently collected microspheres in the 4 µm 280
size range. The high-flow-rate impinger XMX-CV had the highest efficiency reduction for 1 µm 281
compared to 4 µm microspheres (26-fold), collecting between ~4% and ~20% of airborne 1 µm 282
microspheres20. In comparison, the Kärcher impinger performed much better with approximately 283
75% collection efficiency at ~1 µm. The AGI-30 impinger and the SKC BioSampler have 284
collection efficiencies above 90% at 1 µm, but operate at flowrates that are three orders of 285
magnitude lower, which allows for longer deposition times and more efficient impaction due to a 286
larger pressure drop in collection zone. It has been shown that bacterial cell shape influences its 287
capture efficiency, so that the rod-shaped cells are captured with higher efficiency than spherical 288
cells31. Many bacterial cells, such as cells of the INA species Pseudomonas fluorescens, are rod 289
shaped with diameters 300–800 nm, and lengths 1000–3000 nm, resulting in an aerodynamic 290
diameter of approximately 800 nm32. However, the majority of airborne bacteria at inland sites 291
were found associated with particles and thus had an aerodynamic diameter larger than 3000 292
nm33. Thus, airborne biological particles, including bacteria, are in the diameter range that its 293
covered by the high efficiency range of the Kärcher impingers. This demonstrates that the 294
majority of airborne particles in size ranges similar to those observed for bacteria are collected by 295
the impinger. 296
297
3.2 Retention efficiency and maintenance of viability 298
299
Preservation of cell viability is an important criterion for the applicability of bio-aerosol 300
samplers, as survival is essential for further physiological studies. Three tests were performed on 301
different types of model bacteria (Proteobacteria: P. agglomerans and P. syringae; Firmicutes: B. 302
atrophaeus) as well as on a complex bacterial community from a sea water sample. The Kärcher
303
impinger performed reproducibly with respect to liquid loss rate, loss rate of bacterial cells, cell 304
viability, cell activity, and cell ice nucleation activity over the total sampling period (Table 2, 305
Figure 3). It also showed similar trends independent of the type of bacteria spiked in the 306
samplers. 307
308
A model INA strain of P. syringae was spiked into the sampling liquid to evaluate retention of 309
the total- and viable-cell concentrations as well as concentrations of ice nucleating particles (INP) 310
at temperatures between -2°C and -7°C. The total cell concentration of P. syringae did not 311
change over a 5 hour sampling period (Kruskal-Wallis test; p > 0.05) (Table 2), indicating that 312
losses of bacteria due to reaerosolization from the vortex chamber during sampling are negligible. 313
However, the proportion of viable cells, relative to total cells, dropped within the first hour of 314
sampling, from 18%±10% to 2.2%±0.2% (i.e. ~12% of the initial viability was retained). Later, 315
viability remained stable over time (Kruskal-Wallis test; p > 0.05). The concentrations of ice 316
nucleating particles behaved similarly, with the concentration of highly active INP decreasing by 317
two orders of magnitude within the first two hours of sampling, and no further change over time 318
until the end of the sampling period (Figure 3). Sampling operations caused the ice nucleation 319
profiles to be shifted down in temperature by less than 2°C, indicating that the impinger did not 320
cause significant damage to the sample and is suitable for detecting INP in bioaerosol 321
populations. 322
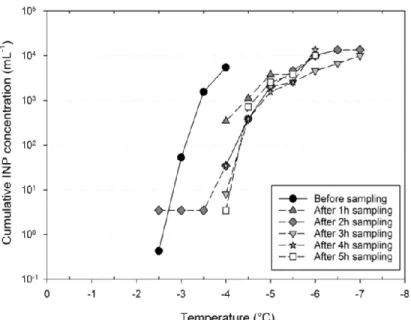
324
Figure 3: Retention efficiency of bacterial INP in the Kärcher DS5800 impinger spiked with INA P. syringae over 5
325
hours of sampling.
326 327
Two model bacterial strains and a complex bacterial seawater community were spiked into the 328
vortex chamber in order to test the extent to which bacterial concentration, viability, and 329
metabolic activity were affected by a sampling period of 120 min. The abundance of seawater 330
bacteria remained unchanged while the abundances of P. agglomerans and B. atrophaeus cells 331
were reduced to 70±3% and 79±3% of their initial values after 120 min (SI-Figure 3, Table 2). 332
The concentration of cultivable cells decreased by 50-65% (SI-Figure 4, Table 2). Relative 333
leucine incorporation in the seawater bacteria decreased by 61±7% compared to the initial values 334
(SI-Figure 4, Table 2). Also, the fraction of cultivable among total cells decreased (SI-Figure 4, 335
Table 2). However, the fraction of cultivable and metabolically active cells among the total cell 336
population decreased rapidly within the first 5 min of sampling for P. agglomerans and seawater 337
bacteria, but was more stable during the later sampling period. 338
The retention efficiency of the Kärcher impinger was compared to four other commercially 340
available impingers (Table 2, SI-Figure 3-4), including the SKC BioSampler, which was 341
previously used as a reference sampler due to its well characterized properties20. The Kärcher 342
impinger has the highest flow rate (1-2 orders of magnitude higher) and the lowest liquid loss rate 343
of all samplers (Table 2). One limitation could be that the liquid volume in the Kärcher impinger 344
is hundredfold higher than in other samplers. We show, however, that the bioaerosols collected 345
by the Kärcher impinger can be concentrated 1000-times, for example by using SterivexTM filter 346
units for performing nucleic acid extractions (see section 2.4). Liquid can be replenished through 347
the lid of the vortex chamber by pausing the sampling. In this way we can compensate for 348
evaporation, thus extending the sampling period. Refilling the sampling liquid is not an option in 349
all other models (e.g. XMX-CV), which limits the sampling time. 350
351
Using flow cytometry we show that the Kärcher impinger had lower cell losses than all other 352
samplers except for the XMX-CV. About ⅓ of the cultivable and ½ of the active cells retained 353
cultivability/activity at the end of the sampling period with the Kärcher impinger DS5600 (Table 354
2). The XMX-CV and the SKC BioSampler had a 0.9-2.6 times higherefficiency in retaining cell 355
cultivability/activity than Kärcher impinger DS5600. Thus, the performance of the Kärcher 356
impinger in terms of preserving bacterial cultivability/activity was comparable with the SKC 357
BioSampler and worse than the performance of the XMX-CV in case of the sea-water community 358
and P. agglomerans. We suggest that the short sampling time (10 min) of the XMX-CV is 359
responsible for the better performance of the XMX-CV sampler in terms of both cell losses and 360
bacterial activity losses. The SKC BioSampler is slightly better than the Kärcher DS5600 361
impinger at preserving the cultivability/activity even after one hour of operation. The flow rate of 362
this sampler, however, is more than 100-times lower than the flow rate of the Kärcher impinger, 363
which means that highly time-resolved sampling is impossible. Overall, the Kärcher impinger has 364
many advantages for investigating environmental atmospheric bacteria compared to other tested 365
impingers, due to its high flow rate, together with a comparatively high retention efficiency and 366
the possibility of long sampling time. 367
Table 1. Overview of tests and samplers used and the weather conditions for outdoor tests.
ExperimentA Sample/Locat
ion Date Samplers
Sterilization/
CleaningB Sampling liquid Sample analysis Temperature (°C)C,D Humidity (%)C,D
Wind Speed (m s -1) C,D Rain (mm) C Cloud (LWC, g m-3) D
RET Sea water, Norway 2007-04-20 DS5600,
XMX-CV, SKC BioSampler, SASS 2000PLUS, SpinCon
Ethanol/MQ rinse Sterile PBS
Enumeration of bacterial cells and cultivable bacteria, activity measurements
-1.1-8.1 27-41 5-12 00.03 /
RET P. agglomerans, Norway 2007-04-24 4.5-15.7 96-99 2-4 0 /
RET B. atrophaeus, Norway 2007-04-25 8.3-11.8 97-98 1-3 02.03 /
RET P. syringae, France / DS5800 Ethanol/MQ rinse sterile 0.9% NaCl Enumeration of total and viable bacterial cells
and IN / / / / /
SET LU / DS5600 MQ rinse MQ water Enumeration of fluorescent
microspheres / / / / /
FT
Nuuk Basic RS
2013-07-30
DS5600 HCl/MQ/Ethanol rinse Sterile high-salt soluton DNA/RNA co-extraction and quantification 13.4-17.5 31.0-48.5 / 0 / FT 2013-08-01 8.4-9.4 64.0-79.2 / 0 / FT 2013-08-01 9.1-10.2 77.2-83.7 / 0 / FT (HS) Puy de Dôme 2014-06-11
DS5800 HNO3/dH2O/bleach rinse sterile 0.9% NaCl
Enumeration of bacterial cells, viable and cultivable bacteria, quantification of IN particles / / / 0 0 FT (HS) 2014-12/13-6 13.7-17.7 77.8-100.0 2.1-6.8 0 0.00-0.07 FT (HS) 2015-06-18 10.2-13.8 79.7-94.6 1.8-2.2 0 0 FT (HS) 2015-06-16 8.1-8.8 100.00.00 2.4-3.0 0 FT (HS) 2014-26/27-6 8.3-10.3 96.5-100.0 5.5-12.0 0 0.00-0.37 FT (HS) Clermont Auvergne University Campus 2015-06-02
DS5800 HNO3/dH2O/bleach rinse sterile 0.9% NaCl Enumeration of bacterial cells and viable bacteria
21.3-24.5 21.2-41.1 2.8-4.1 0 0
FT (HS) 2015-06-05 25.6-32.4 9.6-37.3 2.9-4.7 0 0
A
RET – retention efficiency test ; SET – sampling efficiency test; FT – field test. HS – hourly subsampling
B
a – Ethanol/MQ rinse: the impinger was cleaned with ethanol and rinsed with sterile MQ. b – HCl/MQ/Ethanol rinse: the impinger was cleaned with 1 M HCl and then rinsed first with
autoclaved, filter sterilized (0.1 µm, VacuCap 90 Devices, Pall Corporation, New York) MQ water followed by 96% ethanol. The remainders of ethanol were left to evaporate under
sterile conditions. c – MQ rinse: the vortex chamber was rinsed with MQ. d – HNO3/dH2O/bleach rinse: the impinger was sterilized by an overnight application of the container with
C
Norwegian Weather data loaded from http://www.eklima.no (The Norwegian Meteorological Institute). Data from Gardermoen weather station show min-max during the experimental
period, from 0600 to 1800. For France (Ferrand University Campus and Puy de Dôme), weather data were obtained from the Observatory of the Globe Physics of
Clermont-Ferrand (OPGC).
D
Monitoring data for this paper are unpublished data, provided by L.H. Christensen, GeoBasis program run by University of Copenhagen (Dept. Geography) and Aarhus University
(Dept. Bioscience). The program is part of the Greenland Environmental Monitoring (GEM) Program financed by the Danish Environmental Protection Agency, Danish Ministry of the
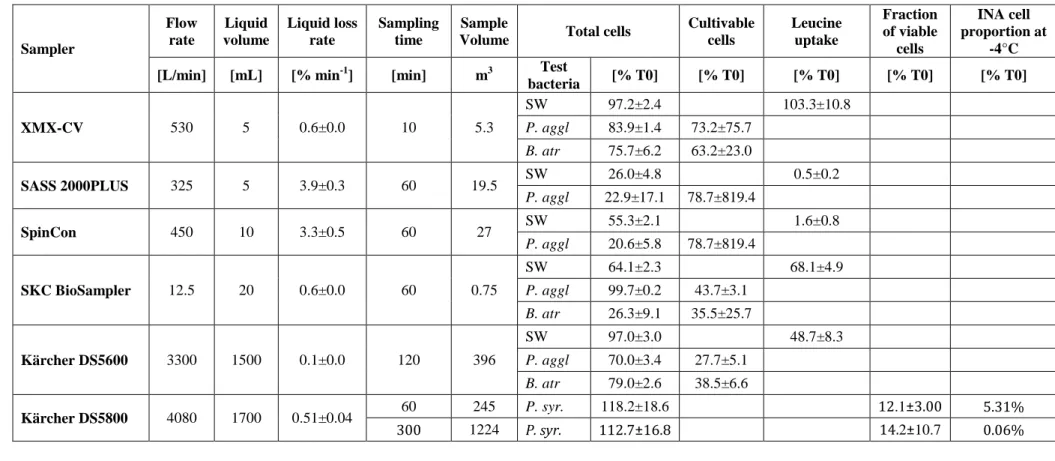
Table 2. Technical characteristics and performance of the impingers tested in this study. 1 Sampler Flow rate Liquid volume Liquid loss rate Sampling time Sample
Volume Total cells
Cultivable cells Leucine uptake Fraction of viable cells INA cell proportion at -4°C
[L/min] [mL] [% min-1] [min] m3 Test
bacteria [% T0] [% T0] [% T0] [% T0] [% T0] XMX-CV 530 5 0.6±0.0 10 5.3 SW 97.2±2.4 103.3±10.8 P. aggl 83.9±1.4 73.2±75.7 B. atr 75.7±6.2 63.2±23.0 SASS 2000PLUS 325 5 3.9±0.3 60 19.5 SW 26.0±4.8 0.5±0.2 P. aggl 22.9±17.1 78.7±819.4 SpinCon 450 10 3.3±0.5 60 27 SW 55.3±2.1 1.6±0.8 P. aggl 20.6±5.8 78.7±819.4 SKC BioSampler 12.5 20 0.6±0.0 60 0.75 SW 64.1±2.3 68.1±4.9 P. aggl 99.7±0.2 43.7±3.1 B. atr 26.3±9.1 35.5±25.7 Kärcher DS5600 3300 1500 0.1±0.0 120 396 SW 97.0±3.0 48.7±8.3 P. aggl 70.0±3.4 27.7±5.1 B. atr 79.0±2.6 38.5±6.6 Kärcher DS5800 4080 1700 0.51±0.04 60 245 P. syr. 118.2±18.6 12.1±3.00 5.31% 300 1224 P. syr. 112.7±16.8 14.2±10.7 0.06% 2
The flow rate and the sampling liquid volume provided by the manufacturer are listed, as well as the length of the sampling period as chosen by the authors (Kärcher
3
impinger) or recommended by the manufacturers (all others). We present the fraction of remaining total, viable, and cultivable cells as well as the INP-4 proportion (at -4°C)
4
out of intial values. Also, the fraction of final leucine uptake out of intial leucine uptake is given for the seawater bacterial community (SW). Values are listed as means ±
5
standard deviations; % T0 denotes the percent of the initial value.
3.3 Application to ambient bioaerosol sampling at semi-urban, mountain, and arctic sites 7
8
Deploying the sampler at a semi-urban, a remote mountain, and a pristine arctic site, we 9
demonstrate that due to its high flow rate the Kärcher impinger can be used at high-temporal 10
resolution (1- to 5-hours resolution) and a wide range of environmental conditions, in 11
particular for sampling air with low bacterial loads. The airborne bacterial communities are 12
highly diverse in terms of cell sizes, genetic diversity, and their phenotypic characteristics. 13
We show here that the Kärcher impinger can be used for, but is not limited to, quantifying 14
these communities in terms of (i) the total bacterial cells, (ii) cultivable bacterial cells, (iii) ice 15
nucleating particles, and (iv) nucleic acids. Using this sampler for collecting airborne viruses 16
in remote air was also attempted34, but this would require further development. 17
18
3.3.1. Quantification of total cells 19
20
Cell concentration in the sampling liquid increased over time, reaching concentrations of ~102 21
to ~105 cells mL-1 over the entire sampling period (SI-Figure 6). Two samples were collected 22
at a semi-urban site on the Clermont-Auvergne University campus (Clermont-Ferrand, 23
France). The inferred airborne cell concentrations ranged between 3.7±0.6 and 12.5±3.4 cells 24
L-1. Five samples were collected at the Puy de Dôme mountain site (1465 m asl) at different 25
periods (day and night) and under different weather conditions, including the presence of a 26
cloud at the sampling site (Table 1). Overall, the inferred airborne bacterial concentrations 27
ranged between (0.6±0.1)×100 and (2.8±0.2)×103 cells L-1, with variations depending on 28
sampling date and time (Table 1, Figure 4). Diurnal variations in bioaerosol concentrations 29
have been previously described, but only based on culturable fraction of the airborne 30
communities35,36. Here, similarly but focusing on total cells, we recorded higher cell number 31
concentrations around midday (June 11th 2015) than during the night and in the morning (June 32
12th, 16th, 18th, and 26th 2015). This illustrates that the Kärcher impinger can potentialy be 33
used for describing diurnal short-term variations of total bacterial concentrations. 34
35 36
37
Figure 4: Evolution of total airborne bacteria concentrations inferred from measurements in the sampling liquid 38
of the Kärcher DS5800 impinger, averaged over the cumulated duration of sampling at the semi-urban site
39
(University campus) and at the mountain site puy de Dôme (PDD) in France. Error bars are standard errors of
40
measurements on at least triplicate subsamples of the sampling liquid. The concentration measured just before
41
sampling (time “zero”) at each occasion was deducted from the data. A dashed circle on a symbol indicates the
42
presence of a cloud during the preceding sampling hour.
43 44
3.3.2. Quantification of culturable and viable cells 45
46
Three air samples were investigated for cultivable bacteria. Their concentration in the 47
sampling liquid increased with sampling time and reached around ~200 CFU mL-1 over the 48
entire sampling period, corresponding to an average airborne concentration of 3.9×10⁻² to 1.1 49
cultivable cells L-1 (SI-Figure 7), or 0.02% to 11.2% of the total bacteria counted by flow 50
cytometry. At realistic airborne concentration of 1-10 CFU L-1, the detection limit for CFU 51
counts (i.e. 20 colony per plate) is reached in 8-80 minutes with the Kärcher impinger, due to 52
its high airflow rate. However, large uncertainties were often associated with CFU counts 53
(coefficient of variation of the mean count of triplicate plating: 13% < CV < 96%, ~ 50% in 54
average). On the other hand, when viability was assessed by flow cytometry using 55
LIVE/DEAD staining (Figure 5), results were more consistent, with CV ranging between 4% 56
and 34% of the mean. Viable cells accounted for 2.8% to 6.6% ot the total cell number, and 57
viability was not linked with cultivability. Viability did not decrease over sampling duration, 58
contrary to observations made on the model bacterial strain (SI-Figure 4), but seemed rather 59
linked with environmental conditions: we observed a higher cell viability during the night 60
(Figure 5), consistently with previous reports37. 61
62
Figure 5: 5A. Evolution of INP-10 concentration in the sampling liquid during sampling at the mountain site
63
(PDD). 5B. Corresponding cumulative freezing profiles at the end of the sampling period expressed as airborne
64
concentrations averaged over the duration of sampling. 5C. Evolution of the proportion of viable cells
65
determined by LIVE/DEAD staining, during day/night sampling. Error bars are standard deviations from the
mean of measurements on triplicate subsamples of the sampling liquid. A dashed circle on a symbol indicates the
67
presence of a cloud during the preceding sampling hour.
68 69
3.3.3. Quantification of ice nucleating particles (INP) 70
71
The temporal evolution of the INP-10 (INP that intiate freezing at temperatures ≥-10°C) 72
concentrations in the sampling liquid during sampling, as well as the endpoint freezing 73
profiles of air samples collected at the mountain site, are shown in Figure 5. SI-Figure 8 74
shows the hourly evolution of the freezing profiles measured between 0°C and -12.5°C during 75
sampling. The average airborne concentrations of INP-10 over the duration of sampling, 76
inferred from measurements in the sampling liquid, ranged between < 10-3 INP L-1 and 77
~14×10-3 INP L-1. These are consistent with observations made at comparable sites using 78
other sampling methods38,39. At such low concentrations of airborne IN, the detection limit of 79
our method (0.05 IN mL-1 of liquid) was reached in less than 20 minutes with the Kärcher 80
impinger, while about 80 minutes would be needed to reach the detection limit with a low-81
flow-rate impinger, such as the BioSampler. 82
83 84 85
3.3.4 Quantification of nucleic acids in Arctic ambient air 86
87
Three samples were collected in duplicates and used for the quantification of 16S-rRNA-gene 88
and 16S-rRNA-molecules in air (SI-Figure 9). Three duplicated (duplicates denoted _A and _B) 89
samples showed consistent results for bacterial cell concentrations (sample A11: (5.5±0.2)×10-1 90
cell L-1, sample A16: 6.8±3.1 cell L-1, and sample A17: (2.9±0.7)×10-1 cell L-1), which 91
demonstrates that the Kärcher impinger can be used in pristine air to quantify bacterial cells 92
based on molecular microbiological methods. The background concentrations of 16S rRNA 93
genes reached between 0.4% and 26% of the concentrations measured in air (SI Figure 9), 94
pointing at a low signal to noise ratio. This indicates that we were in some cases very close to the 95
detection limit, which was due to the extremely low bacterial loads (~103 per m3 of air). Thus, the 96
high flow rate of the Kärcher impinger allows us to quantify bacterial cell at such conditions. The 97
16S rRNA copy number concentration, which roughly corresponds to the ribosome concentration 98
in air, was between 8.3×101 and 1.1×10⁴ copies L-1 and was highly variable between duplicates, 99
indicating the heterogeneity of the atmospheric bacterial community in terms of its activity. The 100
background contamination on the RNA level was assessed on two occasions and was 0.1% and 101
1.6% of the 16S rRNA copy numbers (SI-Figure 9). 102
103
Other samplers have previously been employed for molecular analysis of genomic DNA and 104
RNA. Most studies used filter samplers to collect samples for DNA analysis19,40,41. SKC 105
BioSampler impingers have been used to investigate the diversity of airborne bacterial 106
populations as well as to quantify airborne ina genes with qPCR targeting genomic DNA17,42. Ina 107
gene concentrations were below the detection limit in most cases42, which was likely due to a low 108
sampling capacity of the SKC BioSampler. It has been shown that the SKC BioSamplers can be 109
used for molecular studies on the RNA level either in environments heavily loaded with RNA 110
viruses or by using 24 SKC BioSamplers in parallel to be able to perform RNA analysis of 111
bacteria43. We show that the Kärcher impinger allows both obtaining a sufficient amount of cells 112
in pristine environments with low bacterial loads, and also preserving bioaerosols for sensitive 113
RNA analysis, making it suitable for carrying out state-of-the-art molecular analysis. 114
115
In conclusion, we characterized a high-volume impinger and confirm that it is highly effective for 116
quantitative and qualitative research on airborne microorganisms. The impinger has a high 117
collection- and retention efficiency, facilitates sampling under diverse environmental conditions, 118
and gives reliable results in environments with low biomass. In comparison to four other 119
commercially available impingers, the Kärcher impinger had lower cell losses during sampling 120
and was suited for preserving viability, activity, and ice nucleation activity of bacterial cells. Its 121
main advantages over alternative impingers are its higher flow rate, low liquid loss, and ability to 122
sample over long periods. Finally, the Kärcher impinger is an accessible device that most 123
research groups could employ, which is in support of standardization within aero-microbiology. 124
125
Acknowledgements 126
This work was supported by grants from the EU PASR 2006 programme (project Aerobactics, 127
contract SEC6-PR-214400), The Research Council of Norway (project MicrobAir, contract no. 128
177802), the Swedish Resarch Council FORMAS (project 2014-1460) and the Danish Council 129
for Independent Research (project NUMEN, DFF-FTP-4005-00485B). TST is grateful for 130
funding from the Stellar Astrophysics Centre, which is provided by The Danish National 131
Research Foundation (Grant agreement DNRF106). KF, UG and TST acknowledge support by 132
the AUFF Nova programme (AUFF-E-2015-FLS-9-10). We gratefully acknowledge the 133
contributions of Arctic Research Centre (ARC), Aarhus University and the Canada Excellence 134
Research Chair (CERC). This work is a contribution to the Arctic Science Partnership (ASP). PA 135
is grateful to LaMP-OPGC, in particular J.M. Pichon, for providing meteorological data, and to 136
Fédération de Recherche en Environnement (CNRS FR3467) for partial financial support. 137
Special thanks go to F. Conen, L. Zimmerman and E. Stopelli, University of Basel, for kindly 138
providing LINDA, and to S. Souzani and H. Licina, Lund University, for providing the model of 139 the airflow. 140 141 Supporting Information. 142
The Supporting Information is available free of charge on the ACS Publications website. 143
The content of the Supporting Information includes: Supporting Methods, Supporting Figures 1-9 144
& Tables, and Supporting References. The methods used for assessing sampling and retention 145
efficiencies, as well as for bioaerosol analysis (i.e. total, viable and cultivable bacterial cells, 146
fluorescent microspheres, ice nuclei and nucleic acids quantifications and metabolic activity 147
measurements) are presented in Supporting Information (SI, Section SI-1.2 and SI-1.3). 148
149
5.
References
150(1) Brodie, E. L.; DeSantis, T. Z.; Parker, J. P. M.; Zubietta, I. X.; Piceno, Y. M.; Andersen, 151
G. L. Urban Aerosols Harbor Diverse and Dynamic Bacterial Populations. Proc. Natl. 152
Acad. Sci. U. S. A. 2007, 104 (1), 299–304.
153
(2) Vinatier, V.; Wirgot, N.; Joly, M.; Sancelme, M.; Abrantes, M.; Deguillaume, L.; Delort, 154
A.-M. Siderophores in Cloud Waters and Potential Impact on Atmospheric Chemistry: 155
Production by Microorganisms Isolated at the Puy de Dôme Station. Environ. Sci. Technol. 156
2016, 50 (17), 9315–9323 DOI: 10.1021/acs.est.6b02335. 157
(3) Vaïtilingom, M.; Amato, P.; Sancelme, M.; Laj, P.; Leriche, M.; Delort, A.-M. 158
Contribution of Microbial Activity to Carbon Chemistry in Clouds. Appl. Environ. 159
Microbiol. 2010, 76 (1), 23–29 DOI: 10.1128/AEM.01127-09.
160
(4) Vaïtilingom, M.; Deguillaume, L.; Vinatier, V.; Sancelme, M.; Amato, P.; Chaumerliac, 161
N.; Delort, A.-M. Potential Impact of Microbial Activity on the Oxidant Capacity and 162
Organic Carbon Budget in Clouds. Proc. Natl. Acad. Sci. U. S. A. 2013, 110 (2), 559–564 163
DOI: 10.1073/pnas.1205743110. 164
(5) Šantl-Temkiv, T.; Finster, K.; Hansen, B. M.; Pašić, L.; Karlson, U. G. Viable 165
Methanotrophic Bacteria Enriched from Air and Rain Can Oxidize Methane at Cloud-like 166
Conditions. Aerobiologia (Bologna). 2013, 29 (3), 373–384 DOI: 10.1007/s10453-013-167
9287-1. 168
(6) Hill, K. a.; Shepson, P. B.; Galbavy, E. S.; Anastasio, C.; Kourtev, P. S.; Konopka, A.; 169
Stirm, B. H. Processing of Atmospheric Nitrogen by Clouds above a Forest Environment. 170
J. Geophys. Res. 2007, 112 (D11), D11301 DOI: 10.1029/2006JD008002.
171
(7) Möhler, O.; DeMott, P. J.; Vali, G.; Levin, Z. Microbiology and Atmospheric Processes: 172
The Role of Biological Particles in Cloud Physics. Biogeosciences 2007, 4 (6), 1059–1071 173
DOI: 10.5194/bg-4-1059-2007. 174
(8) Delort, A.-M.; Vaïtilingom, M.; Amato, P.; Sancelme, M.; Parazols, M.; Mailhot, G.; Laj, 175
P.; Deguillaume, L. A Short Overview of the Microbial Population in Clouds: Potential 176
Roles in Atmospheric Chemistry and Nucleation Processes. Atmos. Res. 2010, 98 (2–4), 177
249–260 DOI: 10.1016/j.atmosres.2010.07.004. 178
(9) Després, V. R.; Alex Huffman, J.; Burrows, S. M.; Hoose, C.; Safatov, A. S.; Buryak, G.; 179
Fröhlich-Nowoisky, J.; Elbert, W.; Andreae, M. O.; Pöschl, U.; Jaenicke, R. Primary 180
Biological Aerosol Particles in the Atmosphere: A Review. Tellus B 2012, 64 DOI: 181
10.3402/tellusb.v64i0.15598. 182
(10) Bigg, E. K.; Soubeyrand, S.; Morris, C. E. Persistent after-Effects of Heavy Rain on 183
Concentrations of Ice Nuclei and Rainfall Suggest a Biological Cause. Atmos. Chem. Phys. 184
2015, 15 (5), 2313–2326 DOI: 10.5194/acp-15-2313-2015. 185
(11) Hoose, C.; Kristjánsson, J. E.; Burrows, S. M. How Important Is Biological Ice Nucleation 186
in Clouds on a Global Scale? Environ. Res. Lett. 2010, 5 (2), 24009 DOI: 10.1088/1748-187
9326/5/2/024009. 188
(12) Morris, C. E.; Sands, D. C.; Vinatzer, B. a; Glaux, C.; Guilbaud, C.; Buffière, A.; Yan, S.; 189
Dominguez, H.; Thompson, B. M. The Life History of the Plant Pathogen Pseudomonas 190
Syringae Is Linked to the Water Cycle. ISME J. 2008, 2 (3), 321–334 DOI: 191
10.1038/ismej.2007.113. 192
(13) Renard, P.; Canet, I.; Sancelme, M.; Wirgot, N.; Deguillaume, L.; Delort, A.-M. Screening 193
of Cloud Microorganisms Isolated at the Puy de Dôme (France) Station for the Production 194
of Biosurfactants. Atmos. Chem. Phys. 2016, 16 (18), 12347–12358 DOI: 10.5194/acp-16-195
12347-2016. 196
(14) Pedersen, K. Exploration of Deep Intraterrestrial Microbial Life: Current Perspectives. 197
FEMS Microbiol. Lett. 2000, 185 (1), 9–16 DOI: 10.1111/j.1574-6968.2000.tb09033.x.
198
(15) Burrows, S. M.; Elbert, W.; Lawrence, M. G.; Pöschl, U. Bacteria in the Global 199
Atmosphere – Part 1: Review and Synthesis of Literature Data for Different Ecosystems. 200
Atmos. Chem. Phys. 2009, 9 (23), 9263–9280 DOI: 10.5194/acp-9-9263-2009.
201
(16) Lin, X.; A. Reponen, T.; Willeke, K.; Grinshpun, S. A.; Foarde, K. K.; Ensor, D. S. Long-202
Term Sampling of Airborne Bacteria and Fungi into a Non-Evaporating Liquid. Atmos. 203
Environ. 1999, 33 (26), 4291–4298 DOI: 10.1016/S1352-2310(99)00169-7.
204
(17) Fierer, N.; Liu, Z.; Rodríguez-Hernández, M.; Knight, R.; Henn, M.; Hernandez, M. T. 205
Short-Term Temporal Variability in Airborne Bacterial and Fungal Populations. Appl. 206
Environ. Microbiol. 2008, 74 (1), 200–207 DOI: 10.1128/AEM.01467-07.
207
(18) Reponen, T.; Willeke, K.; Grinshpun, S.; Nevalainen, A. Biological Particle Sampling. In 208
Aerosol Measurement; John Wiley & Sons, Inc.: Hoboken, NJ, USA, 2011; pp 549–570.
209
(19) Radosevich, J. L.; Wilson, W. J.; Shinn, J. H.; DeSantis, T. Z.; Andersen, G. L. 210
Development of a High-Volume Aerosol Collection System for the Identification of Air-211
Borne Micro-Organisms. Lett. Appl. Microbiol. 2002, 34 (3), 162–167. 212
(20) Dybwad, M.; Skogan, G.; Blatny, J. M. Comparative Testing and Evaluation of Nine 213
Different Air Samplers: End-to-End Sampling Efficiencies as Specific Performance 214
Measurements for Bioaerosol Applications. Aerosol Sci. Technol. 2014, 48 (3), 282–295 215
DOI: 10.1080/02786826.2013.871501. 216
(21) Parks, S. R.; Bennett, A. M.; Speight, S. E.; Benbough, J. E. An Assessment of the 217
Sartorius MD8 Microbiological Air Sampler. J. Appl. Bacteriol. 1996, 80 (5), 529–534 218
DOI: 10.1111/j.1365-2672.1996.tb03252.x. 219
(22) Pady, S. M. An Improved Slit Sampler for Aerobiological Investigations. Trans. Kansas 220
Acad. Sci. 1954, 57 (2), 157 DOI: 10.2307/3626015.
221
(23) Schmale III, D. G.; Dingus, B. R.; Reinholtz, C. Development and Application of an 222
Autonomous Unmanned Aerial Vehicle for Precise Aerobiological Sampling above 223
Agricultural Fields. J. F. Robot. 2008, 25 (3), 133–147 DOI: 10.1002/rob.20232. 224
(24) Lin, X.; Willeke, K.; Ulevicius, V.; Grinshpun, S. A. Effect of Sampling Time on the 225
Collection Efficiency of All-Glass Impingers. Am. Ind. Hyg. Assoc. J. 1997, 58 (7), 480– 226
488 DOI: 10.1080/15428119791012577. 227
(25) Rule, A. M.; Kesavan, J.; Schwab, K. J.; Buckley, T. J. Application of Flow Cytometry for 228
the Assessment of Preservation and Recovery Efficiency of Bioaerosol Samplers Spiked 229
with Pantoea Agglomerans. Environ. Sci. Technol. 2007, 41 (7), 2467–2472. 230
(26) Zweifel, U. L.; Hagström, Å.; Holmfeldt, K.; Thyrhaug, R.; Geels, C.; Frohn, L. M.; 231
Skjøth, C. A.; Karlson, U. G. High Bacterial 16S rRNA Gene Diversity above the 232
Atmospheric Boundary Layer. Aerobiologia (Bologna). 2012, 28 (4), 481–498 DOI: 233
10.1007/s10453-012-9250-6. 234
(27) Mainelis, G.; Berry, D.; Reoun An, H.; Yao, M.; DeVoe, K.; Fennell, D. E.; Jaeger, R. 235
Design and Performance of a Single-Pass Bubbling Bioaerosol Generator. Atmos. Environ. 236
2005, 39 (19), 3521–3533 DOI: 10.1016/j.atmosenv.2005.02.043. 237
(28) Vaïtilingom, M.; Attard, E.; Gaiani, N.; Sancelme, M.; Deguillaume, L.; Flossmann, A. I.; 238
Amato, P.; Delort, A.-M. Long-Term Features of Cloud Microbiology at the Puy de Dôme 239
(France). Atmos. Environ. 2012, 56, 88–100 DOI: 10.1016/j.atmosenv.2012.03.072. 240
(29) Simon, M.; Azam, F. Protein Content and Protein Synthesis Rates of Planktonic Marine 241
Bacteria. Mar. Ecol. Prog. Ser. 1989, 51, 201–2013. 242
(30) Lever, M. A.; Torti, A.; Eickenbusch, P.; Michaud, A. B.; Šantl-Temkiv, T.; Jørgensen, B. 243
B. A Modular Method for the Extraction of DNA and RNA, and the Separation of DNA 244
Pools from Diverse Environmental Sample Types. Front. Microbiol. 2015, 6 (MAY) DOI: 245
10.3389/fmicb.2015.00476. 246
(31) Willeke, K.; Qian, Y.; Donnelly, J.; Grinshpun, S.; Ulevicius, V. Penetration of Airborne 247
Microorganisms Through a Surgical Mask and a Dust/Mist Respirator. Am. Ind. Hyg. 248
Assoc. J. 1996, 57 (4), 348–355 DOI: 10.1080/15428119691014882.
249
(32) Jones, A. M.; Harrison, R. M. The Effects of Meteorological Factors on Atmospheric 250
Bioaerosol Concentrations - A Review. Sci. Total Environ. 2004, 326 (1–3), 151–180 251
DOI: 10.1016/j.scitotenv.2003.11.021. 252
(33) Shaffer, B. T.; Lighthart, B. Survey of Culturable Airborne Bacteria at Four Diverse 253
Locations in Oregon: Urban, Rural, Forest, and Coastal. Microb. Ecol. 1997, 34 (3), 167– 254
177. 255
(34) Courault, D.; Albert, I.; Perelle, S.; Fraisse, A.; Renault, P.; Salemkour, A.; Amato, P. 256
Assessment and Risk Modeling of Airborne Enteric Viruses Emitted from Wastewater 257
Reused for Irrigation. Sci. Total Environ. 2017, 592, 512–526 DOI: 258
10.1016/j.scitotenv.2017.03.105. 259
(35) Lighthart, B. An Hypothesis Describing the General Temporal and Spatial Distribution of 260
Alfresco Bacteria in the Earth ’ S Atmospheric Surface Layer. 1999, 33, 611–615. 261
(36) Lighthart, B.; Shaffer, B. T. Airborne Bacteria in the Atmospheric Surface Layer: 262
Temporal Distribution above a Grass Seed Field. Appl. Environ. Microbiol. 1995, 61 (4), 263
1492–1496. 264
(37) Tong, Y.; Lighthart, B. Solar Radiation Has a Lethal Effect on Natural Populations of 265
Culturable Outdoor Atmospheric Bacteria. Atmos. Environ. 1997, 31 (6), 897–900 DOI: 266
10.1016/S1352-2310(96)00235-X. 267
(38) Conen, F.; Henne, S.; Morris, C. E.; Alewell, C. Atmospheric Ice Nucleators Active 268
&ge; &minus;12 &deg;C Can Be Quantified on 269
PM<sub>10</sub> Filters. Atmos. Meas. Tech. 2012, 5 (2), 321–327 DOI: 270
10.5194/amt-5-321-2012. 271
(39) Joly, M.; Amato, P.; Deguillaume, L.; Monier, M.; Hoose, C.; Delort, A.-M. 272
Quantification of Ice Nuclei Active at near 0 °C Temperatures in Low-Altitude Clouds at 273
the Puy de Dôme Atmospheric Station. Atmos. Chem. Phys. 2014, 14 (15), 8185–8195. 274
(40) Bowers, R. M.; Sullivan, A. P.; Costello, E. K.; Collett, J. L.; Knight, R.; Fierer, N. 275
Sources of Bacteria in Outdoor Air across Cities in the Midwestern United States. Appl. 276
Environ. Microbiol. 2011, 77 (18), 6350–6356 DOI: 10.1128/AEM.05498-11.
277
(41) DeLeon-Rodriguez, N.; Lathem, T. L.; Rodriguez-R, L. M.; Barazesh, J. M.; Anderson, B. 278
E.; Beyersdorf, A. J.; Ziemba, L. D.; Bergin, M.; Nenes, A.; Konstantinidis, K. T. 279
Microbiome of the Upper Troposphere: Species Composition and Prevalence, Effects of 280
Tropical Storms, and Atmospheric Implications. Proc. Natl. Acad. Sci. U. S. A. 2013, 110 281
(7), 2575–2580 DOI: 10.1073/pnas.1212089110. 282
(42) Garcia, E.; Hill, T. C. J.; Prenni, A. J.; DeMott, P. J.; Franc, G. D.; Kreidenweis, S. M. 283
Biogenic Ice Nuclei in Boundary Layer Air over Two U.S. High Plains Agricultural 284
Regions. J. Geophys. Res. Atmos. 2012, 117 (D18), 1–12 DOI: 10.1029/2012JD018343. 285
(43) Lindsley, W. G.; Blachere, F. M.; Thewlis, R. E.; Vishnu, A.; Davis, K. A.; Cao, G.; 286
Palmer, J. E.; Clark, K. E.; Fisher, M. A.; Khakoo, R.; Beezhold, D. H. Measurements of 287
Airborne Influenza Virus in Aerosol Particles from Human Coughs. PLoS One 2010, 5 288
(11), e15100 DOI: 10.1371/journal.pone.0015100. 289