HAL Id: hal-00302143
https://hal.archives-ouvertes.fr/hal-00302143
Submitted on 26 Sep 2006HAL is a multi-disciplinary open access
archive for the deposit and dissemination of sci-entific research documents, whether they are pub-lished or not. The documents may come from teaching and research institutions in France or abroad, or from public or private research centers.
L’archive ouverte pluridisciplinaire HAL, est destinée au dépôt et à la diffusion de documents scientifiques de niveau recherche, publiés ou non, émanant des établissements d’enseignement et de recherche français ou étrangers, des laboratoires publics ou privés.
Differences between the QBO in the first and in the
second half of the ERA-40 reanalysis
H. J. Punge, M. A. Giorgetta
To cite this version:
H. J. Punge, M. A. Giorgetta. Differences between the QBO in the first and in the second half of the ERA-40 reanalysis. Atmospheric Chemistry and Physics Discussions, European Geosciences Union, 2006, 6 (5), pp.9259-9271. �hal-00302143�
ACPD
6, 9259–9271, 2006The QBO in the first and in the second
half of ERA-40 H. J. Punge and M. A. Giorgetta Title Page Abstract Introduction Conclusions References Tables Figures J I J I Back Close Full Screen / Esc
Printer-friendly Version Interactive Discussion
Atmos. Chem. Phys. Discuss., 6, 9259–9271, 2006 www.atmos-chem-phys-discuss.net/6/9259/2006/ © Author(s) 2006. This work is licensed
under a Creative Commons License.
Atmospheric Chemistry and Physics Discussions
Di
fferences between the QBO in the first
and in the second half of the ERA-40
reanalysis
H. J. Punge1,2and M. A. Giorgetta1
1
Max Planck Institute for Meteorology, Bundesstr. 53, 20146 Hamburg, Germany
2
IMPRS on Earth System Modelling, Bundesstr. 53, 20146 Hamburg, Germany
Received: 4 September 2006 – Accepted: 9 September 2006 – Published: 26 September 2006 Correspondence to: H. J. Punge (heinzjuergen.punge@zmaw.de)
ACPD
6, 9259–9271, 2006The QBO in the first and in the second
half of ERA-40 H. J. Punge and M. A. Giorgetta Title Page Abstract Introduction Conclusions References Tables Figures J I J I Back Close Full Screen / Esc
Printer-friendly Version Interactive Discussion
Abstract
The representation of the quasi-biennial oscillation (QBO) is investigated in the ERA-40 reanalysis. In the lower stratosphere, where there is a good number of observations, the representation of the QBO is equally well throughout the record. However, strong differences between the first and the second half of the zonal wind data set are found
5
in the upper stratosphere, with a typical offset of –10 m/s in the equatorial zonal wind in the earlier part versus the later part of the ERA-40 data set. The strength of the QBO is also affected. Possible explanations are discussed. The identified change of the assimilated wind profiles over time in ERA-40 requires a careful use of equatorial upper stratospheric winds from the reanalysis for validation purposes.
10
1 Introduction
Present-day reanalyses include observations over several decades in a rather consis-tent manner. Dynamic modes like ENSO, NAO or the quasi-biennial oscillation (QBO) are represented with remarkable accuracy. For the QBO, the present study confirms this for the lower stratosphere, showing a constant signal over the course of the ERA-40
15
reanalysis (Uppala et al.,2005). In the upper stratosphere, however, the early and late portions of the data set differ significantly. Unfortunately, the number of QBO cycles in the timeseries available from reanalyses is limited. More or less continuous obser-vations of the QBO domain in the stratosphere exist only since the 1950ies. For this reason, it is very difficult to make statistically sound statements. Also, this work does
20
not include a detailed comparison to observational data records on the QBO, as it has already been presented in literature (Baldwin and Gray, 2005; Uppala et al., 2004). Rather, the purpose of this work is to illustrate the change in the upper stratospheric QBO using two 20-year sections of zonal wind data. It should be noted that there is another useful way to study the QBO and its variability by use of climate models that
25
ACPD
6, 9259–9271, 2006The QBO in the first and in the second
half of ERA-40 H. J. Punge and M. A. Giorgetta Title Page Abstract Introduction Conclusions References Tables Figures J I J I Back Close Full Screen / Esc
Printer-friendly Version Interactive Discussion
(2006) for instance.
The European Centre for Medium-Range Weather Forecasts (ECMWF) has used a recent version of its forecast model to prepare the long range reanalysis ERA-40. It is based on a wide range of observations, taken both from ground stations and satellites. However, kind and number of observations vary strongly during 1957 to 2002, the time
5
range of the reanalysis (Uppala et al., 2004). A study on sensitivity of ERA-40 on the observing system was performed by Bengtsson et al. (2004). The atmosphere is covered up to an altitude of 0.1 hPa with a good vertical resolution of 60 levels. Therefore one can expect a fair representation also of the stratosphere. However, care needs to be taken because observations are sparse at high altitudes. We want to look
10
at variability on the interannual scale, so it is sufficient to use monthly means of the 6-hourly ERA-40 data set for our work.
A realistic representation of the QBO in ERA-40 has been reported in previous publi-cations on this topic, e.g. inBaldwin and Gray(2005),Pascoe et al.(2005) andRandel
et al. (2004). The QBO timeseries of zonal wind in ERA-40 presented in the literature
15
(Uppala et al.,2004, see Fig. 12 therein) and the remarks of Giorgetta et al. (2006) motivated a closer look at possible long term variations in the QBO amplitude. We choose a composite approach to study this question.
The ERA-40 record is split to reveal a possible difference between its earlier and later years, and to still have a comparable number of cycles in each composite. Some
20
details of the composite are highlighted and the magnitude of the difference in the QBO is compared to the one in the annual cycle. A discussion of implications of the findings concludes this work.
2 Methods
Composites are a common tool for analyzing periodic signals. Given a time series
25
of data, one chooses a reference value and marks all points in time when the time series is rising above (or alternatively falling below) this selected reference value. The
ACPD
6, 9259–9271, 2006The QBO in the first and in the second
half of ERA-40 H. J. Punge and M. A. Giorgetta Title Page Abstract Introduction Conclusions References Tables Figures J I J I Back Close Full Screen / Esc
Printer-friendly Version Interactive Discussion
composite is then computed as the average of all partial timeseries centered around the identified points in time. This composite shows the typical time evolution in the selected time frame with respect to the time when the reference value occurs. Uncertainty in the evolution increases by construction from the point of reference to larger time lags before or after this point, and also with increasing spatial distance to this point.
5
This method is applied routinely (Giorgetta et al., 2006), for QBO signals, where usually the transition from easterlies to westerlies or vice versa is chosen as reference value. The solution to this problem is straightforward, one can calculate composites at every grid point and assemble them appropriately. In the context of the QBO, this would mean to compute the average delay of the change in wind direction from one level to
10
the other or, possibly, from one latitude to the next, and use it as the delay for the composites. Difficulties can arise when the number of nodes varies among the levels, which is why this method is feasible only in regions where the QBO is the dominant mode of variability.
For our purposes it is adequate to neglect the latitude dependence of the QBO
am-15
plitude, as it is approximately Gaussian around the equator where the QBO is driven (Holton and Lindzen,1972; Baldwin et al., 2001) and extratropical signals are result rather than cause of the tropical QBO. Thus, we use+/–5◦latitudinal averages through-out this work, accounting for the core zone of the QBO. Furthermore, we substract the climatological annual variability but retain the annual mean, so that the filtered data still
20
contain the characteristic asymmetries between westerly and easterly jets.
Unfortunately the zonal wind time series are not strictly monotonous around the east-west/west-east transitions even in the QBO core region between 10 and 50 hPa where the signal is most prominent. Some cycles show delays or short reversals on the order of few months. This can lead to additional, artificial partial time series in the
25
construction of composites which distort the result. One solution to this problem would be to compute the composites from smoothed, e.g. 5-month averaged time series. Instead, we decided to construct our composites only at one level at the upper end of the QBO core region, and to check the partial time series manually. The 10 hPa
ACPD
6, 9259–9271, 2006The QBO in the first and in the second
half of ERA-40 H. J. Punge and M. A. Giorgetta Title Page Abstract Introduction Conclusions References Tables Figures J I J I Back Close Full Screen / Esc
Printer-friendly Version Interactive Discussion
level was chosen because in this work the focus is on the upper stratosphere where observations are sparse and therefore discrepancies are likely to occur. The closer the construction level is to the region of interest, the more accurate are the composites. If there are several transitions of zero zonal wind close to each other due to a reversal as described above, we select only the first one of them for the composites as it appears
5
to suit best for depicting the QBO evolution before and thereby above the transition, as the QBO generally propagates downward.
3 Results
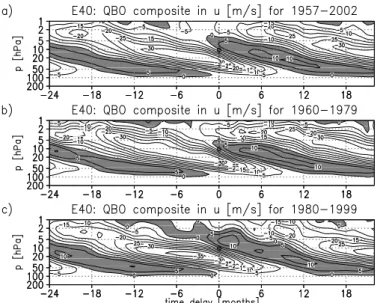
Composites of zonal wind in time and altitude, taken at the transition from easterlies to westerlies at 10 hPa, are shown in Fig. 1. Composites are displayed for the whole
10
ERA-40 record (a) and partial records 1960–1979 (b) and 1980–1999 (c).
For all three composites, the QBO period is about 27 months, the peak-to-peak amplitude reaches 45 to 50 m/s and the velocity of vertical propagation is similar. Fur-thermore, all composites feature some typical characteristics of the QBO, including stronger easterlies than westerlies, westerlies persisting longer in the lower part of the
15
QBO regime, and rapid decrease of the amplitude below 70 hPa. At the top of the QBO domain, however, the composite differ from each other.
Significant differences occur for the two 20-year time frames used for Figs. 1b and c. Between 2 and 10 hPa in the upper stratosphere, an easterly anomaly in zonal wind is observed in the early years when compared to the later period. At lower levels, below
20
10 hPa, the two composites agree quite well, considering that only 7 and 6 QBO cycles were used for the construction, respectively. To further illustrate the differences we present cross sections through the composite in Figs. 2 and 3.
Figure 2 displays the state of the QBO at transition from easterlies to westerlies and from easterlies to westerlies at 10 hPa. For both composite types, the difference
be-25
tween the early and late periods of ERA-40 is obvious. The differences are strongest between 7 and 2 hPa. Above, it tends to reverse, but one has to keep in mind that there
ACPD
6, 9259–9271, 2006The QBO in the first and in the second
half of ERA-40 H. J. Punge and M. A. Giorgetta Title Page Abstract Introduction Conclusions References Tables Figures J I J I Back Close Full Screen / Esc
Printer-friendly Version Interactive Discussion
may be some difference in phase among the composites at these levels and that the QBO amplitude becomes small. Below 10 hPa, the differences are small for both kinds of composites, i.e. smaller than 10% of the amplitude. For the transition to easterlies, there seems to be a slight phase difference between the two composites, indicating that there may be a small difference even at 10 hPa distorting the construction of
com-5
posites to a small amount.
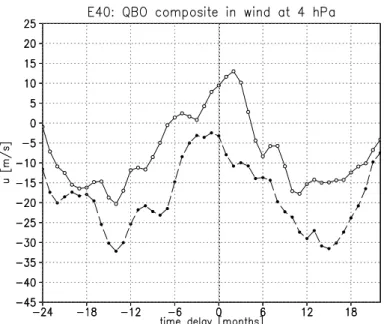
Figure 3 shows the evolution of the QBO at 4.2 hPa. The difference between the two periods amounts to up to 25 m/s. Note that the signals are relatively noisy, as the semiannual oscillation is quite strong at these levels and does not cancel entirely for the 20 year periods, indicating that the removal of the annual signal was not complete.
10
Still, the difference does not seem to depend on the phase of the QBO in a simple manner.
The difference found in Figs. 1–3 may be due to the lack of data in the assimilation in the pre-satellite era allowing the model to develop its own dynamics (Sterl,2004;
Uppala et al.,2005). On the other hand,Uppala et al.(2005) mention that corrections
15
were applied to the radiosonde temperature data from 1980 on. So if there is a sys-tematic bias in the tropical radiosonde observations, this could explain our finding, and it could be corrected for in future reanalysis. However, natural variability can certainly not be ruled out as an explanation at this point.
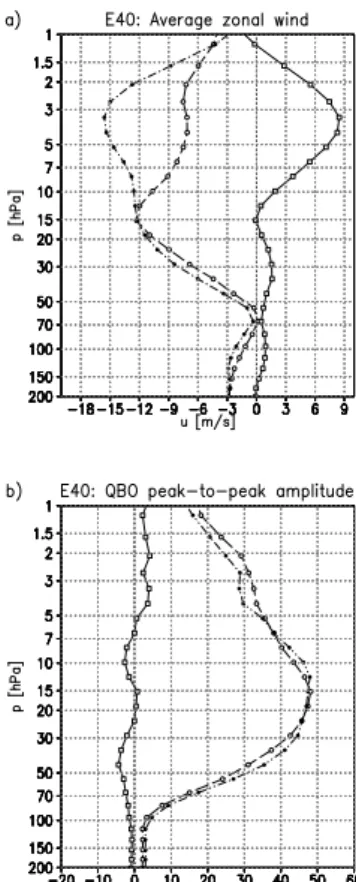
Next, the average annual and zonal mean zonal wind over the two 20-year time
20
periods is computed. Both profiles are shown in Fig. 4a, together with their difference. For both time periods, the average zonal wind is similar up to 15 hPa, easterly in the troposphere, approaches zero in the lower stratosphere around 70 hPa and is easterly above. Above the 15 hPa level, at which the mean zonal wind is –12 m/s, the earlier period has much stronger easterly winds than the later one. At 4 hPa, the difference
25
reaches a maximum of more than 8 m/s. At the top of the stratosphere, the averages approach each other and are equal again at 1 hPa, being easterly at about 5 m/s. A Student’s t-test shows that the difference between the two periods is significant at the 95 % confidence level between 7 and 2 hPa.
ACPD
6, 9259–9271, 2006The QBO in the first and in the second
half of ERA-40 H. J. Punge and M. A. Giorgetta Title Page Abstract Introduction Conclusions References Tables Figures J I J I Back Close Full Screen / Esc
Printer-friendly Version Interactive Discussion
Figure 4b shows the peak-to-peak amplitude of the QBO signal, i.e. the difference between the maximum easterlies and westerlies at each level, in the two 20-year com-posites of Figs. 1b and c and their difference. The figure shows that the strength of the QBO is similar at the beginning and at the end of the ERA-40 record. In the lower stratosphere, the QBO signal in the earlier period is stronger by about 5 m/s. At about
5
5 hPa, this reverses and the QBO of the later time period is stronger by about the same amount. Since the composites consist of only a small number of QBO cycles, these differences are not significant in the sense of a student t test, they can not be distinguished from the natural variability of the cycles.
Figure 4 illustrates that it is the change in the climatology that causes the difference
10
in the QBO composites, while the strength of the QBO remains almost constant.
4 Conclusions
The variability of atmospheric conditions of the equatorial upper stratosphere can not be fully understood from the ERA-40 reanalysis record. The ERA-40 system produces a periodic pattern of the quasi-biennial oscillation which is consistent with the
better-15
observed middle and lower stratospheric QBO from radiosonde observations. How-ever, this study reveales some curiosities – in particular, the earlier part (1960–1979) of ERA-40 shows a QBO in the upper stratosphere that is distinctly different from the one in the later part (1980–1999). Most prominently, a westerly shift of up to 12 m/s is observed in the zonal wind between the two sections. No obvious reason for this was
20
found. At the same time, the QBO amplitude does not change significantly.
Because few or no observations are available for the upper stratosphere region, especially in the earlier years, it is not clear whether our findings are artefacts of the ERA-40 reanalysis system or whether they represent the real state of the atmosphere. The latter explanation would mean that the dynamics of the model is working well,
25
reproducing the climate several levels above where observations were available in the pre-satellite period. In that case, our work indicates there is substantial variability on
ACPD
6, 9259–9271, 2006The QBO in the first and in the second
half of ERA-40 H. J. Punge and M. A. Giorgetta Title Page Abstract Introduction Conclusions References Tables Figures J I J I Back Close Full Screen / Esc
Printer-friendly Version Interactive Discussion
time scales longer than the QBO period. On the other hand, if the findings reflect problems with the reanalysis related to data quality, quantity or assimilation, a care-ful review of the data sources used and the assimilation system is required, which is clearly beyond the scope of this work.
In both cases, there is reason to believe that the later portion of the ERA-40
dis-5
plays the more realistic description of tropical zonal winds, as it is based on more and potentially higher-quality observations, including satellite data since the late 1970s.
Given these findings, care should be taken when using the ERA-40 reanalysis as a reference, e.g. for model development and validation purposes, where zonal wind in the tropical upper stratosphere plays a role. It is likely that the later part of the
10
reanalysis suits better for such purposes. Another outcome of this study is that reliable long term data records from observations are crucial for any statements on interannual atmospheric variability in this region of the atmosphere.
Acknowledgements. This work was supported by the European Community project 505390
SCOUT-O3. The authors thank E. Roeckner for helpful comments.
15
References
Baldwin, M. P., Gray, L. J., Dunkerton, T. J., Hamilton, K., Haynes, P. H., Randel, W. J., Holton, J. R., Alexander, M. J., Hirota, I., Horinouchi, T., Jones, D. B. A., Kinnersley, J. S., Marquardt, C., Sato, K., and Takahashi, M.: The Quasi-Biennial Oscillation, Rev. Geophysics, 39, 179– 229, 2001. 9262
20
Baldwin, M. P. and Gray, L. J.: Tropical stratosphere zonal winds in ECMWF ERA-40 re-analysis, rocketsonde data, and rawinsonde data, Geophys. Res. Lett., 32, L09806, doi: 10.1029/2004GL022328, 2005. 9260,9261
Bengtsson, L., Hodges, K. I., and Hagemann, S.: Sensitivity of the ERA40 reanalysis to the observing system: determination of the global atmospheric circulation from reduced
obser-25
vations, Tellus, 56A, 456–471, 2004. 9261
ACPD
6, 9259–9271, 2006The QBO in the first and in the second
half of ERA-40 H. J. Punge and M. A. Giorgetta Title Page Abstract Introduction Conclusions References Tables Figures J I J I Back Close Full Screen / Esc
Printer-friendly Version Interactive Discussion
Forcing of the Quasi-Biennial Oscillation in the MAECHAM5 Model, J. Climate, 19, 3882– 3901, doi:10.1175/JCLI3830.1, 2006. 9260,9261,9262
Holton, J. R. and Lindzen, R. S.: An updated theory for the quasi-biennial cycle of the tropical stratosphere, J. Atmos. Sci., 29, 1076–1080, 1972. 9262
Pascoe, C. L., Gray, L. J., Crooks, S. A., Juckes, M. N., and Baldwin, M. P.: The
quasi-5
biennial oscillation: Analysis using ERA-40 data, J. Geophys. Res., 110, D08105, doi: 10.1029/2004JD004941, 2005. 9261
Randel, W., Udelhofen, P., Fleming, E., Geller, M., Gelman, M., Hamilton, K., Karoly, D., Ort-land, D., Pawson, S., Swinbank, R., Wu, F., Baldwin, M., Chanin, M. L., Keckhut, P., Labitzke, K., Simmons, E. R. A., and Wu, D.: The SPARC Intercomparison of middle-atmospheric
cli-10
matologies, J. Climate, 17, 986–1003, 2004. 9261
Sterl, A.: On the (In)Homogeneity of Reanalysis Products, J. Climate, 17, 3866–3873, 2004.
9264
Takahashi, M.: Simulation of the stratospheric quasi-biennial oscillation using a general circu-lation model, Geophys. Res. Lett., 23, 661–664, 1996. 9260
15
Uppala, S., Kallberg, P., Hernandez, A., Saarinen, S., Fiorino, M., Li, X., Onogi, K., Sokka, N., Andrae, U., and Bechtold, V. D. C.: ERA-40: ECMWF 45-year reanalysis of the global at-mosphere and surface conditions 1957–2002, ECMWF Newsletter, 101, 2–21, 2004. 9260,
9261
Uppala, S., Kallberg, P., Simmons, A. J., Andrae, U., Bechtold, V. D. C., Fiorino, M., Gibson,
20
J. K., Haseler, J., Hernandez, A., Kelly, G. A., Li, X., Onogi, K., Saarinen, S., Sokka, N., Allan, R. P., Andersson, E., Arpe, K., Balmaseda, M. A., Beljaars, A. C. M., van de Berg, L., Bidlot, J., Bormann, N., Caires, S., Chevallier, F., Dethof, A., Dragosavac, M., Fisher, M., Fuentes, M., Hagemann, S., Holm, E., Hoskins, B. J., Isaksen, L., Janssen, P. A. E. M., Jenne, R., McNally, A. P., Mahfouf, J. F., Morcrette, J. J., Rayner, N. A., Saunders, R. W., Simon, P.,
25
Sterl, A., Trenberth, K. E., Untch, A., Vasiljevic, D., Viterbo, P., and Woollen, J.: The ERA-40 re-analysis, Q. J. R. Meteorol. Soc., 131, 2961–3012, 2005. 9260,9264
ACPD
6, 9259–9271, 2006The QBO in the first and in the second
half of ERA-40 H. J. Punge and M. A. Giorgetta Title Page Abstract Introduction Conclusions References Tables Figures J I J I Back Close Full Screen / Esc
Printer-friendly Version Interactive Discussion
Fig. 1. Composites of the zonal wind QBO in the equatorial stratosphere of the ERA-40
re-analysis, taken at the transition from easterlies to westerlies. The transition at the 10 hPa level takes place at 0 time delay. Composites are computed for(a) the full data set
(Septem-ber 1957–August 2002),(b) January 1960–December 1979 and (c) January 1980–December
ACPD
6, 9259–9271, 2006The QBO in the first and in the second
half of ERA-40 H. J. Punge and M. A. Giorgetta Title Page Abstract Introduction Conclusions References Tables Figures J I J I Back Close Full Screen / Esc
Printer-friendly Version Interactive Discussion
Fig. 2. Composites of the zonal wind QBO of the ERA-40 reanalysis, at the time of east-west
and west-east transitions at 10 hPa. Black solid: 1960–1979 composite east to west, green solid: 1960–1979 composite west to east, blue solid: 1980–1999 composite east to west, red solid: 1980–1999 composite west to east.
ACPD
6, 9259–9271, 2006The QBO in the first and in the second
half of ERA-40 H. J. Punge and M. A. Giorgetta Title Page Abstract Introduction Conclusions References Tables Figures J I J I Back Close Full Screen / Esc
Printer-friendly Version Interactive Discussion
Fig. 3. Composites of the zonal wind QBO of the ERA-40 reanalysis as in Fig. 1, only at the
ACPD
6, 9259–9271, 2006The QBO in the first and in the second
half of ERA-40 H. J. Punge and M. A. Giorgetta Title Page Abstract Introduction Conclusions References Tables Figures J I J I Back Close Full Screen / Esc
Printer-friendly Version Interactive Discussion
Fig. 4. (a) Short dashed: Annual mean equatorial zonal wind of the “1960–”1979 period; Long
dashed: Same for the 1980–1999 period; Black solid: difference between the two periods. (b) QBO peak-to-peak amplitude in the composites of Fig. 1; Short dashed: 1960–1979 period, cf. Fig. 1b; Long dashed: 1980–1999 period, cf. Fig. 1c; Black solid: difference between the two periods. Note the different scales at the abscissae of the two panels.