HAL Id: halshs-01281914
https://halshs.archives-ouvertes.fr/halshs-01281914
Preprint submitted on 3 Mar 2016
HAL is a multi-disciplinary open access archive for the deposit and dissemination of sci-entific research documents, whether they are pub-lished or not. The documents may come from teaching and research institutions in France or abroad, or from public or private research centers.
L’archive ouverte pluridisciplinaire HAL, est destinée au dépôt et à la diffusion de documents scientifiques de niveau recherche, publiés ou non, émanant des établissements d’enseignement et de recherche français ou étrangers, des laboratoires publics ou privés.
Mobilization?
Jean-Louis Combes, Rasmané Ouedraogo
To cite this version:
Jean-Louis Combes, Rasmané Ouedraogo. How Does Inclusive Growth Boost Tax Revenue Mobiliza-tion?. 2016. �halshs-01281914�
C E N T R E D'E T U D E S E T D E R E C H E R C H E S S U R L E D E V E L O P P E M E N T I N T E R N A T I O N A L
SÉRIE ÉTUDES ET DOCUMENTS
How Does Inclusive Growth Boost Tax Revenue Mobilization?
Jean-Louis Combes
Rasmané Ouedraogo
Études et Documents n° 5
February 2016To cite this document:
Combes J.-L., Ouedraogo R. (2016) “How Does Inclusive Growth Boost Tax Revenue Mobilization?”, Études et Documents, n° 5, CERDI.
http://cerdi.org/production/show/id/1789/type_production_id/1 CERDI
65 BD. F. MITTERRAND
63000 CLERMONT FERRAND – FRANCE TEL. + 33 4 73 17 74 00
FAX + 33 4 73 17 74 28
2 The authors
Jean-Louis Combes
Professor, CERDI – Clermont Université, Université d’Auvergne, UMR CNRS 6587, 63009 Clermont-Ferrand, France.
E-mail: J-L.Combes@udamail.fr
Rasmané Ouedraogo
PhD Student in Economics, CERDI – Clermont Université, Université d’Auvergne, UMR CNRS 6587, 63009 Clermont-Ferrand, France.
E-mail: rasmane.ouedraogo@etu.udamail.fr
Corresponding author: Rasmané Ouedraogo
This work was supported by the LABEX IDGM+ (ANR-10-LABX-14-01) within the program “Investissements d’Avenir” operated by the French National Research Agency (ANR).
Études et Documents are available online at: http://www.cerdi.org/ed
Director of Publication: Vianney Dequiedt Editor: Catherine Araujo Bonjean
Publisher: Mariannick Cornec ISSN: 2114 - 7957
Disclaimer:
Études et Documents is a working papers series. Working Papers are not refereed, they constitute
research in progress. Responsibility for the contents and opinions expressed in the working papers rests solely with the authors. Comments and suggestions are welcome and should be addressed to the authors.
3 Abstract
Despite high economic growth in the last decades, many developing countries remain into poverty, income inequality and unemployment of young people, which have led some countries to adopt inclusive growth strategies. In this paper, we show how inclusive growth can boost tax revenue mobilization in developing countries. Effective public policies, improving social cohesion are fundamental to meet citizens’ aspirations and therefore incite them to comply with taxes. To this end, this study uses GMM techniques to deal with endogeneity issue and spans 55 developing countries over the period of 1995-2010. We find that inclusive growth has positive effect on tax revenue mobilization. This finding is robust to various aspects of inclusive growth measurements and additional controls.
Keywords
Inclusive growth; Taxes revenue; Inequality; Employment.
JEL codes
4 1. Introduction
Many countries are recognizing the urgency of enhancing tax resource mobilisation (TRM) in a global climate of economic uncertainty and competition. The global crisis convinced policy-makers in developing countries that the time had come to reduce their dependence on external resources and their vulnerability to external financial shocks by addressing the potential of TRM. TRM at a significant level is essential to solidify ownership over development strategy, and to strengthen the bonds of accountability between governments and their citizens. In effect, DRM provides “policy space” to developing countries which is often constrained under the terms and conditions of external resource providers. According to Mascagni, Moore and Mccluskey (2014), the governments in developing countries need additional financial resources to address the huge development challenges they face. While great progress was made in recent years towards achieving the Millennium Development Goals, a large proportion of people in low-income countries still face poverty, inequality, unemployment of young people, malnutrition, vulnerability to natural disasters and preventable diseases, amongst others. Aid has certainly contributed to alleviating some of these issues, but it is becoming increasingly clear that the development challenge requires increasing tax revenue. Developing countries across the world always suffer from insufficient supply of internal resources. Very low tax to gross domestic product (GDP) ratio is a common characteristic of most of the developing countries. This situation remains contrasted with the high economic growth rates that developing countries have experienced in recent decades. Economic growth is expected to raise people’s income, create job and opportunities and therefore increase the tax base. However, this expectation is sometimes hampered by the absence of straight mathematical relationship between economic growth and the increase in the tax base. Indeed, it must that the benefits of growth to be shared to a large part of the population in order to meet citizens’ aspirations (availability of public goods, reduction of poverty and inequality) and therefore incite them to comply with taxes. Previous literature focused on economic structural characteristics and institutional quality as the main determinants of tax mobilisation and failed to integrate tax payer expectations of government policies and their willingness to pay taxes (see for a review Chelliah 1971, Stotsky and WoldeMariam 1997, Bird, Martinez-Vazquez and Torgler 2008; Haque 2011; Crivelli and Gupta 2014). This papers aims to fill the gap in previous literature by focusing on the effect of inclusive growth on the mobilization of tax revenue. According to Alm et al. (1992), tax compliance increases with (perceptions of) the availability of public goods and services. They suggest that governments can increase
5
compliance by providing goods that citizens prefer in a more efficient and accessible manner, or by more effectively emphasizing that taxes are necessary for the receipt of government services. Accordingly, the main concern of taxpayers is what they get directly in return for their tax payments in the form of public services. Therefore, the implementation of an effective and fair taxation system is essential in order to finance public policies given the fact that there is strong relationship between citizens and the state. According to the concept of resource bargain, the state negotiates resources to finance public policies and the citizens expect in return for their tax payments in the form of public services (Fjeldstad and Semboja 2001; Moore 2004). Then, individuals may pay taxes because they value the goods provided by the government, recognizing that their payments are necessary both to help finance the goods and services and to get others to contribute (Fjeldstad and Semboja 2001). Regarding this theory of fiscal exchange, tax compliance depends on the respect of this contractual relationship and the policies of the government. If the fiscal exchange is enforced, that implies that populations will benefit from growth though government policies. That is what expected with inclusive growth policy. Inclusive growth ensures that the economic opportunities created by growth are available to all-particularly the poor-to the maximum possible extent. The growth process creates new economic opportunities that are unevenly distributed. Inclusive growth means the participation of all in the tangible benefits of economic growth, made possible mainly by job creation that can lead to inequality and poverty reduction. Taxation plays a vital role in promoting citizenship and reciprocal relations between the taxpayer and government. It is about encouraging people to make a contribution for which they receive something in return. In Sierra Leone, for instance, public resistance to the introduction of the Goods and Services Tax in 2009 (which is another name for value added taxes (VAT)) forced the government and its key donors to link the new tax to improved provision of services.
These discussions aforementioned reveal that inclusive growth can boost tax revenue mobilization or tax compliance. This paper aims to study the relationship between inclusive growth and tax revenue mobilization. While a very limited works studied the determinants of inclusive growth (See Anand, Mishra and Peiris, 2013), there is no empirical study that tackles the consequences or the benefits of inclusive growth for developing countries. This paper is attempting to come to grips with the link between inclusive growth and tax revenue mobilization and therefore it seeks to understand how to mobilize resource in order to finance development. No doubts that effective public policies, improving social cohesion and the
6
nexus between revenues and public goods are fundamental to meet the aspirations of the citizens and therefore encourage them to comply with taxes.
Using GMM estimators to deal with endogeneity issue, our results show that inclusive growth has positive impact on tax revenue mobilization. This finding is robust to various controls and alternative measurements of inclusive growth index and the dependent variable.
The rest of the paper is organized as follow. Section 2 presents the measure of the inclusive growth index. Section 3 specifies the empirical strategy and the explanatory variables, while Section 4 presents the results obtained from the estimates. In section 5, we analyze transmission channels through which inclusive growth could affect tax revenue mobilization. Section 6 concludes and draws up some policy recommendations.
2. Measurement of Inclusive growth
The notion of inclusive growth has captured a growing importance in the literature, reflecting the desire to define and measure an index that includes most prominent indicators of long lasting development policies. However, it is noteworthy that there is no consensus on how to define inclusive growth and how to measure it. The definition of inclusive growth originates from the notion of pro-poor growth. The term “inclusive growth” was coined by Kakwani and Pernia 2000) and refers to the notion of participation in and benefitting from growth processes. Therefore, it goes beyond the reduced concept of pro-poor growth that focused on the level and distributions of income outcomes and takes into account non-income outcomes. Since then, there is a battery of works which tried to capture the dimensions of an inclusive growth process and conceptualize the patterns of inclusive growth (See for review Ali and Son 2007, Bhalla 2007, Ianchovichina and Lundstrom 2009, Klasen 2010, McKinley 2010, Rauniyar and Kanbur 2010, Blanke and others 2015). The most common of all these works is that economic growth does not automatically translate into widely shared gains and inclusive growth is mostly referred to poverty alleviation, inequality reduction and employment. In a report on inclusive growth, the Organization for Economic Cooperation and Development (OECD) (2012) identifies three problems that even the record levels of growth of the 1990s and decade of 2000s failed to tackle: poverty, unemployment and inequality. Therefore, inclusive growth has two dimensions: benefit-sharing (inequality and poverty) and participation (employment). The benefit-sharing dimension looks into whether the process led
7
to a decrease in poverty and in income inequality. This segment of the analysis is aligned with the concept of “relative pro-poor growth”, which differs from “absolute pro-poor growth” due to the understanding that, for growth to be pro-poor, poor people’s income must grow faster than that of wealthier people, resulting in a decrease in inequality (Grosse, Harttgen and Klasen 2008). The participation dimension is the second significant dimension in conceptualizing inclusive growth and in differentiating it from pro-poor growth. The participation dimension looks into how the society is involved in the process, given that such involvement is essential for promoting social coherence and for capacity-building, which are crucial for the sustainability of an inclusive growth process. Analyzed in the economic sphere, a participatory process can be thought of as characterized by generating employment for a significant part of a country’s population. Such conceptualization of inclusive growth based on three dimensions is in line with Ramos, Ali and Son (2007), Ramos, Ranieri and Lammens (2013) who attempted to define and measure inclusive growth. Notwithstanding the unconcluded concept of inclusive growth, some authors have tried to measure it. However, likewise the absence of definition, the measurement of inclusive growth is still not settled. Many researchers merely compare trends in economic growth, poverty line, income inequality and social indicators (See Habito 2009) or construct a simple average of indicators (See McKinley 2010, Ramos, Ranieri, and Lammens 2013). However, all of these attempts suffer from serious shortcomings. First, an update to any attribute of a composite index causes the index to be modified and the weights are highly arbitrary and sensitive to the choices of the author. Second, a merely analysis of trends does not give us a sense of how much is growth inclusiveness and then does not give us neither a clear picture nor very much of an idea on how to proceed. In this paper, we follow closely Ali and Son (2007) who attempted to construct inclusive growth index using a macro social mobility function, following the micro literature on income distribution. This measure of inclusive growth is based on a utilitarian social welfare function drawn from consumer choice literature, where inclusive growth depends on two factors: (i) income growth; and (ii) income distribution or employment. More specifically, Ali and Son (2007) propose an income equity index as:
𝑤 =
𝑦∗̅̅̅̅𝑦̅
(1)
Where 𝑤 is the equity index, 𝑦̅ is the average of income or employment rate and 𝑦̅̅̅ ∗ represents inclusive growth.
8
Equation (1) implies that income or opportunities are equitably (inequitably) distributed if 𝑤 is greater (less) than 1. For a completely equitable society, 𝑤 = 1. Rearranging, 𝑦̅∗ = 𝑤 ∗ 𝑦̅.
Inclusive growth requires increasing 𝑦̅∗, which could be achieved by: (i) increasing 𝑦̅ , i.e increasing average income through growth or the average level of opportunities; (ii) increasing the equity index of income or the index of opportunities, 𝑤; or (iii) a combination of (i) and (ii). Differentiating the above equation:
𝑑𝑦̅
∗
= 𝑤 ∗ 𝑑𝑦̅ + 𝑑𝑤 ∗ 𝑦̅ (2)
Where 𝑑𝑦̅∗ measures the change in the degree of inclusive growth. If 𝑑𝑦̅∗ > 0, growth is more inclusive. Equation (2) allows us to decompose inclusive growth into income growth and change in equity or opportunities in the society. The first term in the right side of equation (2) is the contribution of increase in average income (keeping income distribution or average opportunities constant) while the second term is the contribution of changes in the income distribution or job opportunities (keeping the average income or employment rate unchanged). Therefore, inclusive growth depends on the sign and the magnitude of the two terms. It is noteworthy that the two terms can be as well as all positive (growth is inclusive) or negative (growth is not inclusive) or a combination of different signs of the two terms. For this latter case, the inclusiveness of growth will depend on which contribution outweighs the other. To illustrate the evolution of inclusive growth, we rearrange equation (2) as:
𝑑𝑦̅
∗𝑦̅
∗=
𝑑𝑦̅
𝑦̅
+
𝑑𝑤
𝑤
(3)
This transformation decomposes inclusive growth into growth (𝑦̅) and percentage change in equity or opportunities (𝑤).
3. Data and stylized facts
Our dataset includes 55 developing countries, only data availability restricted our sample (see the appendix for a list of countries). As pointed out above, we focus on income inequality and employment. We collect annual data for the period from 1995 to 2010. We define three-year panel data: 1995-1997; 1998-2000; 2001-2003; 2004-2006; 2007-2010. This type of data is preferable to pure time-series or cross-sectional data, as it marries possible inter-temporal
9
dynamics and important cross-country variation. Three-year averaging is, moreover, likely to minimize non-systematic errors in the data. GDP per capita and tax revenue over GDP are from IMF datasets (IFS and World Economic Outlook). Income inequality data refers to Gini index extracted from Standardizing the World Income Inequality Database (SWIID). We take the advantage of a recently-compiled cross-country dataset that distinguishes market (before taxes and transfers) inequality from net (after taxes and transfers) inequality. In this study, we consider the net income inequality index. Gini index is ranged between 0 and 100, with higher values representing high unequal income distribution. To build the indicators of income distribution used in the econometric estimations, we reverse the original indicator of Gini Index by the following formula: Gi,t = (100 − Giniindex)/100. This transformation ranges G
between 0 and 1. On this basis, G increases with the improvement of the distribution of income. As for employment, we extract data from International Labor Organization datasets. We choose as indicator employment to population ratio which is the proportion of a country's population that is employed. Ages 15 and older are generally considered the working-age population. The series is harmonized to account for differences in national data and scope of coverage, collection and tabulation methodologies as well as for other country-specific factors such as military service requirements. The remaining variables include trade openness (import plus exports in percentage of GDP), the share of agriculture value added in percentage of GDP, natural resource rents in percentage of GDP, foreign aid per capita and public expenditures on education over GDP extracted from World Development Indicators database, the World Bank.
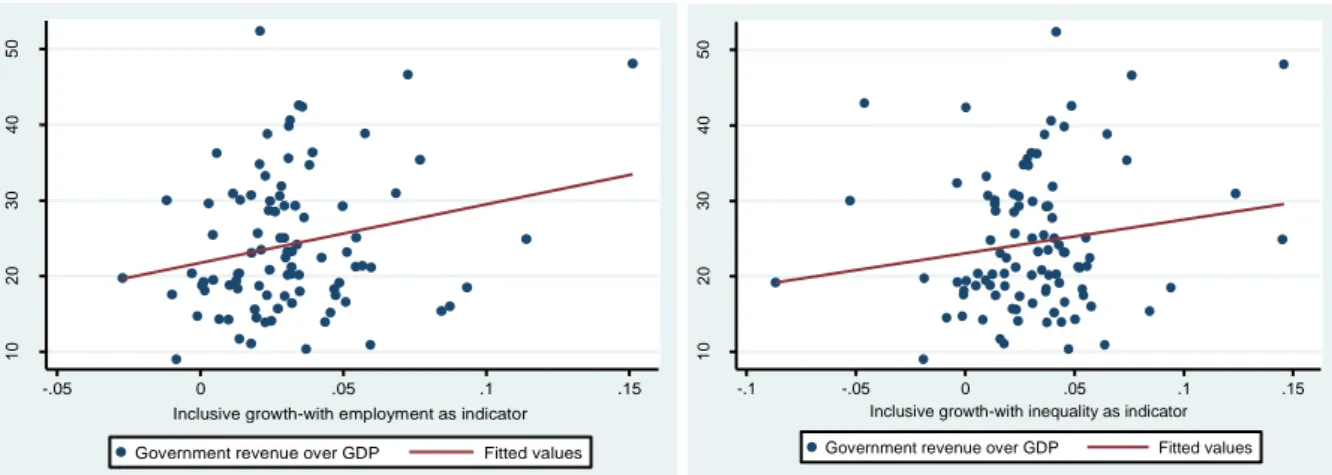
We generate inclusive growth index for each 3-year window. In figure 1, we present the relationship between government revenue over GDP (excluded grants) and inclusive growth defined with respect to income inequality and employment rate. As we can observe, there is strong positive relationship between inclusive growth and government revenue. We will come back with further econometric analysis.
10
Figure 1: Inclusive growth and government revenue, 1995-2010. 4. Econometric model
Given the strong inertia of government revenue, we use a dynamic specification. More specifically, we estimate the following equation:
𝑅𝑒𝑣
𝑖,𝑡=∝ +𝛿𝑅𝑒𝑣
𝑖,𝑡−1+ 𝛽𝐼𝑛𝑐𝑙𝑢
𝑖,𝑡+ 𝜃𝑋′
𝑖,𝑡+ 𝑣
𝑖+ 𝜑
𝑡+ 𝜀
𝑖,𝑡(4)
Where 𝑅𝑒𝑣𝑖,𝑡 represents government revenue for country 𝑖 in time 𝑡, 𝐼𝑛𝑐𝑙𝑢𝑖,𝑡 is inclusive growth, 𝑋′𝑖,𝑡 stands for other explanatory variables. We include 𝑣𝑖 to control for unobservedtime-invariant country-level characteristics that are potentially correlated with government revenue and 𝜑𝑡 to control for time-varying shocks that affect all developing countries.
Inclusive growth is suspected of endogeneity because of omitted variables bias and reverse causality. Indeed, some variables could affect both revenue and inclusive growth. For instance, given the high dependence of developing countries to external conditions, an international crisis may reduce government revenue as well as its ability to achieve its objectives, namely inclusive growth. Furthermore, endogeneity of revenue may be due to reserve causality. For example, a country that experiences high inclusive growth may mobilize taxes, while at the same time government uses mobilized resources to finance its policies and distribute between citizens. To deal with endogeneity issues arising from simultaneity bias and reverse causality, we use GMM estimators which are more suited for dynamic panel data. Apart from endogeneity of government revenue, GMM estimators allow us to correct for endogeneity of all right-hand side variables. There are two GMM estimators commonly used: the difference-GMM estimator (Arellano and Bond, 1991) and the
system-10 20 30 40 50 -.05 0 .05 .1 .15
Inclusive growth-with employment as indicator Government revenue over GDP Fitted values
10 20 30 40 50 -.1 -.05 0 .05 .1 .15
Inclusive growth-with inequality as indicator Government revenue over GDP Fitted values
11
GMM estimator (Arellano and Bover, 1995; Blundell and Bond, 1998). For the difference-GMM estimator, equation (4) is differenced in first order in order to remove country fixed effects, and the first differentiated variables are instrumented by the lagged values of the variables in level. As for the system-GMM estimator, both equations in levels and in first differences are used in a system that allows the use of lagged differences and lagged levels of the explanatory variables as instruments. Therefore, system-GMM estimator is an extension of the difference-GMM estimator. In this paper, our preferred estimator is the system-GMM because it has been highlighted that the lagged values of variables in level as it is done with the difference-GMM estimator are sometimes poor instruments for variables in first differences. To check the validity of the instruments, we use the Hansen test for overidentifying restrictions and Arellano and Bond’s test that investigates that there is no second-order serial correlation in the first-differenced residuals.
Explanatory variables
As for explanatory variables, we estimate our model using factors driving government revenues. In selecting all of these variables, we follow closely the previous literature. More specifically, beyond inclusive growth we include the following variables:
The level of development defined as the log of real GDP per capita “Log(GDPPC”. Indeed, a higher level of development goes together with a higher capacity to pay and collect taxes, as well as a higher relative demand for public goods and services (see Chelliah 1971, Bahl 1971, Tanzi 1987, Gupta 2007, Pessino and Fenochietto 2010).
The share of agriculture value added in percentage of GDP “Agriculture”. It is expected to be negatively associated with tax revenues because the sector is harder to tax (Stosky and WoldeMariam 1997, Gupta 2007, Botlole 2010). Agriculture sector in developing sector is characterized by a large number of small producers who sell their output in informal markets, either to exchange for other goods, or for self-consumption. This coupled with poor or a non-existent book-keeping record makes it notoriously difficult to tax.
Trade openness expressed as imports plus exports in percentage of GDP. Contrary to agriculture sector, trade taxes are easier to collect, especially in developing countries. Therefore, a high degree of openness is expected to generate a higher tax ratio (See Chelliah 1971, Botlhole 2010, Pessino and Fenochietto 2010, Keen and Pery 2013).
12
The total public expenditure on education as percent of GDP and represents the level of education “Education”. Indeed, more educated people can understand better how and why it is necessary to pay taxes. With a higher level of education compliance will be higher. Therefore, it is expected a positive relationship between this variable and the level of tax effort (Pessino and Fenochietto 2010, Keen and Pery 2013).
Total aid per capita “Aid”. Another concern is the potential tax displacement effect of aid. It is often argued that an increase in aid inflows will lower the government’s incentives to increase its tax effort, or even that tax revenues can be reduced due to policy reforms linked to aid flows (McGillivray and Morrissey, 2001). We therefore include foreign aid per capita to control for this potential tax displacement effect of aid.
Natural resource rents in percentage of GDP “natural_rents”. The effect of natural resources on government revenue is ambiguous. Indeed, on the one hand a resource-rich country can generate large taxable surplus (Gupta 2007), while on the other hand natural resources might reduce the incentives of the governments for collecting taxes (Lim 1988 and Martinez-Vazquez 2001).
Quality of governance: We include “polity2” index that measures the degree of democracy in a country. It is widespread that quality of governance is a key factor driving tax mobilization (Gupta 2007, Le, Moreno-Dodson and Bayraktar 2012).
5. Results
5.1 Baseline results
We present here baseline results obtained by using OLS with fixed effects, difference GMM and system GMM. To check the importance of inclusive growth, we report on the one hand the results for the effects of economic growth, income inequality and employment on government revenue and on the other hand the effect of inclusive growth on government revenue. This allows us to compare the results of the two estimates and therefore show how inclusive growth more matters for tax mobilization. Table 1 reports results for the effects of GDP growth, income inequality and employment on government revenue, while Table 2 reports results for inclusive growth. We observe that GDP growth is positively associated with government revenue, while income inequality (except column 8) and employment (except column 12) are not different from zero. However, Table 2 sheds light that the
13
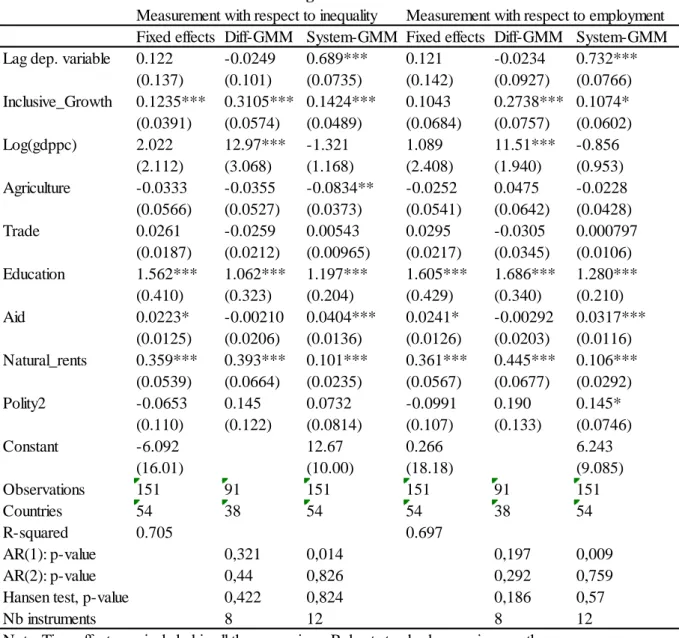
coefficient associated with inclusive growth is strongly positive and significant in all columns (except column 4). Furthermore, this coefficient is high than the one associated to GDP growth in Table 1. Then inclusive growth more matters. In other words, an increase of 1 percent in inclusive growth results in a rise of government revenue ranging between 0.12 and 0.31 percent over GDP. When citizens benefit from growth, they are more likely to comply with tax authorities and this results in an increase of revenue collected by the government. This finding is consistent with the theory of fiscal exchange according to which compliance increases with (perceptions of) the availability of public goods and services. Governments may increase compliance by providing goods that citizens prefer in a more efficient and accessible manner (Alm et al. 1992). By offering new opportunities to all and reducing income inequality, government improves its accountability, increases tax bases and incites citizens to comply with taxes. Furthermore, we observe that the coefficient associated with inclusive growth measured with respect to income inequality is higher than when it is measured with respect to employment. Therefore, it might be thought that inequality reduction brings in more resources to the government than employment promotion.
As for the remaining variables, we observe that the level of education, aid and natural resource rents are positively associated with government revenue, while the agriculture share in percentage of GDP affects negatively government revenue. These findings are consistent with previous works (Stosky and WoldeMariam 1997, Gupta 2007; Bird, Martinez-Vazquez and Torgler 2008).
14
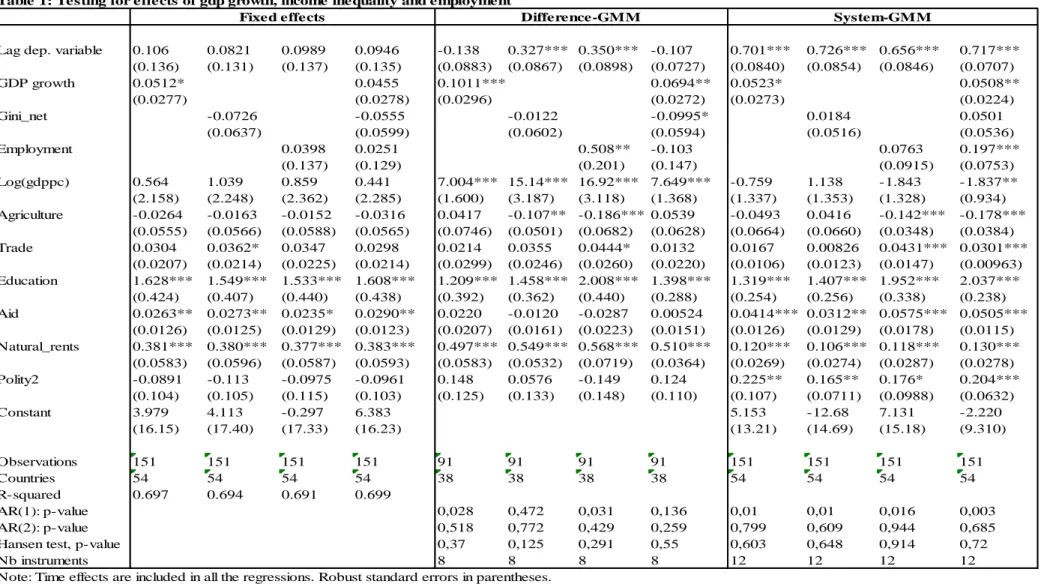
Table 1: Testing for effects of gdp growth, income inequality and employment
Lag dep. variable 0.106 0.0821 0.0989 0.0946 -0.138 0.327*** 0.350*** -0.107 0.701*** 0.726*** 0.656*** 0.717*** (0.136) (0.131) (0.137) (0.135) (0.0883) (0.0867) (0.0898) (0.0727) (0.0840) (0.0854) (0.0846) (0.0707) GDP growth 0.0512* 0.0455 0.1011*** 0.0694** 0.0523* 0.0508** (0.0277) (0.0278) (0.0296) (0.0272) (0.0273) (0.0224) Gini_net -0.0726 -0.0555 -0.0122 -0.0995* 0.0184 0.0501 (0.0637) (0.0599) (0.0602) (0.0594) (0.0516) (0.0536) Employment 0.0398 0.0251 0.508** -0.103 0.0763 0.197*** (0.137) (0.129) (0.201) (0.147) (0.0915) (0.0753) Log(gdppc) 0.564 1.039 0.859 0.441 7.004*** 15.14*** 16.92*** 7.649*** -0.759 1.138 -1.843 -1.837** (2.158) (2.248) (2.362) (2.285) (1.600) (3.187) (3.118) (1.368) (1.337) (1.353) (1.328) (0.934) Agriculture -0.0264 -0.0163 -0.0152 -0.0316 0.0417 -0.107** -0.186*** 0.0539 -0.0493 0.0416 -0.142*** -0.178*** (0.0555) (0.0566) (0.0588) (0.0565) (0.0746) (0.0501) (0.0682) (0.0628) (0.0664) (0.0660) (0.0348) (0.0384) Trade 0.0304 0.0362* 0.0347 0.0298 0.0214 0.0355 0.0444* 0.0132 0.0167 0.00826 0.0431*** 0.0301*** (0.0207) (0.0214) (0.0225) (0.0214) (0.0299) (0.0246) (0.0260) (0.0220) (0.0106) (0.0123) (0.0147) (0.00963) Education 1.628*** 1.549*** 1.533*** 1.608*** 1.209*** 1.458*** 2.008*** 1.398*** 1.319*** 1.407*** 1.952*** 2.037*** (0.424) (0.407) (0.440) (0.438) (0.392) (0.362) (0.440) (0.288) (0.254) (0.256) (0.338) (0.238) Aid 0.0263** 0.0273** 0.0235* 0.0290** 0.0220 -0.0120 -0.0287 0.00524 0.0414*** 0.0312** 0.0575*** 0.0505*** (0.0126) (0.0125) (0.0129) (0.0123) (0.0207) (0.0161) (0.0223) (0.0151) (0.0126) (0.0129) (0.0178) (0.0115) Natural_rents 0.381*** 0.380*** 0.377*** 0.383*** 0.497*** 0.549*** 0.568*** 0.510*** 0.120*** 0.106*** 0.118*** 0.130*** (0.0583) (0.0596) (0.0587) (0.0593) (0.0583) (0.0532) (0.0719) (0.0364) (0.0269) (0.0274) (0.0287) (0.0278) Polity2 -0.0891 -0.113 -0.0975 -0.0961 0.148 0.0576 -0.149 0.124 0.225** 0.165** 0.176* 0.204*** (0.104) (0.105) (0.115) (0.103) (0.125) (0.133) (0.148) (0.110) (0.107) (0.0711) (0.0988) (0.0632) Constant 3.979 4.113 -0.297 6.383 5.153 -12.68 7.131 -2.220 (16.15) (17.40) (17.33) (16.23) (13.21) (14.69) (15.18) (9.310) Observations 151 151 151 151 91 91 91 91 151 151 151 151 Countries 54 54 54 54 38 38 38 38 54 54 54 54 R-squared 0.697 0.694 0.691 0.699 AR(1): p-value 0,028 0,472 0,031 0,136 0,01 0,01 0,016 0,003 AR(2): p-value 0,518 0,772 0,429 0,259 0,799 0,609 0,944 0,685 Hansen test, p-value 0,37 0,125 0,291 0,55 0,603 0,648 0,914 0,72
Nb instruments 8 8 8 8 12 12 12 12
Note: Time effects are included in all the regressions. Robust standard errors in parentheses. The dependent variable is government revenue in percentage of GDP.
***p<0.01, significant at 1% ; **p<0.05, significant at 5%; *p<0.10, significant at 10%
15
5.2 Sensitivity analysis
In this section, we analyze some conditional factors that can affect the positive relationship between inclusive growth and revenue mobilization. To this end, we consider some indicators of policies that a country can pursue to achieve inclusive development. For instance, to improve inclusive growth, developing countries can adopt policies such as building schools and hospitals, training teachers and doctors, providing access to water, sanitation and
Table 2: Baseline results: effect of inclusive growth
Fixed effects Diff-GMM System-GMM Fixed effects Diff-GMM System-GMM
Lag dep. variable 0.122 -0.0249 0.689*** 0.121 -0.0234 0.732***
(0.137) (0.101) (0.0735) (0.142) (0.0927) (0.0766) Inclusive_Growth 0.1235*** 0.3105*** 0.1424*** 0.1043 0.2738*** 0.1074* (0.0391) (0.0574) (0.0489) (0.0684) (0.0757) (0.0602) Log(gdppc) 2.022 12.97*** -1.321 1.089 11.51*** -0.856 (2.112) (3.068) (1.168) (2.408) (1.940) (0.953) Agriculture -0.0333 -0.0355 -0.0834** -0.0252 0.0475 -0.0228 (0.0566) (0.0527) (0.0373) (0.0541) (0.0642) (0.0428) Trade 0.0261 -0.0259 0.00543 0.0295 -0.0305 0.000797 (0.0187) (0.0212) (0.00965) (0.0217) (0.0345) (0.0106) Education 1.562*** 1.062*** 1.197*** 1.605*** 1.686*** 1.280*** (0.410) (0.323) (0.204) (0.429) (0.340) (0.210) Aid 0.0223* -0.00210 0.0404*** 0.0241* -0.00292 0.0317*** (0.0125) (0.0206) (0.0136) (0.0126) (0.0203) (0.0116) Natural_rents 0.359*** 0.393*** 0.101*** 0.361*** 0.445*** 0.106*** (0.0539) (0.0664) (0.0235) (0.0567) (0.0677) (0.0292) Polity2 -0.0653 0.145 0.0732 -0.0991 0.190 0.145* (0.110) (0.122) (0.0814) (0.107) (0.133) (0.0746) Constant -6.092 12.67 0.266 6.243 (16.01) (10.00) (18.18) (9.085) Observations 151 91 151 151 91 151 Countries 54 38 54 54 38 54 R-squared 0.705 0.697 AR(1): p-value 0,321 0,014 0,197 0,009 AR(2): p-value 0,44 0,826 0,292 0,759
Hansen test, p-value 0,422 0,824 0,186 0,57
Nb instruments 8 12 8 12
Note: Time effects are included in all the regressions. Robust standard errors in parentheses. The dependent variable is government revenue in percentage of GDP.
***p<0.01, significant at 1% ; **p<0.05, significant at 5%; *p<0.10, significant at 10%
16
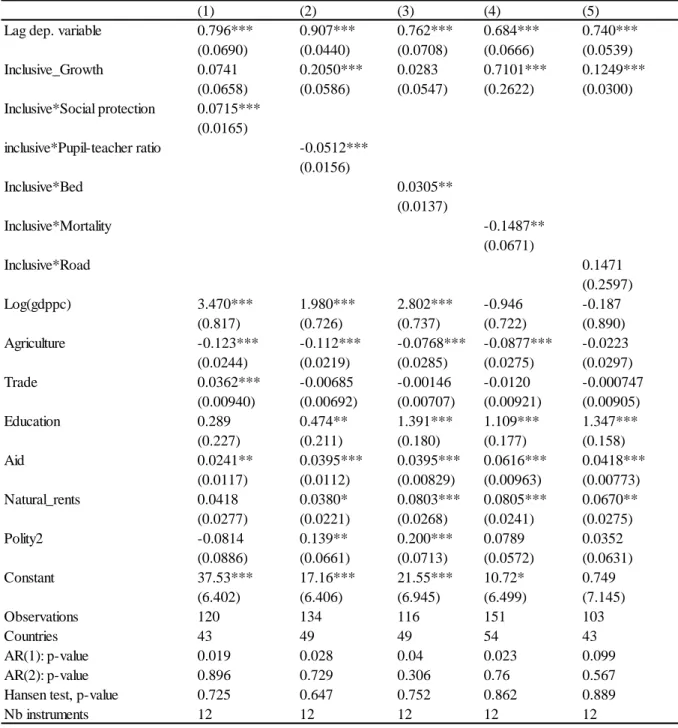
transportation. Therefore, we interact inclusive growth index with the following variables: social protection expenditures; primary school pupil-teacher ratio (the number of pupils enrolled in primary school divided by the number of primary school teachers); the number of hospital beds per 1,000 people; infant mortality rate; and paved roads in percentage of total roads. Results are reported in Table 3.
In the last decade, social protection has emerged as a policy framework employed to address poverty and vulnerability in developing countries. Therefore, social protection has a strong focus on poverty reduction and on providing support to the poorest (de Haan 2000; Barrientos and Hulme 2005). Such policy may reduce inequality and increases tax bases. Table 3 shows that the interaction term with social protection is positive and significant (see column 1). This finding implies that inclusive growth is likely to be most helpful to government revenue when it is combined with social protection.
Developing countries are characterized by low levels of human development (education and health) and their abilities to achieve the Millennium Development Goals (MDGs) require enhanced actions. Education and health have to contend with the lack of teachers, nurses or doctors, with an absence or too little material. To benefit from growth, no doubts that people need access to education and health in order to become effective participants. Investments in the two sectors are visible and citizens can easily assess government actions and then decide their attitudes toward taxation. Results reported in Table 3 highlight that inclusive growth does not contribute to resources mobilization in countries experiencing an increase in pupil-teacher ratio and mortality rate. The interaction terms with the two variables are negative and significant (see columns 2 and 4). However, when governments provide hospital beds, they are likely to incite citizens to pay taxes (see column 3).
17
At last, we consider transportation issue. Developing countries suffer from a severe lack of infrastructure. It is widely acknowledged that the infrastructure deficit is one of the key factors preventing developing countries from realizing its full potential for economic growth and competitiveness in global markets. Infrastructure can affect not only the quantum, but also the spatial distribution of economic activity. For instance, investments in transportation
(1) (2) (3) (4) (5)
Lag dep. variable 0.796*** 0.907*** 0.762*** 0.684*** 0.740***
(0.0690) (0.0440) (0.0708) (0.0666) (0.0539) Inclusive_Growth 0.0741 0.2050*** 0.0283 0.7101*** 0.1249*** (0.0658) (0.0586) (0.0547) (0.2622) (0.0300) Inclusive*Social protection 0.0715*** (0.0165) inclusive*Pupil-teacher ratio -0.0512*** (0.0156) Inclusive*Bed 0.0305** (0.0137) Inclusive*Mortality -0.1487** (0.0671) Inclusive*Road 0.1471 (0.2597) Log(gdppc) 3.470*** 1.980*** 2.802*** -0.946 -0.187 (0.817) (0.726) (0.737) (0.722) (0.890) Agriculture -0.123*** -0.112*** -0.0768*** -0.0877*** -0.0223 (0.0244) (0.0219) (0.0285) (0.0275) (0.0297) Trade 0.0362*** -0.00685 -0.00146 -0.0120 -0.000747 (0.00940) (0.00692) (0.00707) (0.00921) (0.00905) Education 0.289 0.474** 1.391*** 1.109*** 1.347*** (0.227) (0.211) (0.180) (0.177) (0.158) Aid 0.0241** 0.0395*** 0.0395*** 0.0616*** 0.0418*** (0.0117) (0.0112) (0.00829) (0.00963) (0.00773) Natural_rents 0.0418 0.0380* 0.0803*** 0.0805*** 0.0670** (0.0277) (0.0221) (0.0268) (0.0241) (0.0275) Polity2 -0.0814 0.139** 0.200*** 0.0789 0.0352 (0.0886) (0.0661) (0.0713) (0.0572) (0.0631) Constant 37.53*** 17.16*** 21.55*** 10.72* 0.749 (6.402) (6.406) (6.945) (6.499) (7.145) Observations 120 134 116 151 103 Countries 43 49 49 54 43 AR(1): p-value 0.019 0.028 0.04 0.023 0.099 AR(2): p-value 0.896 0.729 0.306 0.76 0.567
Hansen test, p-value 0.725 0.647 0.752 0.862 0.889
Nb instruments 12 12 12 12 12
Note: Time effects are included in all the regressions. Robust standard errors in parentheses. The dependent variable is government revenue in percentage of GDP.
***p<0.01, significant at 1% ; **p<0.05, significant at 5%; *p<0.10, significant at 10%
18
infrastructure may cause some economic activity to shift from the roads areas, as a result of lower transportation. Such investments promote surely inclusive growth by allowing many people to benefit from these infrastructures. Table 3 shows that the interaction term with the percentage of paved roads is not different from zero.
5.3 Robustness checks
To check the validity of our findings we undertake a number of robustness exercises. Note that we reported here results for inclusive growth measured with respect to income inequality. Results for inclusive growth measured with respect to employment are similar and they are reported in appendix.
(i) Testing for additional controls on baseline specification
We add further controls in the baseline specification in order to take into account other variables likely to affect government revenue. These additional controls are terms of trade “TOT”, remittances in percentage of GDP “remittances”, consumer inflation rate “inflation”, public debt in percentage of GDP “debt”, conflict, and natural disaster “disaster”. Results are reported in Table 4.
In first column we control for terms of trade shock1. Given the fact that developing countries are the subject of external shocks, controlling for terms of trade shocks aims to test whether our findings are robust to economic fluctuations. Several studies have found that changes in the terms of trade-the price of exports relative to the price of imports-can account for half of the output volatility in developing countries (Mendoza 1995, Kose 2002 and Broda 2003). Even controlling for these fluctuations, we observe that inclusive growth still affects positively government revenue. Furthermore, the coefficient associated with terms of trade shock is not different from zero.
In column (2), we include migrants’ remittances. Beyond the private use of remittances, they can play a role at macroeconomic level. Indeed, remittances increase recipient endowments and therefore their capacity to pay taxes. Ebeke (2010) shows that remittances significantly increase both the level and the stability of government tax revenue ratio in receiving
1
To measure the shock, we resort to the Hodrick-Prescott (H-P) filter, which generates a smooth trend and stationary deviations. The deviation of terms of trade from its H-P-filtered trend will then capture the shock. We set a smoothing parameter of 6.25.
19
countries. Our results reported in column (2) are consistent with this finding. Moreover, our hypothesis about the effect of inclusive growth on government revenue remains in force.
To ensure that our finding is robust to the Olivera–Tanzi effect, we include inflation rate in column (3). According to Olivera-Tanzi theory, an economic situation involving a period of
(1) (2) (3) (4) (5) (6) (7)
Lag dep. variable 0.814*** 0.790*** 0.829*** 0.853*** 0.787*** 0.797*** 0.806*** (0.0614) (0.0645) (0.0546) (0.0543) (0.0591) (0.0634) (0.0753) Inclusive_Growth 0.1529*** 0.0942** 0.0943*** 0.0825*** 0.1297*** 0.1275** 0.1184* (0.0483) (0.0422) (0.0319) (0.0289) (0.0368) (0.0524) (0.0649) Log(gdppc) -1.735 1.968** 1.062* 1.594** 1.258** -1.034 -0.458 (1.072) (0.950) (0.640) (0.714) (0.636) (0.702) (0.609) Agriculture -0.0717* -0.0642** -0.0238 -0.0248 -0.0321 -0.0279 -0.0125 (0.0421) (0.0307) (0.0216) (0.0254) (0.0300) (0.0393) (0.0406) Trade 0.0172* 0.0292*** 0.00770 -0.00833 0.00118 -0.00836 -0.0101 (0.00937) (0.00826) (0.00698) (0.00952) (0.00912) (0.00969) (0.0102) Education 1.203*** 1.323*** 0.944*** 0.633*** 0.877*** 0.632*** 0.708*** (0.215) (0.233) (0.114) (0.0972) (0.196) (0.189) (0.239) Aid 0.0225* 0.0328** 0.0279** 0.0124 0.0301*** 0.0288** 0.0240* (0.0128) (0.0137) (0.0140) (0.0143) (0.0117) (0.0129) (0.0133) Natural_rents 0.0800*** 0.0934*** 0.0521** 0.0421* 0.0555** 0.0595** 0.0478 (0.0248) (0.0276) (0.0217) (0.0236) (0.0255) (0.0245) (0.0302) Polity2 0.0519 0.154** 0.104* 0.172*** -0.0794 0.148** 0.238*** (0.0799) (0.0630) (0.0595) (0.0478) (0.0544) (0.0643) (0.0864) ToT 0.0766 0.127*** 0.0483 0.00998 0.0742* 0.0216 0.00974 (0.0555) (0.0371) (0.0418) (0.0561) (0.0414) (0.0550) (0.0708) Remittances 0.136*** 0.119** -0.0835 0.128** -0.0512 -0.0524 (0.0521) (0.0563) (0.0576) (0.0508) (0.0658) (0.0711) Inflation 0.00938 0.0230 0.0457 0.0329 0.00122 (0.0324) (0.0349) (0.0385) (0.0327) (0.0423) Conflict 0.624 -1.343 -0.415 0.236 (0.589) (0.895) (0.864) (1.218) Disaster 0.0337 0.0414 -0.00139 (0.0286) (0.0318) (0.0285) GDP_growth -0.0431 0.0191 (0.0284) (0.0375) Gini_net 0.0427 (0.0399) Constant 11.90 13.49 8.127 14.52*** 10.95** 10.51* 4.094 (9.459) (8.825) (4.958) (5.144) (4.867) (5.771) (4.930) Observations 149 148 148 148 148 148 148 Countries 53 52 52 52 52 52 52 AR(1): p-value 0.007 0.008 0.008 0.007 0.008 0.006 0.009 AR(2): p-value 0.589 0.672 0.688 0.597 0.563 0.447 0.617
Hansen test, p-value 0.756 0.862 0.786 0.927 0.955 0.955 0.979
Nb instruments 12 12 13 13 13 14 14
Note: Time effects are included in all the regressions. Robust standard errors in parentheses. The dependent variable is government revenue in percentage of GDP.
***p<0.01, significant at 1% ; **p<0.05, significant at 5%; *p<0.10, significant at 10%
20
high inflation in a country results in a decline in the volume of tax collection and a slow deterioration of real tax proceeds being collected by the government of that country. Table 4 shows that we do not find Olivera-Tanzi effect, while inclusive growth remains important driver of government revenue.
In columns (4) and (5), we include conflict and natural disaster. Indeed, both conflicts and natural disasters destroy economies and dislocate societies and therefore make tax collection difficult. Even controlling for the two types of difficult situations, inclusive growth still affects positively government revenue.
In last columns (6) and (7), we control for GDP growth and income inequality index in order to ensure that our results are not sensitive to these two variables. We find that not only the two variables are not significantly different from zero but also inclusive growth remains strongly significant and positive.
Overall, we conclude that our finding is robust to many additional controls. Then, inclusive growth matters for resource mobilization in developing world through the increase in tax base and the incentive to comply with taxes.
(ii) Testing for alternative main dependent variable
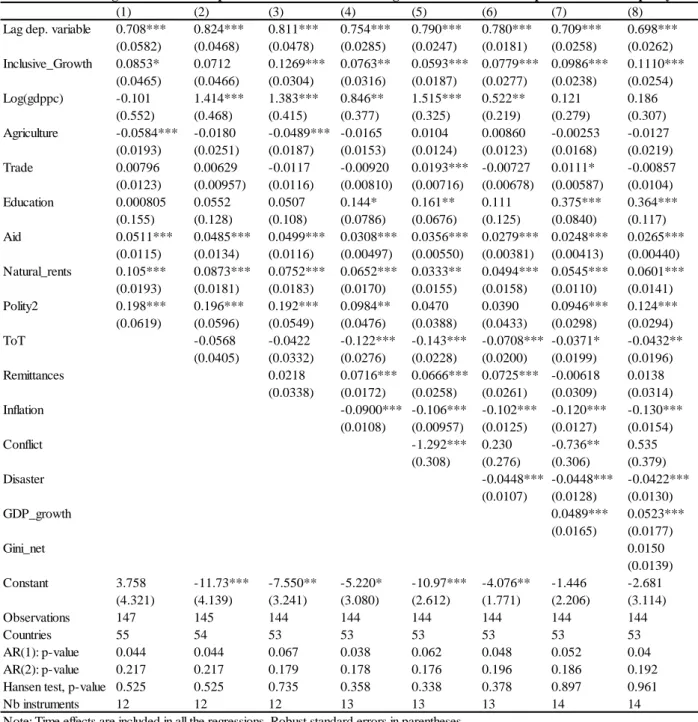
Up to now, we use total government revenue excluded grants as main dependent variable. Government Revenues encompass social contributions (e.g. contributions for pensions, health and social security), taxes other than social contributions (e.g. taxes on consumption, income, wealth, property and capital), and other revenues. Here, we exclusively consider tax revenues in percentage of GDP in order to take into account the real capacity to increase revenue through taxation. Results are reported in Table 5. As we can observe, the coefficients associated with inclusive growth are strongly significant and positive in all columns except columns 2. However, these coefficients are smaller than those of table 2 and 4. This can be due to the exclusion of other sources of revenues. As for the other independent variables, we find an Oliveria-Tanzi effect (see column 4-8), while conflict and natural disasters are negatively associated with tax revenue.
21
(1) (2) (3) (4) (5) (6) (7) (8)
Lag dep. variable 0.708*** 0.824*** 0.811*** 0.754*** 0.790*** 0.780*** 0.709*** 0.698*** (0.0582) (0.0468) (0.0478) (0.0285) (0.0247) (0.0181) (0.0258) (0.0262) Inclusive_Growth 0.0853* 0.0712 0.1269*** 0.0763** 0.0593*** 0.0779*** 0.0986*** 0.1110*** (0.0465) (0.0466) (0.0304) (0.0316) (0.0187) (0.0277) (0.0238) (0.0254) Log(gdppc) -0.101 1.414*** 1.383*** 0.846** 1.515*** 0.522** 0.121 0.186 (0.552) (0.468) (0.415) (0.377) (0.325) (0.219) (0.279) (0.307) Agriculture -0.0584*** -0.0180 -0.0489*** -0.0165 0.0104 0.00860 -0.00253 -0.0127 (0.0193) (0.0251) (0.0187) (0.0153) (0.0124) (0.0123) (0.0168) (0.0219) Trade 0.00796 0.00629 -0.0117 -0.00920 0.0193*** -0.00727 0.0111* -0.00857 (0.0123) (0.00957) (0.0116) (0.00810) (0.00716) (0.00678) (0.00587) (0.0104) Education 0.000805 0.0552 0.0507 0.144* 0.161** 0.111 0.375*** 0.364*** (0.155) (0.128) (0.108) (0.0786) (0.0676) (0.125) (0.0840) (0.117) Aid 0.0511*** 0.0485*** 0.0499*** 0.0308*** 0.0356*** 0.0279*** 0.0248*** 0.0265*** (0.0115) (0.0134) (0.0116) (0.00497) (0.00550) (0.00381) (0.00413) (0.00440) Natural_rents 0.105*** 0.0873*** 0.0752*** 0.0652*** 0.0333** 0.0494*** 0.0545*** 0.0601*** (0.0193) (0.0181) (0.0183) (0.0170) (0.0155) (0.0158) (0.0110) (0.0141) Polity2 0.198*** 0.196*** 0.192*** 0.0984** 0.0470 0.0390 0.0946*** 0.124*** (0.0619) (0.0596) (0.0549) (0.0476) (0.0388) (0.0433) (0.0298) (0.0294) ToT -0.0568 -0.0422 -0.122*** -0.143*** -0.0708*** -0.0371* -0.0432** (0.0405) (0.0332) (0.0276) (0.0228) (0.0200) (0.0199) (0.0196) Remittances 0.0218 0.0716*** 0.0666*** 0.0725*** -0.00618 0.0138 (0.0338) (0.0172) (0.0258) (0.0261) (0.0309) (0.0314) Inflation -0.0900*** -0.106*** -0.102*** -0.120*** -0.130*** (0.0108) (0.00957) (0.0125) (0.0127) (0.0154) Conflict -1.292*** 0.230 -0.736** 0.535 (0.308) (0.276) (0.306) (0.379) Disaster -0.0448*** -0.0448*** -0.0422*** (0.0107) (0.0128) (0.0130) GDP_growth 0.0489*** 0.0523*** (0.0165) (0.0177) Gini_net 0.0150 (0.0139) Constant 3.758 -11.73*** -7.550** -5.220* -10.97*** -4.076** -1.446 -2.681 (4.321) (4.139) (3.241) (3.080) (2.612) (1.771) (2.206) (3.114) Observations 147 145 144 144 144 144 144 144 Countries 55 54 53 53 53 53 53 53 AR(1): p-value 0.044 0.044 0.067 0.038 0.062 0.048 0.052 0.04 AR(2): p-value 0.217 0.217 0.179 0.178 0.176 0.196 0.186 0.192
Hansen test, p-value 0.525 0.525 0.735 0.358 0.338 0.378 0.897 0.961
Nb instruments 12 12 12 13 13 13 14 14
Note: Time effects are included in all the regressions. Robust standard errors in parentheses. The dependent variable is tax revenue in percentage of GDP.
***p<0.01, significant at 1% ; **p<0.05, significant at 5%; *p<0.10, significant at 10%
22 (iii) Testing for alternative measure of inclusive growth
We now change our measure of inclusive growth. So far, we employed Ali and Son (2007)’s methodology to construct inclusive growth index. We test whether our results are robust to an alternative measure of inclusive growth. We follow Ramos, Ranieri, and Lammens (2013) by constructing a composite index combining the data on income inequality and employment rate. We first compute the simple average of the Gini index and employment rate and then we compare to GDP growth within each three-year window. Results reported in Table 6 do not alter our previous findings. In other words, inclusive growth policies have positive effects on tax revenue mobilization.
(1) (2) (3) (4) (5) (6) (7) (8) Lag dep. variable 0.690*** 0.794*** 0.784*** 0.848*** 0.822*** 0.774*** 0.805*** 0.839***
(0.0741) (0.0715) (0.0684) (0.0516) (0.0564) (0.0603) (0.0593) (0.0889) Inclusive_Growth 0.2164*** 0.1610** 0.1376** 0.1810*** 0.1894*** 0.2092*** 0.3107*** 0.3612*** (0.0670) (0.0685) (0.0677) (0.0381) (0.0463) (0.0498) (0.0887) (0.0957) Log(gdppc) -1.248 1.766** 1.708** 1.101* 1.086* -0.683 -0.932 -0.763 (1.015) (0.896) (0.762) (0.584) (0.647) (0.577) (0.730) (0.715) Agriculture -0.0855** -0.0622 -0.0587* -0.0272 -0.0101 -0.0147 -0.0178 6.73e-05 (0.0379) (0.0394) (0.0343) (0.0205) (0.0274) (0.0320) (0.0388) (0.0354) Trade 0.0125 0.0120 0.0262*** 0.00234 -0.0113 -0.00467 -0.00702 -0.0101 (0.00844) (0.00887) (0.00716) (0.00465) (0.00865) (0.00818) (0.00949) (0.00946) Education 1.194*** 1.245*** 1.414*** 1.019*** 0.819*** 0.891*** 0.873*** 0.936*** (0.181) (0.158) (0.191) (0.128) (0.151) (0.194) (0.167) (0.334) Aid 0.0431*** 0.0215* 0.0302** 0.0267** 0.0179 0.0296** 0.0213 0.0143 (0.0121) (0.0128) (0.0128) (0.0110) (0.0128) (0.0116) (0.0143) (0.0123) Natural_rents 0.0992*** 0.0825*** 0.0803*** 0.0302 0.0255 0.0376 0.0293 0.0357 (0.0288) (0.0291) (0.0279) (0.0215) (0.0239) (0.0259) (0.0282) (0.0393) Polity2 0.111 0.0715 0.165*** 0.114*** 0.158*** 0.0667 0.226*** 0.263*** (0.0729) (0.0736) (0.0527) (0.0424) (0.0464) (0.0455) (0.0626) (0.100) TOT 0.106** 0.153*** 0.0552 0.0599 0.0915** 0.0281 0.00632 (0.0512) (0.0424) (0.0352) (0.0481) (0.0427) (0.0507) (0.0596) Remittances 0.137** 0.139*** 0.132** 0.161*** -0.0750 -0.0348 (0.0542) (0.0485) (0.0563) (0.0515) (0.0680) (0.0758) Inflation 0.0116 0.0370 -0.0622* 0.00442 -0.0528 (0.0284) (0.0355) (0.0368) (0.0343) (0.0369) Conflict 0.221 -1.116 -0.194 -0.430 (0.610) (0.964) (0.880) (0.994) Disaster 0.0344 0.0267 0.0221 (0.0279) (0.0304) (0.0287) GDP growth 0.0731** 0.0866*** (0.0366) (0.0306) Gini net 0.0364 (0.0596) Constant 10.99 12.43 11.23 8.467* 10.33** 6.746 9.307 5.576 (8.895) (7.963) (7.339) (4.384) (4.800) (4.707) (5.766) (6.947) Observations 151 149 148 148 148 148 148 148 Countries 54 53 52 52 52 52 52 52 AR(1): p-value 0.012 0.006 0.006 0.007 0.011 0.010 0.011 0.011 AR(2): p-value 0.969 0.589 0.647 0.751 0.688 0.649 0.552 0.489 Hansen test, p-value 0.712 0.642 0.803 0.863 0.946 0.948 0.99 0.996 Nb instruments 12 12 12 13 13 13 14 14 Note: Time effects are included in all the regressions. Robust standard errors in parentheses.
The dependent variable is government revenue in percentage of GDP.
***p<0.01, significant at 1% ; **p<0.05, significant at 5%; *p<0.10, significant at 10%
23 7. Conclusion
In this paper, we estimate the effect of inclusive growth on tax revenue mobilization. Effective public policies, improving social cohesion and the nexus between revenues and public goods are fundamental to meet the aspirations of the citizens and therefore encourage them to comply with taxes. This paper uses GMM techniques to deal with endogeneity issue and covers 55 developing countries over the period of 1995-2010. We found that inclusive growth has a positive effect on tax revenue mobilization. This finding is robust both for inclusive growth measured with respect to income inequality and employment; various additional controls, alternative measure of inclusive growth and the dependent variable. Furthermore, this positive effect works in countries where inclusive growth is associated with social protection and an increase in the number of hospital beds. However, infant mortality rate dampens the gains of inclusive growth. To mobilize sufficient tax revenue for the post-2015 International Development Agenda, our findings are important in terms of policy recommendations. First, we call for the adoption of inclusive development strategies in developing countries that meet citizen needs. Developing country incumbents should improve public services through reforms and promote efficiency, transparency and accountability in the use of public resources in order to ensure social inclusion of people. Employment and combating income inequality should be promoted to allow everyone to participate in society and the economy. Education and health are major sectors which require important investments. Second, concerted efforts should be made to increase tax compliance and therefore mobilize broad mix of resources.
24 References
Ali, I. and H. H. Son (2007). Measuring Inclusive Growth. Asian Development Review, Vol. 24, No. 1, pp.11–31.
Alm, J., G. H. McClelland and W. D. Schulze (1992). Why do people pay taxes? Journal of
Public Economics, 48, 21-38.
Anand, R., S. Mishra and S. J. Peiris (2013). Inclusive Growth: Measurement and determinants. IMF Working Paper WP/13/135.
Arellano, M. and Bond, S. (1991). Some tests of specification for panel data: Monte Carlo evidence and an application to employment equations. Review of Economic Studies, 58, pp. 277–297.
Arellano, M. and Bover, O. (1995). Another look at the instrumental variable estimation of error component models. Journal of Econometrics 68, pp. 29–51.
Bahl, R. (1971). A Regression Approach to Tax Effort and Tax Ratio Analysis. International Monetary Fund Staff Paper: 18, pp. 570-612.
Barrientos, A. and D. Hulme (2005). Chronic poverty and social protection: Introduction.
European Journal of Development Research, Vol. 17, No. 1, March, pp. 1–7.
Bhalla, S. (2007). Incluisve Growth? Focus on Employment. Social Scientist, Vol. 35, No. 7/8: 24–43.
Bird,R. M., Martinez-Vasquez,J. and Torgler,B. (2008). Tax Effort in Developing Countries and High Income Countries: The Impact of Corruption, Voice and Accountability. Economic
analysis & policy. Vol. 38 (No.1 ).
Blanke J., Corrigan G., Drzeniek M., and Samans R. (2015). Benchmarking Inclusive Growth and Development. Discussion Paper, World Economic Forum. Available at
http://www3.weforum.org/docs/WEF_Inclusive_Growth_Development.pdf.
Blundell, R. and Bond, S. (1998). Initial conditions and moment restrictions in dynamic panel data models. Journal of Econometrics, 87(1), pp. 115–143.
Botlhole, T.D. (2010). Tax effort and the determinants of tax ratio in Sub-Sahara Africa. International Conference On Applied Economics – ICOAE 2010. University of Queensland. Brisbane Australia
Broda, C. (2003). Terms of Trade and Exchange Rate Regimes in Developing Countries.
Journal of International Economics, vol. 63(1), 31-58
Chelliah, R. J. (1971). Trends in Taxation in Developing Countries. Staff Papers Vol 18, IMF 1971. (Washington: International Monetary Fund)
Crivelli, E. and S. Gupta. (2014). Resource Blessing, Revenue Curse? Domestic Revenue Effort in Resource-Rich Countries. IMF Working Paper N°14/5. (Washington: International Monetary Fund)
25
De Haan, A. (2000). Introduction: The role of social protection in poverty reduction. In T. Conway, A. de Haan and A. Norton (eds.), Social Protection: New Directions of Donor
Agencies. Department for International Development, London.
Ebeke, H. C. (2010). Remittances, value added tax and tax revenue in developing countries. CERDI, Etudes et Documents, E2010.30
Fjeldstad, O. H. (2001). Taxation, coercion and donors. Local government tax enforcement in Tanzania. The Journal of Modern African Studies, 39, 289-306.
Gupta,S.A. (2007). Determinants of Tax Revenue Efforts in Developing Countries. IMF Working Paper (WP/07/184. Washington D.C.).
Grosse, M., Harttgen, K. and Klasen, S. (2008). Measuring Pro-Poor Growth in Non-Income Dimensions, World Development, Vol. 36, No. 6: 1021–1047.
Habito, C.F. (2009). Patterns of Inclusive Growth in Asia: Insights from an Enhanced Growth-Poverty Elasticity Analysis. ADBI Working Paper Series, No. 145. Tokyo, Asian Development Bank Institute.
Haque, A.A.K.M. (2011). Determinants of low tax efforts of developing countries. Department of Business Law and Taxation, Monash University.
Ianchovichina, E. and Lundstrom, S. (2009). Inclusive Growth Analytics: Framework and Application. Policy Research Working Paper, No. 4851. Washington, DC, World Bank. Keen, M., and V., Perry. (2013). Understanding countries’tax effort. IMF Working Paper N°/13/244 (Washington: International Monetary Fund).
Klasen, S. (2010). Measuring and Monitoring Inclusive Growth: Multiple Definitions, Open Questions, and Some Constructive Proposals. ADB Sustainable Development Working Paper Series, No. 12. Mandaluyong City, Philippines, Asian Development Bank.
Kose, M. Ayhan. (2002). Explaining Business Cycles in Small Open Economies: How Much Do World Prices Matter? Journal of International Economics 56, no. 2: 299-327.
Le, T.M., B. Modeno-Dodson and N. Bayraktar (2012). Tax capacity and tax effort. Extended Cross-Country Analysis from 1994-2009. Policy Research Working Paper 6252, the World Bank.
Lim, D. (1988). Tax Effort and Expenditure Policy in Resource-Rich Countries, Economic development policies in resource rich countries: 128-153.
Martinez-Vazquez, J. (2001). Mexico: An Evaluation of the Main Features of the Tax System. International Studies Program Working Paper Series, International Studies Program, Andrew Young School of Policy Studies, Georgia State University: 56 pages.
Mascagni, G., M., Moore and R., Mccluskey (2014). Tax revenue mobilisation in developing Countries: issues and challenges. European Parliament. Available at
http://www.europarl.europa.eu/activities/committees/studies.do?language=EN
McGillivray, M., and O. Morrissey (2000). Aid illusion and public sector fiscal behaviour. CREDIT Research Paper 00/9, University of Nottingham.
26
McKinley, T. (2010). Inclusive Growth Criteria and Indicators: An Inclusive Growth Index for Diagnosis of Country Progress. ADB Sustainable Development Working Paper Series, No. 14. Mandaluyong City, Philippines, Asian Development Bank.
Mendoza, E. G. (1995). The Terms of Trade, the Real Exchange Rate, and Economic Fluctuations. International Economic Review 36, no. 1 (February): 101-37.
Moore, M. (2004). Revenues, state formation, and the quality of governance in developing countries. International Political Science Review, 25, 297-319.
OECD (2012). Promoting inclusive growth: Challenges and policies. OECD, Paris
Olivera, J. H.G. (1967). Money, Prices and Fiscal Lags: A Note on the Dynamics of Inflation,
Banca Nazionale del Lavoro Quarterly Review, No. 82, pp. 258-268.
Pessino, C., and R. Fenochietto. (2010). Determining Countries’ Tax Effort. Hacienda
Pública Española/Revista de Economía Pública, Vol. 195, pp. 61–68.
Ramos, R.A., Ranieri, R. and Lammens, J.W. (2013). Mapping Inclusive Growth in
Developing Countries. IPC-IG Working Paper, No. 105. Brasília, International Policy Centre for Inclusive Growth.
Rauniyar, G. and Kanbur, R. (2010). Inclusive Development: Two Papers on
Conceptualization, Application, and the ADB Perspective. Mandaluyong City, Philippines,
Asian Development Bank.
Stotsky, J. and WoldeMariam, A. (1997). Tax Effort in SubSaharan Africa. Working Paper 97/107: International Monetary Fund, Washington, DC.
Tanzi, V. (1978): Inflation, Real Tax Revenue, and the Case for Inflationary Finance: Theory with an Application to Argentina, IMF Staff Papers, Vol. 25, No. 3, pp. 417-451.
Tanzi, V (1987). Quantitative Characteristics of the Tax Systems of Developing Countries. In the theory of Taxation for Developing Countries, edited by David New and Nicholas Stern. New York: Oxford University.
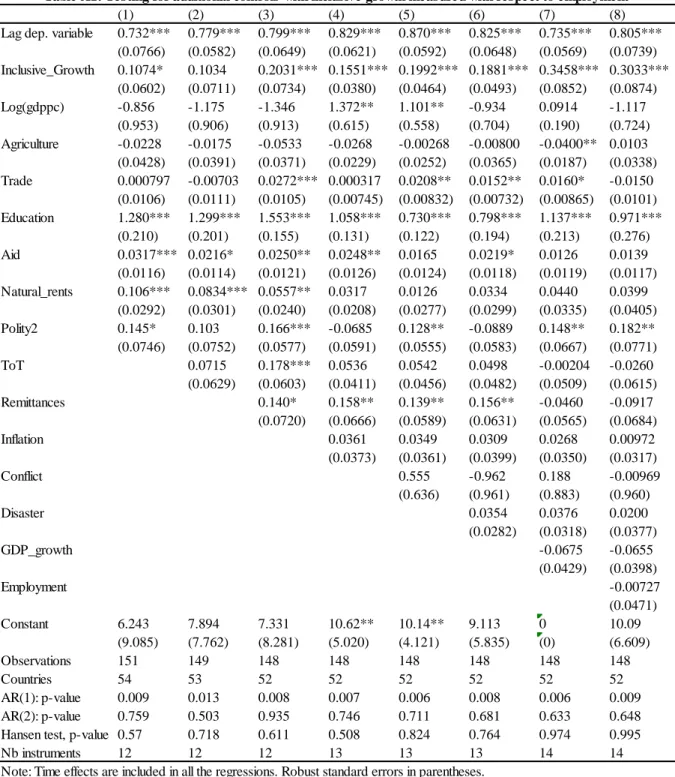
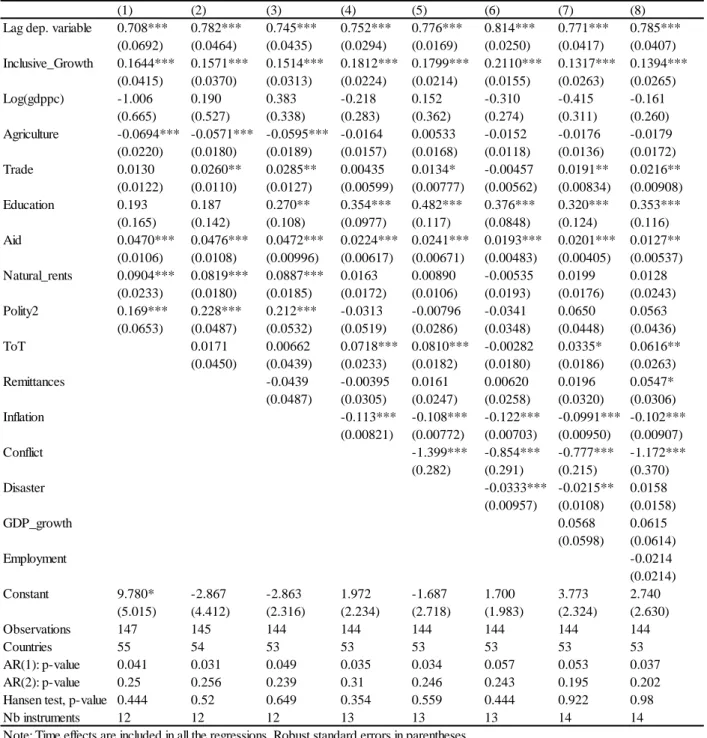
27 Appendix
(1) (2) (3) (4) (5) (6) (7) (8)
Lag dep. variable 0.732*** 0.779*** 0.799*** 0.829*** 0.870*** 0.825*** 0.735*** 0.805*** (0.0766) (0.0582) (0.0649) (0.0621) (0.0592) (0.0648) (0.0569) (0.0739) Inclusive_Growth 0.1074* 0.1034 0.2031*** 0.1551*** 0.1992*** 0.1881*** 0.3458*** 0.3033*** (0.0602) (0.0711) (0.0734) (0.0380) (0.0464) (0.0493) (0.0852) (0.0874) Log(gdppc) -0.856 -1.175 -1.346 1.372** 1.101** -0.934 0.0914 -1.117 (0.953) (0.906) (0.913) (0.615) (0.558) (0.704) (0.190) (0.724) Agriculture -0.0228 -0.0175 -0.0533 -0.0268 -0.00268 -0.00800 -0.0400** 0.0103 (0.0428) (0.0391) (0.0371) (0.0229) (0.0252) (0.0365) (0.0187) (0.0338) Trade 0.000797 -0.00703 0.0272*** 0.000317 0.0208** 0.0152** 0.0160* -0.0150 (0.0106) (0.0111) (0.0105) (0.00745) (0.00832) (0.00732) (0.00865) (0.0101) Education 1.280*** 1.299*** 1.553*** 1.058*** 0.730*** 0.798*** 1.137*** 0.971*** (0.210) (0.201) (0.155) (0.131) (0.122) (0.194) (0.213) (0.276) Aid 0.0317*** 0.0216* 0.0250** 0.0248** 0.0165 0.0219* 0.0126 0.0139 (0.0116) (0.0114) (0.0121) (0.0126) (0.0124) (0.0118) (0.0119) (0.0117) Natural_rents 0.106*** 0.0834*** 0.0557** 0.0317 0.0126 0.0334 0.0440 0.0399 (0.0292) (0.0301) (0.0240) (0.0208) (0.0277) (0.0299) (0.0335) (0.0405) Polity2 0.145* 0.103 0.166*** -0.0685 0.128** -0.0889 0.148** 0.182** (0.0746) (0.0752) (0.0577) (0.0591) (0.0555) (0.0583) (0.0667) (0.0771) ToT 0.0715 0.178*** 0.0536 0.0542 0.0498 -0.00204 -0.0260 (0.0629) (0.0603) (0.0411) (0.0456) (0.0482) (0.0509) (0.0615) Remittances 0.140* 0.158** 0.139** 0.156** -0.0460 -0.0917 (0.0720) (0.0666) (0.0589) (0.0631) (0.0565) (0.0684) Inflation 0.0361 0.0349 0.0309 0.0268 0.00972 (0.0373) (0.0361) (0.0399) (0.0350) (0.0317) Conflict 0.555 -0.962 0.188 -0.00969 (0.636) (0.961) (0.883) (0.960) Disaster 0.0354 0.0376 0.0200 (0.0282) (0.0318) (0.0377) GDP_growth -0.0675 -0.0655 (0.0429) (0.0398) Employment -0.00727 (0.0471) Constant 6.243 7.894 7.331 10.62** 10.14** 9.113 0 10.09 (9.085) (7.762) (8.281) (5.020) (4.121) (5.835) (0) (6.609) Observations 151 149 148 148 148 148 148 148 Countries 54 53 52 52 52 52 52 52 AR(1): p-value 0.009 0.013 0.008 0.007 0.006 0.008 0.006 0.009 AR(2): p-value 0.759 0.503 0.935 0.746 0.711 0.681 0.633 0.648
Hansen test, p-value 0.57 0.718 0.611 0.508 0.824 0.764 0.974 0.995
Nb instruments 12 12 12 13 13 13 14 14
Note: Time effects are included in all the regressions. Robust standard errors in parentheses. The dependent variable is government revenue in percentage of GDP.
***p<0.01, significant at 1% ; **p<0.05, significant at 5%; *p<0.10, significant at 10%
28
(1) (2) (3) (4) (5) (6) (7) (8)
Lag dep. variable 0.708*** 0.782*** 0.745*** 0.752*** 0.776*** 0.814*** 0.771*** 0.785*** (0.0692) (0.0464) (0.0435) (0.0294) (0.0169) (0.0250) (0.0417) (0.0407) Inclusive_Growth 0.1644*** 0.1571*** 0.1514*** 0.1812*** 0.1799*** 0.2110*** 0.1317*** 0.1394*** (0.0415) (0.0370) (0.0313) (0.0224) (0.0214) (0.0155) (0.0263) (0.0265) Log(gdppc) -1.006 0.190 0.383 -0.218 0.152 -0.310 -0.415 -0.161 (0.665) (0.527) (0.338) (0.283) (0.362) (0.274) (0.311) (0.260) Agriculture -0.0694*** -0.0571*** -0.0595*** -0.0164 0.00533 -0.0152 -0.0176 -0.0179 (0.0220) (0.0180) (0.0189) (0.0157) (0.0168) (0.0118) (0.0136) (0.0172) Trade 0.0130 0.0260** 0.0285** 0.00435 0.0134* -0.00457 0.0191** 0.0216** (0.0122) (0.0110) (0.0127) (0.00599) (0.00777) (0.00562) (0.00834) (0.00908) Education 0.193 0.187 0.270** 0.354*** 0.482*** 0.376*** 0.320*** 0.353*** (0.165) (0.142) (0.108) (0.0977) (0.117) (0.0848) (0.124) (0.116) Aid 0.0470*** 0.0476*** 0.0472*** 0.0224*** 0.0241*** 0.0193*** 0.0201*** 0.0127** (0.0106) (0.0108) (0.00996) (0.00617) (0.00671) (0.00483) (0.00405) (0.00537) Natural_rents 0.0904*** 0.0819*** 0.0887*** 0.0163 0.00890 -0.00535 0.0199 0.0128 (0.0233) (0.0180) (0.0185) (0.0172) (0.0106) (0.0193) (0.0176) (0.0243) Polity2 0.169*** 0.228*** 0.212*** -0.0313 -0.00796 -0.0341 0.0650 0.0563 (0.0653) (0.0487) (0.0532) (0.0519) (0.0286) (0.0348) (0.0448) (0.0436) ToT 0.0171 0.00662 0.0718*** 0.0810*** -0.00282 0.0335* 0.0616** (0.0450) (0.0439) (0.0233) (0.0182) (0.0180) (0.0186) (0.0263) Remittances -0.0439 -0.00395 0.0161 0.00620 0.0196 0.0547* (0.0487) (0.0305) (0.0247) (0.0258) (0.0320) (0.0306) Inflation -0.113*** -0.108*** -0.122*** -0.0991*** -0.102*** (0.00821) (0.00772) (0.00703) (0.00950) (0.00907) Conflict -1.399*** -0.854*** -0.777*** -1.172*** (0.282) (0.291) (0.215) (0.370) Disaster -0.0333*** -0.0215** 0.0158 (0.00957) (0.0108) (0.0158) GDP_growth 0.0568 0.0615 (0.0598) (0.0614) Employment -0.0214 (0.0214) Constant 9.780* -2.867 -2.863 1.972 -1.687 1.700 3.773 2.740 (5.015) (4.412) (2.316) (2.234) (2.718) (1.983) (2.324) (2.630) Observations 147 145 144 144 144 144 144 144 Countries 55 54 53 53 53 53 53 53 AR(1): p-value 0.041 0.031 0.049 0.035 0.034 0.057 0.053 0.037 AR(2): p-value 0.25 0.256 0.239 0.31 0.246 0.243 0.195 0.202
Hansen test, p-value 0.444 0.52 0.649 0.354 0.559 0.444 0.922 0.98
Nb instruments 12 12 12 13 13 13 14 14
Note: Time effects are included in all the regressions. Robust standard errors in parentheses. The dependent variable is tax revenue in percentage of GDP.
***p<0.01, significant at 1% ; **p<0.05, significant at 5%; *p<0.10, significant at 10%
29
(1) (2) (3) (4) (5)
Lag dep. variable 0.764*** 0.889*** 0.836*** 0.689*** 0.725***
(0.0526) (0.0432) (0.0615) (0.0575) (0.0614) Inclusive_Growth 0.0893 0.1966*** 0.2415*** 0.05600 0.1064** (0.0782) (0.0741) (0.0935) (0.0452) (0.0414) Inclusive*Social protection 0.0743*** (0.0208) inclusive*Pupil-teacher ratio -0.0737*** (0.0175) Inclusive*Bed 0.0193** (0.0095) Inclusive*Mortality -0.0516*** (0.0149) Inclusive*Road 0.1317 (0.3356) Log(gdppc) 3.318*** 2.224*** -0.872 -1.214 -0.584 (0.999) (0.568) (0.745) (0.833) (0.727) Agriculture -0.133*** -0.0534*** 0.0213 -0.106*** -0.0356 (0.0303) (0.0178) (0.0380) (0.0353) (0.0354) Trade 0.0206*** 0.0141* 0.0235*** -0.000354 -0.000892 (0.00701) (0.00742) (0.00791) (0.00768) (0.0103) Education 0.0408 0.823*** 1.450*** 0.878*** 1.291*** (0.244) (0.193) (0.212) (0.173) (0.158) Aid 0.0334*** 0.0288*** 0.0117 0.0470*** 0.0391*** (0.0120) (0.00807) (0.00925) (0.00701) (0.00847) Natural_rents 0.0756*** 0.0400* 0.0313 0.104*** 0.0659** (0.0207) (0.0211) (0.0209) (0.0231) (0.0264) Polity2 0.0633 0.0855* 0.115 0.136** 0.00642 (0.0530) (0.0505) (0.0706) (0.0688) (0.0667) Constant 35.64*** 17.27*** 4.738 13.18* 5.113 (9.257) (4.568) (6.710) (7.796) (6.200) Observations 120 134 116 151 103 Countries 43 49 49 54 43 AR(1): p-value 0.028 0.044 0.042 0.015 0.086 AR(2): p-value 0.906 0.664 0.792 0.932 0.589
Hansen test, p-value 0.588 0.47 0.704 0.664 0.753
Nb instruments 12 12 12 12 12
Note: Time effects are included in all the regressions. Robust standard errors in parentheses. The dependent variable is government revenue in percentage of GDP.
***p<0.01, significant at 1% ; **p<0.05, significant at 5%; *p<0.10, significant at 10%
30
Table A4: Data sources
code Variable Data sources
Inclusive growth
Inclusive growth measured with respect to income inequality and employment
Author's calculations. Income inequality data are from SWIID (2013) and
employment from ILO datasets Government
revenue
Government revenue in percentage of GDP
IMF database Tax revenue Tax revenue in percentage of
GDP
IMF database
Aid Aid per capita OECD-QWIDS datasets
Natural rents Total natural resources rents (percentage of GDP)
World Development Indicators, the World Bank (2014)
Remittances Remittances in percentage of GDP
World Development Indicators, the World Bank (2014)
GDPPC GDP per capita World Development Indicators, the
World Bank (2014)
Terms trade Terms of trade IMF database
Disaster Natural disaster total damage International disaster database of the Centre for Research on the Epidemiology of Disasters (CRED)
Conflict Conflict. Dummy variable that takes one if the country is in conflict and zero otherwise
Uppsala Conflict Database of the International Peace Research Institute (PRIO)
Trade Imports plus exports in percentage of GDP
World Development Indicators, the World Bank (2014)
Inflation Consumer inflation rate World Development Indicators, the World Bank (2014)
Agriculture Agriculture value added in percentage of GDP
World Development Indicators, the World Bank (2014)
Education Public spending on education in percentage of GDP
World Development Indicators, the World Bank (2014)
Polity2 Polity2 Index Polity4 Project (Integrated Network for
Societal Conflict Research (INSCR) 2013)
Social protection
Social protection expenditures in percentage of GDP
World Development Indicators, the World Bank (2014)
Pupil-teacher ratio
Number of pupils enrolled in primary school divided by the number of primary school teachers
World Development Indicators, the World Bank (2014)
Bed Number of beds per 1,000
people
World Development Indicators, the World Bank (2014)
Mortality Infant Mortality rate World Development Indicators, the World Bank (2014)
Road Paved roads in percentage of total roads
World Development Indicators, the World Bank (2014)
31 Table A5: Samples
Countries
Albania Lesotho
Argentina Madagascar
Armenia Mexico
Burundi Mali
Burkina Faso Mongolia
Bangladesh Mauritius Belarus Malaysia Bolivia Namibia Brazil Niger Bhutan Nicaragua China Nepal Cameroon Pakistan Colombia Panama
Costa Rica Peru
Dominican Republic Philippines
Ecuador Paraguay Egypt Senegal Guatemala El Salvador Indonesia Thailand India Tajikistan Iran Tunisia Jordan Turkey Kazakhstan Tanzania Kenya Uganda
Kyrgyz Republic Ukraine
Cambodia Venezuela