A visual analogue scale for food intake as a screening test for malnutrition in the 1
primary care setting: prospective non-interventional study 2
3
Gwenhaël Bouëtté,1 Maxime Esvan,2 Katharina Apel,1 Ronan Thibault3 4
5 1
Département de Médecine Générale, Univ Rennes, Rennes, France 6
2
Centre d’Investigation clinique, INSERM 1414, CHU Rennes, Univ Rennes, Rennes, France 7
3
Unité de Nutrition, CHU Rennes, INRA, INSERM, Univ Rennes, Nutrition Metabolisms and 8
Cancer, NuMeCan, Rennes, France 9
10
Short title: Malnutrition in the primary care setting 11
12
Correspondence to: 13
Prof. Ronan THIBAULT 14
Unité de Nutrition - Centre labellisé de Nutrition Parentérale à Domicile 15
CHU Rennes 16
2, rue Henri Le Guilloux 17 35000 Rennes 18 France 19 Tél. +33 2 99 28 96 46 20 Fax +33 2 99 28 24 34 21 E-mail ronan.thibault@chu-rennes.fr 22 23
Highlights 24
1. The prevalence of malnutrition as assessed by the GLIM criteria is 4.2% in the primary 25
care setting. 26
2. Screening for malnutrition by assessing food intake is feasible in the primary care setting. 27
3. A score <7 on the ten-point visual analogue scale for food intake SEFI® has a sensitivity of 28
76% and a specificity of 87% for the diagnosis of malnutrition on the basis of the GLIM 29
criteria. 30
ABSTRACT 32
Introduction and aims: The Self-Evaluation of Food Intake (SEFI®) is a simple tool to assess 33
food intake that correlates well with the diagnosis of malnutrition in the hospital setting. 34
Aims: to evaluate the validity of SEFI® for the diagnosis of malnutrition among adults in the 35
primary care setting (primary aim); to assess the prevalence of malnutrition, the feasibility of 36
the SEFI® and the variables associated with malnutrition (secondary aims). Methods: A non-37
interventional prospective study on consecutive patients at three primary care practices. 38
Primary endpoint: confrontation of a SEFI® visual analogue scale score <7/10 with the 39
diagnosis of malnutrition as defined by the Global Leadership Initiative on Malnutrition 40
criteria. Secondary endpoints: the proportion of patients for whom a SEFI® score was 41
collected. Multivariate analysis: threshold α=0.20 in univariate analyses, step-by-step logistic 42
regression. Results: Among 747 eligible patients, 505 were included: mean age (±SD) 56±19 43
yrs, 61% female, 49% presenting with acute medical problems, 15.8% (n=80) with SEFI® 44
score <7/10, and 4.2% (n=21) with malnutrition. The predictive performance of the SEFI® 45
score <7 for the diagnosis of malnutrition was good (AUC=0.82 [95% confidence interval 46
(CI), 0.72-0.92]): sensitivity 76.2% (n=16/21, [58.0-94.4]), specificity 86.8% (n=420/484, 47
[83.8-89.8], positive predictive value 20.0% (n=16/80, [11.2-28.8]), and negative predictive 48
value 98.8% (n=420/425, [97.8-99.8]). The feasibility of the SEFI® 10-point visual analogue 49
scale was 100% (505/505). The variables independently associated with malnutrition were: 50
female gender (odds ratio 4.9 [95% CI, 1.7-14.2], P=0.003), cancer (4.8 [1.4-15.9], P=0.011) 51
and chronic alcohol consumption (7.4 [1.3-41.4], P=0.023).Conclusions. The prevalence of 52
malnutrition was 4.2% in this primary care setting. The SEFI® visual analogue scale for food 53
intake is feasible and could be helpful for the diagnosis of malnutrition in this setting. 54
Keywords: undernutrition; nutritional screening; primary care; general practice; energy 56
intake. 57
INTRODUCTION 59
Malnutrition affects 30–50% of adult patients admitted to hospitals [1,2], and at least 5 % of 60
the French population in the community [3]. An estimated 93% of all those who are 61
malnourished or at risk of malnutrition in the UK live in the community [4]. Malnutrition is 62
associated with increased mortality, morbidity, length of hospital stay, and costs [5]. 63
Malnutrition is underdiagnosed in the community setting [6], although it is associated with 64
increased numbers of consultations with the general physician (GP), and increased costs [7]. 65
Therefore, early detection and treatment of malnutrition are highly warranted to prevent 66
deterioration and malnutrition-related complications. If malnutrition was earlier and better 67
diagnosed by the GP, it would enable the implementation of early nutritional outpatient care 68
and could therefore reduce the prevalence of malnutrition in primary care and, in turn, at 69
hospital admission. 70
The Malnutrition Universal Screening Tool (MUST) [8], or, for older people >70 years, the 71
Mini Nutritional Assessment-short form (MNA-SF) [9] or DETERMINE [10], can be used to 72
screen for malnutrition in the primary care setting. However, except for the MNA-SF which is 73
designed for older people, these tools have never been deployed in France. Therefore, there is 74
a need to validate tools that could be reliable for malnutrition screening in all categories of 75
patients. 76
The assessment of dietary energy intake is a key part of nutritional assessment [11-13]. This 77
statement was backed up by the 2018 international consensus for malnutrition diagnosis by 78
The Global Leadership Initiative on Malnutrition (GLIM) [13]: reduced food intake is now 79
one of the top five criteria to diagnose malnutrition [13], together with body mass index 80
(BMI), weight loss, loss of muscle mass, and inflammatory conditions. To assess food intake, 81
the GLIM advocated the use of semi-quantitative methods [13], as in the NutritionDay® 82
survey [14]. In 2009, we showed that a 10-point visual analogue scale of food intake was 83
feasible, easy to use, and correlated well with daily energy intake, especially among 84
malnourished patients, for both in- and out-patients [15]. Since then, these results have been 85
confirmed by an independent study conducted among 1762 medical oncology patients [16]. 86
Indeed, a 10-point visual analogue scale such as that included in the SEFI® could be useful to 87
detect the risk of malnutrition, defined by the nutritional risk index (NRI) [15] when the score 88
is below 7. The accuracy of a 10-point visual analogue scale in diagnosing malnutrition as 89
defined by the GLIM diagnostic criteria has never been assessed. The prevalence of 90
malnutrition as defined by the GLIM criteria in primary care practice is not known. Little is 91
known regarding the variables associated with malnutrition in primary care. 92
Therefore, the main aim of this prospective non-interventional study was to evaluate the 93
accuracy of the 10-point visual analogue scale included in the SEFI® for the screening of 94
malnutrition among adults consulting their GP. The secondary aims were to assess: i) the 95
prevalence of malnutrition, ii) the feasibility of the SEFI®10-point visual analogue scale for 96
assessing food intake, and iii) the variables associated with malnutrition in primary care. 97
98
PATIENTS AND METHODS 99
Study design and patient selection 100
This was a prospective, non-interventional, cross-sectional study. The patients were 101
consecutively recruited from January 22 to April 13, 2018, by one investigator (GB) in three 102
general medicine practices in the regional area of Rennes, Brittany, France. The inclusion 103
criteria were: adult patients presenting for the 1st time, and who agreed to participate in the 104
study. The exclusion criteria were: pregnancy, taking diuretics, having undergone bariatric 105
surgery, cognitive disorders, and inability to be weighed or interviewed. The study protocol 106
#2017-A03172-51 was approved by the Ethics Committee of CPP Ile-de-France VI, Paris, 107
France, on December 13, 2017 (decision #85-17). As this study was considered to be based on 108
routine practice and was non-interventional, informed consent and ‘Commission Nationale de 109
l’Informatique et des Libertés’ agreement was not required by French law. The study protocol 110
was registered under the name of GEN-EPA at ClinicalTrials.gov: #NCT03555461. 111
112
The assessment of food intake using the Simple Evaluation of Food Intake (SEFI®) 113
The SEFI® (www.sefi-nutrition.com, Knoë, le Kremlin Bicêtre, France) is approved by the 114
‘Société Francophone de Nutrition Clinique et Métabolisme (SFNCM)’ for assessing food 115
intake [17], and is available in English, Dutch and French (for photographs and details, see 116
https://www.sefi-nutrition.com/?lang=en). The SEFI® is simple to use and assesses food 117
intake using two different procedures: a 10-point visual analogue scale, which was used in 118
this study, and a visual assessment of food portions according to the NutritionDay® survey 119
[14] (not used in this study). Questioning for the administration of the 10-point visual 120
analogue scale was performed in French. The patient was asked to move a cursor on the 121
SEFI® visual scale to answer the question: "how much do you eat at the moment?", ranging 122
from "nothing at all" (far left side of the scale) to "as usual" (far right side of the scale). The 123
result, between 0 and 10, is shown on the reverse side of the ruler. As shown in a previous 124
study [15], the SEFI® visual analogue scale is considered positive, i.e. indicating 125
malnutrition, if the score is below 7. 126
127
Data collected 128
Data was collected prospectively on all subjects during the medical consultation. Part of this 129
information was used to diagnose malnutrition according to the GLIM criteria [13]. In 130
addition to the SEFI®, weight and height were measured, and body mass index was 131
calculated; patients were interviewed on their previous weight, and weight loss within the past 132
6 months or beyond 6 months were calculated. Age, gender, marital status (living alone or in a 133
couple), dependency, alcohol consumption, tobacco use, socio-professional status (according 134
to the French National Institute for Statistics and Economic Studies (INSEE): 135
https://www.insee.fr/fr/information/2497952), universal health cover status, and reason for 136
consultation were also recorded. To assess the variables associated with malnutrition in 137
general medicine, information regarding other well-known risk factors for malnutrition [18] 138
was collected: previous history of GI surgery, current cancer treatment, chronic organ 139
insufficiency, intestinal malabsorption, chronic infection or inflammation, diabetes, 140
psychiatric disorders, polymedication, and cognitive disorders. 141
142
Study endpoints 143
The primary endpoint was the presence or absence of malnutrition according to a SEFI® 144
visual analogue scale score <7 vs ≥ 7/10 set against the prevalence of malnutrition as defined 145
by the GLIM criteria [13]: the proportion of patients with at least one phenotypic criterion and 146
at least one etiological criterion. Phenotypic criteria: body mass index<20 (or <22 if age ≥70 147
years), or weight loss >5% within the past 6 months or >10% beyond 6 months; etiological 148
criteria: reduced food intake defined by SEFI® score <7 or reduced food assimilation 149
(malabsorption or previous history of GI surgery), or chronic disease-related inflammation 150
(cancer or chronic organ insufficiency). The "acute disease/injury" criterion was not used, as 151
it is not appropriate for a community-dwelling cohort. The secondary endpoints were: the 152
proportion of patients for whom a SEFI® score was collected, the prevalence of malnutrition, 153
and the factors associated with malnutrition. 154
155
Statistical analysis 156
As the study was designed before the publication of the GLIM criteria in January 2018, the 157
sample size was calculated according to the following diagnostic criteria for malnutrition: 158
weight loss >5% within the past 6 months or >10% beyond 6 months, and/or body mass index 159
(BMI) <20 or <22 if age ≥70 yrs, and with the hypothesis of a sensitivity of the SEFI® visual 160
analogue scale for the diagnosis of malnutrition of 90% and a minimum confidence interval of 161
75%. To reach a minimum power of 80% and a minimum alpha risk of 5%, 45 patients with 162
malnutrition were needed [19,20]. With an expected prevalence of malnutrition of 8% in this 163
population of patients presenting to general medical practice, 563 patients should be included. 164
Since the observed malnutrition prevalence based on the above criteria was 11.9% 165
(n=60/505), we decided to stop patient enrolment before reaching the hypothesized population 166
of 563 patients. 167
Qualitative variables are reported as n (%) and compared using Chi2 (K) or Fisher (F) tests. 168
Quantitative variables are reported as mean ± standard deviation and compared using Student, 169
Mann-Whitney or Wilcoxon tests. The Receiver Operating Characteristic (ROC) curve was 170
used to assess the predictive performance of the SEFI® compared to the reference test, the 171
GLIM criteria for malnutrition diagnosis, and to determine the optimal threshold value for the 172
test using the Youden index (Y = Sensitivity + Specificity - 1). The power of discrimination 173
of the area under the ROC curve (AUC), i.e. the performance of the test, was determined 174
according to the following classification: 0.90≤AUC≤1.00, excellent; 0.80≤AUC<0.90, good; 175
0.70≤AUC<0.80, moderate; 0.60≤AUC<0.70, poor; 0.50≤AUC<0.60, none. Sensitivity,
176
specificity, positive and negative predictive values, and their 95% confidence interval (95% 177
CI), were calculated. The feasibility of the SEFI® visual analogue scale was defined as the 178
proportion of patients included for whom a score was collected. Univariate and multivariate 179
logistic regressions were performed to identify the variables associated with malnutrition. A 180
multivariate logistic regression adjusted on the factors with a P value of <0.2 in the univariate 181
analysis was performed with a backwards stepwise process eliminating all variables that did 182
not contribute (P value ≥0.05). Otherwise the significance threshold was 0.05 for all analyses. 183
All the statistical analyses were carried out with SAS software, version 9.4. 184
185
RESULTS 186
Patient enrolment and characteristics 187
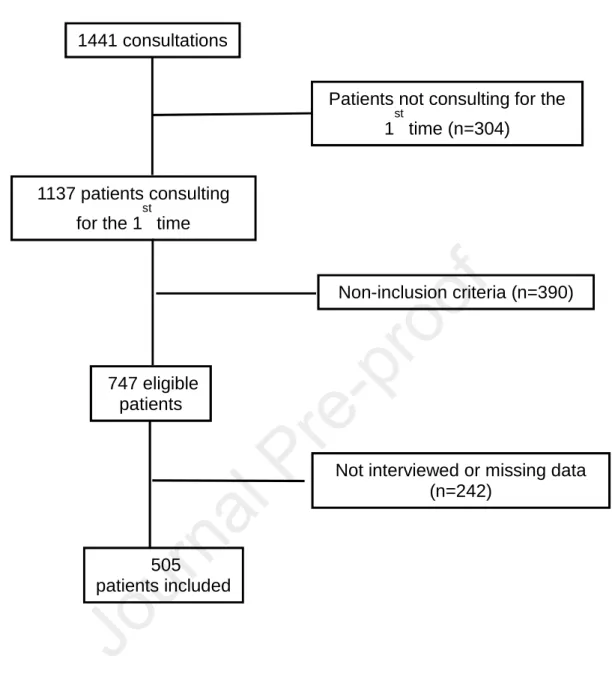
The study flow-chart is provided in Figure 1. Among 747 eligible patients, a total of 505 188
patients were included. Among these 80 patients had a SEFI® score <7/10 (15.8%) and 21 189
patients (4.2%) were malnourished according to the GLIM criteria. The patient characteristics 190
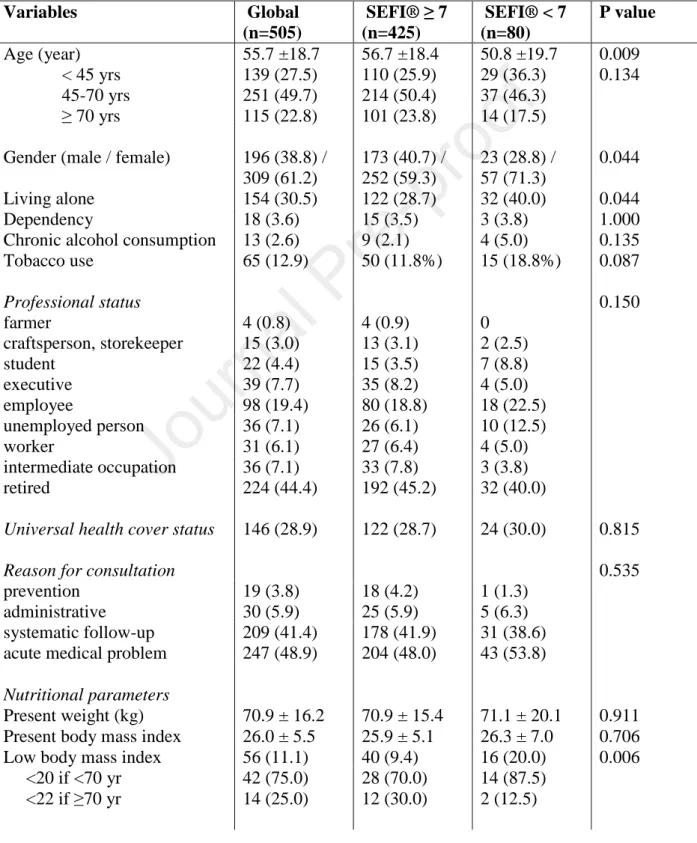
are summarized in Table 1. Patients reaching a SEFI® score <7 were significantly younger, 191
more often female, more frequently living alone and with a previous history of GI surgery or 192
psychiatric disorders. 193
194
Accuracy and feasibility of the 10-point visual analogue scale for the screening of 195
malnutrition. 196
The area under the ROC curve showing the performance of a SEFI® visual analogue scale 197
score <7 (the optimal threshold) for the diagnosis of malnutrition is 0.822 (95% confidence 198
interval (CI), 0.721-0.923), indicating good predictive performance (Figure 2). As shown in 199
Table 2, the sensitivity of the SEFI® visual analogue scale for the diagnosis of malnutrition is 200
76.2% (n=16/21, 95% CI, 58.0-94.4), the specificity is 86.8% (n=420/484, 95% CI, 83.8-201
89.8), the positive predictive value is 20.0% (n=16/80, 95% CI, 11.2-28.8), and the negative 202
predictive value is 98.8% (n=420/425, 95% CI, 97.8-99.8). The feasibility of the SEFI® 10-203
point visual analogue scale was 100% (505/505). 204
205
Variables associated with malnutrition. 206
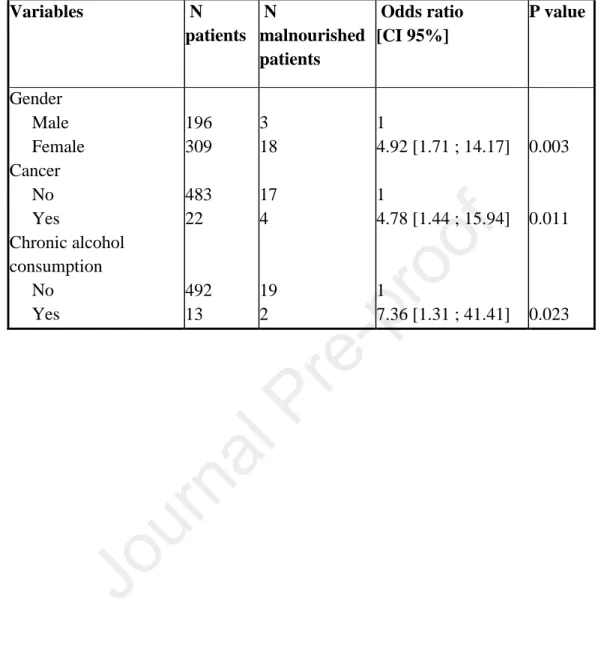
Univariate analysis of the variables associated with malnutrition is shown in Table 3. In 207
multivariate analysis, female gender, cancer, and chronic alcohol consumption were 208
independently associated with malnutrition (Table 4). 209
210
DISCUSSION 211
In the primary care setting, the SEFI® 10-point visual analogue scale for food intake had 76% 212
sensitivity, 87% specificity and 99% negative predictive value for the diagnosis of 213
malnutrition based on the GLIM criteria [13], and it is feasible for use. Thus, it could be 214
helpful for the diagnosis of malnutrition. The prevalence of malnutrition according to the 215
GLIM criteria in the primary care setting was 4.2%. 216
To our knowledge, our study is the first to assess the prevalence of malnutrition in the general 217
practice primary care setting. The early diagnosis of malnutrition in this setting is of utmost 218
importance, since malnutrition is associated with increased morbidity, mortality, and costs via 219
more medication and GP consultation requirements [7]. Although the international societies 220
recommend early, systematic identification of malnutrition at admission to hospital [8], in 221
geriatric institutions [21] and by GPs [22-23], malnutrition attracts little attention in the 222
community setting [6]. Yet if malnutrition was better diagnosed in the community, it would 223
enable early implementation of ambulatory nutritional care, and it could thereby reduce the 224
prevalence of malnutrition in the community and at hospital admission. It could thus 225
contribute to reducing malnutrition-related complications, such as infections, pressure sores, 226
delayed healing, or hospital readmissions. Health policies aiming to improve malnutrition 227
management in our health care system should necessarily start by greater involvement of 228
community practice healthcare professionals (GPs, nurses, dieticians etc.) in the malnutrition 229
screening process and the provision of nutritional care [6]. As already reported for the MUST 230
[8], our study suggests that the SEFI® 10-point visual analogue scale, a simple and easy-to-231
use tool, could be used in the general practice setting. 232
The GLIM consensus has reinforced the value of assessment of food intake in the diagnosis of 233
malnutrition [13]. As more than two thirds of hospitalized patients report decreased food 234
intake [24], and as insufficient food intake is the main cause of malnutrition, identifying 235
patients who are not eating enough is an effective way to diagnose malnourished patients. As 236
the GLIM advises, the use of semi-quantitative methods to assess food intake, and the use of 237
10-point visual analogue scales, such as the SEFI®, could meet this need. Among 114 adult 238
in- and out- patients either malnourished or at risk of malnutrition, a strong correlation was 239
found between the score on a 10-point visual analogue scale and the daily energy intake 240
assessed using the 3-day dietary record [15]. The use of a 10-point visual analogue scale 241
clearly saves time compared to a 3-day dietary record, potentially diagnosing malnutrition and 242
implementing an earlier and more timely malnutrition management plan. In addition the 10-243
point visual analogue scale could help identify hospitalized patients at risk for malnutrition, 244
since 81% of patients with scores <7 are at high nutritional risk according to Nutritional Risk 245
Index [15]. Here we show that the SEFI® 10-point visual analogue scale for food intake could 246
also be feasible and helpful for the diagnosis of malnutrition as defined by the GLIM criteria 247
in the primary care setting. As specificity is higher than sensitivity, the SEFI® 10-point visual 248
analogue scale for food intake may have a better predictive performance to identify the 249
patients who are not malnourished. 250
Another semi-quantitative method for assessing food intake is the assessment of the 251
consumed food portions as proposed in the NutritionDay® survey [14]. Using this method, a 252
correlation between reduced food intake and low BMI has already been reported [25]. 253
Although this could be also done using the SEFI®, consumed food portions were not assessed 254
in this study because the assessment of consumed food portions is more suited to the hospital 255
setting, where the health-care staff, e.g. nursing assistants, could directly observe the food 256
consumed when clearing the meal tray, as in the NutritionDay® [14]. In addition, we selected 257
patients expected to have no disability (e.g. without any cognitive disorders) thus able to 258
respond on the visual analogue scale. Therefore, the feasibility of the 10-point visual analogue 259
scale was 100%. We are now undertaking a prospective study to assess the validity of 260
consumed food portions for the diagnosis of malnutrition among older people with cognitive 261
disorders living in a nursing home. Independently from malnutrition status, decreased food 262
intake has been associated with increased mortality [14,26]. Our cross-sectional study was not 263
however designed to assess whether malnutrition could be associated with increased 264
complications in the primary care setting. 265
There are a few limitations to be noted. First, as the study was designed before the publication 266
of the GLIM criteria [13], body composition assessment was not used to diagnose 267
malnutrition. Second, the low positive predictive value evidenced here could be explained by 268
a recruitment bias related to having performed this study in the general practice setting; 269
indeed, among younger patients with acute GI or ENT infections, the decreased food intake is 270
usually only observed for a few days and neither leads to nor is associated with malnutrition. 271
Third, it can also be noted that although we did not include the number of patients planned 272
from the sample size calculation, it is not likely to have led to substantial bias, as we recruited 273
more malnourished patients than expected. Finally, our study was not designed to compare the 274
validity of the SEFI® compared to other validated malnutrition screening tools, such as 275
MUST [8], or those designed for older people, MNA-SF [9] or DETERMINE [10]. 276
In conclusion, the prevalence of malnutrition according to the GLIM criteria was 4.2% in our 277
study in general primary care practice. The SEFI® visual analogue scale for food intake is 278
feasible and can be helpful for the diagnosis of malnutrition. More studies are needed to 279
evaluate whether dedicated nutritional interventions based on earlier diagnosis and 280
management of malnutrition in the primary care setting could have an impact on the 281
prevalence of malnutrition at hospital admission, and therefore could reduce malnutrition-282
related complications and healthcare costs. 283
284
Statement of authorship 285
All authors have made substantial contributions: GB and RT conceived and designed the 286
study, analysed and interpreted the data, and drafted the article; GB collected the data; ME 287
analysed the data; KA designed the study. All authors approved the final version. 288
289
Conflict of interest statement 290
Ronan Thibault designed and received royalties for the Simple Evaluation of Food Intake® 291
(SEFI®) (Knoë, le Kremlin Bicêtre, France). The other authors declare no conflict of interest 292
related to this article. 293
294
Acknowledgements 295
We sincerely thank ‘Cabinet médical des Rosiers’, Acigné, France, Dr Le Vagueres, Dr 296
Godard, Berné, France, and Dr Berthier, Languidic, France, for their help in the performance 297
of the study. 298
References 300
[1] Naber THJ, Schermer T, de Bree A, Nusteling K, Eggink L, Kruimel JW, et al. Prevalence 301
of malnutrition in nonsurgical hospitalized patients and its association with disease 302
complications. Am J Clin Nutr 1997;66:1232–9. 303
[2] Mc Whirter JC, Pennington CR. Incidence and recognition of malnutrition in hospital. Br 304
Med J 1994;308:945–8. 305
[3] Beau P. Epidémiologie de la dénutrition chez le malade hospitalisé. Traité de nutrition 306
artificielle de l’adulte, 3e édition. Paris : éditions Springers, 2006. Chap 80 : 1093-102 307
[4] Advisory group on malnutrition, led by British Association for Parenteral and Enteral 308
Nutrition. Combating malnutrition: recommendations for action. Available on line at, 309
http://www.bapen.org.uk/pdfs/reports/advisory_group_report.pdf; 2009 [Last accessed Dec 310
09, 2019]. 311
[5] Norman K, Pichard C, Lochs H, Pirlich M. Prognostic impact of disease-related 312
malnutrition. Clin Nutr 2008;27:5-15. 313
[6] Murphy J, Mayor A, Forde E. Identifying and treating older patients with malnutrition in 314
primary care: the MUST screening tool. Br J Gen Pract 2018;68:344-345 315
[7] Guest JF, Panca M, Baeyens JP, de Man F, Ljungqvist O, Pichard C, et al. Health 316
economic impact of managing patients following a community-based diagnosis of 317
malnutrition in the UK. Clin Nutr 2011;30:422-9. 318
[8] Stratton RJ, Hackston A, Longmore D, Dixon R, Price S, Stroud M, et al. Malnutrition in 319
hospital outpatients and inpatients: prevalence, concurrent validity and ease of use of the 320
'malnutrition universal screening tool' ('MUST') for adults.Br J Nutr 2004;92:799-808. 321
[9] Guigoz Y, Lauque S, Vellas BJ. Identifying the elderly at risk for malnutrition. The Mini 322
Nutritional Assessment. Clin Geriatr Med 2002;18:737‑57. 323
[10] Wei K, Nyunt MS, Gao Q, Wee SL, Yap KB, Ng TP. Association of Frailty and 325
Malnutrition With Long-term Functional and Mortality Outcomes Among Community-326
Dwelling Older Adults: Results From the Singapore Longitudinal Aging Study 1. JAMA 327
Netw Open 2018;1(3):e180650. 328
[11] Baker JP, Detsky AS, Wesson DE, Wolman SL, Stewart S, Whitewell J, et al. Nutritional 329
assessment: a comparison of clinical judgment and objective measurements. N Engl J Med 330
1982;306:969–72. 331
[12] Kondrup J, Allison SP, EliaM, Vellas B, PlauthM, Educational and Clinical Practice 332
Committee, European Society of Parenteral and Enteral Nutrition (ESPEN). 333
ESPEN guidelines for nutrition screening 2002. Clin Nutr 2003;22:415e21. 334
[13] Cederholm T, Jensen GL, Correia MITD, Gonzalez MC, Fukushima R, Higashiguchi T, 335
et al. GLIM criteria for the diagnosis of malnutrition - A consensus report from the global 336
clinical nutrition community. Clin Nutr. 2019;38(1):1-9. 337
[14] Hiesmayr M, Schindler K, Pernicka E, Schuh C, Schoeniger-Hekele A, Bauer P, et al. 338
Decreased food intake is a risk factor for mortality in hospitalised patients: The NutritionDay 339
survey 2006. Clin Nutr 2009;28:484–91. 340
[15] Thibault R, Goujon N, Le Gallic E, Clairand R, Sébille V, Vibert J, et al. Use of 10-point 341
analogue scales to estimate dietary intake: A prospective study in patients nutritionally at-risk. 342
Clin Nutr 2009;28:134–40. 343
[16] Guerdoux-Ninot E, Flori N, Janiszewski C, Vaillé A, de Forges H, Raynard B, et al. 344
Assessing dietary intake in accordance with guidelines: Useful correlations with an ingesta-345
Verbal/Visual Analogue Scale in medical oncology patients. Clin Nutr 2019;38:1927–35. 346
[17] Senesse P, et al. Recommandations professionnelles. Nutrition chez le patient adulte 347
atteint de cancer : textes courts. Nutr Clin Metab 2012;26:151-158. 348
[18] Chambrier C, Sztark F; groupe de travail de la Société francophone de nutrition clinique 349
et métabolisme (SFNEP) et de la Société française d'anesthésie et réanimation (SFAR). 350
French clinical guidelines on perioperative nutrition. Update of the 1994 consensus 351
conference on Perioperative artificial nutrition after elective surgery in adults. J Visc Surg 352
2012; 149:e325-e336. 353
[19] Flahault A, Cadilhac M, Thomas G. Sample size calculation should be performed for 354
design accuracy in diagnostic test studies. J Clin Epidemiol. 2005 Aug;58(8):859-62. 355
[20] Chu H, Cole SR. Sample size calculation using exact methods in diagnostic test studies. J 356
Clin Epidemiol. 2007 Nov; 60(11):1201-2]. 357
[21] Volkert D, Beck AM, Cederholm T, Cruz-Jentoft A, Goisser S, Hooper L, et al. ESPEN 358
guideline on clinical nutrition and hydration in geriatrics. Clin Nutr 2019;38:10-47. 359
[22] National Institute for Health and Care Excellence. Nutrition support for adults: oral 360
nutrition support, enteral tube feeding and parenteral nutrition. CG32. 2006. 361
https://www.nice.org.uk/guidance/CG32 (accessed 19 Feb 2020). 362
[23] National Institute for Health and Care Excellence. Quality standard for nutrition support 363
in adults. QS24. 2012. https://www.nice.org.uk/guidance/qs24 (accessed 19 Feb 2020). 364
[24] Thibault R, Chikhi M, Clerc A, Darmon P, Chopard P, Genton L, et al. Assessment of 365
food intake in hospitalised patients: A 10-year comparative study of a prospective hospital 366
survey. Clin Nutr 2011;30:289–96. 367
[25] Schindler K, Themessl-Huber M, Hiesmayr M, Kosak S, Lainscak M, Laviano A, et al. 368
To eat or not to eat? Indicators for reduced food intake in 91,245 patients hospitalized on 369
nutritionDays 2006-2014 in 56 countries worldwide: a descriptive analysis. Am J Clin Nutr 370
2016;104:1393-1402. 371
[26] Sauer AC, Goates S, Malone A, Mogensen KM, Gewirtz G, Sulz I, et al. Prevalence of 372
Malnutrition Risk and the Impact of Nutrition Risk on Hospital Outcomes: Results From 373
nutritionDay in the U.S. J Parenter Enteral Nutr 2019;43:918-926. 374
Table 1 – Clinical and sociodemographic characteristics of all patients included (n=505). 376
Qualitative variables are reported as n (%) and compared using Chi2 or Fisher tests. 377
Quantitative variables are reported as mean ± standard deviation and compared using Student 378
or Mann-Whitney Wilcoxon tests. Dependency is evaluated according to the Katz AVQ scale. 379
Comorbidities were chosen in reference to [10] and [15]. 380 Variables Global (n=505) SEFI® ≥ 7 (n=425) SEFI® < 7 (n=80) P value Age (year) 55.7 ±18.7 56.7 ±18.4 50.8 ±19.7 0.009 < 45 yrs 139 (27.5) 110 (25.9) 29 (36.3) 0.134 45-70 yrs 251 (49.7) 214 (50.4) 37 (46.3) ≥ 70 yrs 115 (22.8) 101 (23.8) 14 (17.5) Gender (male / female) 196 (38.8) /
309 (61.2) 173 (40.7) / 252 (59.3) 23 (28.8) / 57 (71.3) 0.044 Living alone 154 (30.5) 122 (28.7) 32 (40.0) 0.044 Dependency 18 (3.6) 15 (3.5) 3 (3.8) 1.000
Chronic alcohol consumption 13 (2.6) 9 (2.1) 4 (5.0) 0.135 Tobacco use 65 (12.9) 50 (11.8%) 15 (18.8%) 0.087 Professional status 0.150 farmer 4 (0.8) 4 (0.9) 0 craftsperson, storekeeper 15 (3.0) 13 (3.1) 2 (2.5) student 22 (4.4) 15 (3.5) 7 (8.8) executive 39 (7.7) 35 (8.2) 4 (5.0) employee 98 (19.4) 80 (18.8) 18 (22.5) unemployed person 36 (7.1) 26 (6.1) 10 (12.5) worker 31 (6.1) 27 (6.4) 4 (5.0) intermediate occupation 36 (7.1) 33 (7.8) 3 (3.8) retired 224 (44.4) 192 (45.2) 32 (40.0)
Universal health cover status 146 (28.9) 122 (28.7) 24 (30.0) 0.815
Reason for consultation 0.535
prevention 19 (3.8) 18 (4.2) 1 (1.3)
administrative 30 (5.9) 25 (5.9) 5 (6.3)
systematic follow-up 209 (41.4) 178 (41.9) 31 (38.6) acute medical problem 247 (48.9) 204 (48.0) 43 (53.8)
Nutritional parameters
Present weight (kg) 70.9 ± 16.2 70.9 ± 15.4 71.1 ± 20.1 0.911 Present body mass index 26.0 ± 5.5 25.9 ± 5.1 26.3 ± 7.0 0.706 Low body mass index 56 (11.1) 40 (9.4) 16 (20.0) 0.006 <20 if <70 yr <22 if ≥70 yr 42 (75.0) 14 (25.0) 28 (70.0) 12 (30.0) 14 (87.5) 2 (12.5)
Weight loss >5% within the past 6 months
2 (0.7) 2 (0.9) 0 1.000
Weight loss >10% beyond 6 months
2 (0.6) 2 (0.7) 0 1.000
SEFI® visual analogue scale score 8.8 ± 2.1 9.6 ± 0.9 4.4 ± 1.3 < 0.001 Comorbidities Previous history of gastrointestinal surgery 13 (2.6) 6 (1.4) 7 (8.8) 0.001 Current cancer treatment 22 (4.4) 16 (3.8) 6 (7.5) 0.138 Chronic organ insufficiency 27 (5.3) 24 (5.6) 3 (3.8) 0.785 Intestinal malabsorption 4 (0.8) 2 (0.5) 2 (2.5) 0.120 Chronic infection or inflammation 29 (5.7) 21 (4.9) 8 (10.0) 0.110 Diabetes 38 (7.5) 30 (7.1) 8 (10.0) 0.360 Psychiatric disorders 73 (14.5) 52 (12.2) 21 (26.3) 0.001 Polymedication 83 (16.4) 68 (16.0) 15 (18.8) 0.543 Cognitive disorders 9 (1.8) 6 (1.4) 3 (3.8) 0.158 381
Table 2 – Accuracy of the Simple Evaluation of Food Intake (SEFI)® visual analogue 382
scale score <7 for the diagnosis of malnutrition (n=505). Malnutrition is defined by the 383
Global Leadership Initiative on Malnutrition criteria: proportion of patients with at least one 384
phenotypical criterion and at least one etiological criterion. Phenotypical criteria: body mass 385
index<20 (or <22 if age ≥70 yrs), or weight loss >5% within the past 6 months or >10% 386
beyond 6 months; etiological criteria: reduced food intake defined by SEFI®<7 or reduced 387
food assimilation (malabsorption or previous history of GI surgery), or chronic disease-related 388
inflammation (cancer or chronic organ insufficiency).The ‘acute disease/injury’ criterion was 389
not suited to this patient cohort from primary care setting. 390
N (%) SEFI® ≥7 SEFI® <7 Total
Malnutrition 5 (1.0) 16 (3.2) 21 (4.2)
Absence of malnutrition 420 (83.2) 64 (12.6) 484 (95.8)
Total 425 (84.2) 80 (15.8) 505 (100)
Sensitivity is 76.2% (n=16/21, 95% confidence interval (CI), 58.0-94.4), specificity is 86.8% 391
(n=420/484, 95% CI, 83.8-89.8), positive predictive value is 20.0% (n=16/80, 95% CI, 11.2-392
28.8), and negative predictive value is 98.8% (n=420/425, 95% CI, 97.8-99.8). 393
Table 3 – Univariate analysis of variables associated with malnutrition (n=21) among 394
adult patients consulting in general medicine (n=505). CI, confidence interval. 395 Variables N patients N malnourished patients Odds ratio [CI 95%] P value Age (years) < 45 139 8 1 [reference value] 45-70 251 8 0.54 [0.20 ; 1.47] 0.482 ≥ 70 115 5 0.74 [0.24 ; 2.34] Gender Male Female 196 309 3 18 1 [reference value] 3.98 [1.16 ; 13.69] 0.028 Living alone Yes No 154 351 12 9 1 [reference value] 0.31 [0.13 ; 0.76] 0.010 Dependency No Yes 487 18 20 1 1 [reference value] 1.37 [0.17 ; 10.84] 0.763 Chronic alcohol consumption No Yes 492 13 19 2 1 [reference value] 4.53 [0.94 ; 21.86] 0.060 Tobacco use No Yes 440 65 16 5 1 [reference value] 2.21 [0.78 ; 6.25] 0.135 Universal health cover status No Yes 359 146 11 10 1 [reference value] 2.33 [0.97 ; 5.60] 0.060 Previous history of GI surgery No Yes 492 13 17 4 1 [reference value] 12.42 [3.48 ; 44.36] 0.0001 Current cancer treatment No Yes 483 22 17 4 1 [reference value] 6.09 [1.86 ; 19.96] 0.003 Chronic organ insufficiency
No Yes 478 27 18 3 1 [reference value] 3.19 [0.88 ; 11.60] 0.078 Intestinal malabsorption No Yes 501 4 18 3 1 [reference value] 80.50 [7.98 ; 812.21] <0.001 Chronic infection or inflammation No 476 17 1 [reference value] Yes 29 4 4.32 [1.35 ; 13.80] 0.013 Diabetes No 467 21 1 [reference value] Yes 38 0 0.00 [0 ; 2.13E271] 0.970 Psychiatric disorders No Yes 432 73 14 7 1 [reference value] 3.17 [1.23 ; 8.14] 0.017 Polymedication No 422 18 1 [reference value] Yes 83 3 0.84 [0.24 ; 2.92] 0.786 Cognitive disorders No 496 21 1 [reference value] Yes 9 0 0.00 [0 ; Infinite] 0.986 396
Table 4 – Multivariate analysis of variables associated with malnutrition (n=21) among 397
adult patients consulting in general medicine (n=505). CI, confidence interval. 398 Variables N patients N malnourished patients Odds ratio [CI 95%] P value Gender Male Female 196 309 3 18 1 4.92 [1.71 ; 14.17] 0.003 Cancer No Yes Chronic alcohol consumption No Yes 483 22 492 13 17 4 19 2 1 4.78 [1.44 ; 15.94] 1 7.36 [1.31 ; 41.41] 0.011 0.023 399
Figure legends
Figure 1 – Study flow chart.
Figure 2 – Area under the ROC curve showing the performance of the SEFI® visual analogue scale for the diagnosis of malnutrition. AUC=0.822 (95% confidence interval, 0.721-0.923), indicating good predictability.
Figure 1 1441 consultations Non-inclusion criteria (n=390) 1137 patients consulting for the 1 st time 747 eligible patients 505 patients included
Not interviewed or missing data (n=242)
Patients not consulting for the 1
st