Received: 7 October 2002 Accepted: 15 July 2003
Published online: 17 September 2003 © Springer-Verlag 2003
An editorial regarding this article can be found in the same issue (http://dx.doi.org/ 10.1007/s00134-003-2020-8)
This research was supported in part by grant 3200-061988 by the Swiss National Fund. The study was performed at the Sur-gical Research Unit, Department of Clini-cal Research and Clinic for Large Animals, University of Berne, Switzerland
Abstract Objective: pCO
2gradients
are used for the assessment of
splanchnic regional and local
mucos-al blood flow changes in
experimen-tal and clinical research. pCO
2gradi-ents may not parallel blood flow
changes because of concomitant
changes in metabolism, hemoglobin,
temperature, and the Haldane effect.
Design and setting: A randomized,
controlled animal experiment in a
university experimental research
lab-oratory. Interventions: An
extracor-poreal shunt with reservoir and roller
pump was inserted between the
proximal and the distal abdominal
aorta in 16 pigs. In animals
random-ized to the low-flow group (n=8)
splanchnic perfusion was reduced by
running the roller pump. At baseline
and after 45 min of stable shunt flow
superior mesenteric artery, celiac
trunk, spleen artery, and portal vein
blood flows and regional
venous-ar-terial and jejunal and gastric
mucos-al-arterial pCO
2gradients were
measured, and the respective
regional O
2consumption rates
(VO
2) calculated. Measurements
and results: In the low-flow group
all regional blood flows and the
as-sociated VO
2decreased to roughly
50% of baseline values, and
hemo-globin decreased from 7.3 (4.4–9.6)
g/dl to 5.7 (4.1–8.9) g/dl. Decreasing
regional blood flows were
consis-tently associated with increasing
re-gional and mucosal pCO
2gradients.
Conclusions: During isolated
reduc-tion in abdominal aortic blood flow
there is no preferential distribution to
any splanchnic vascular bed and
changes in regional pCO
2gradients
reflect consistently the associated
blood blow changes.
Keywords Low flow · Metabolism ·
pCO
2gradients · Regional blood
flow · Splanchnic perfusion
Rafael Knuesel
Stephan M. Jakob
Lukas Brander
Hendrik Bracht
Andreas Siegenthaler
Jukka Takala
Changes in regional blood flow and pCO
2
gradients during isolated abdominal aortic
blood flow reduction
Introduction
The gastrointestinal tract seems to be a major contributor
to the pathogenesis of the systemic inflammatory
re-sponse syndrome, sepsis, and multiple organ failure in
critical illness [1, 2, 3, 4]. The concept of an
overpropor-tional decrease in the perfusion of visceral organs in
low-flow states to maintain central blood volume and
cardiac output has been developed in earlier studies [5,
6, 7, 8, 9]. Hemodynamic variables and global
parame-ters of tissue perfusion such as acid-base status, blood
lactate concentration, and mixed venous oxygen
satura-tion poorly reflect regional tissue perfusion [10, 11, 12,
13]. Monitoring of CO
2tension in the arterial and
ve-nous blood has been suggested for detection of poor
re-gional and local tissue perfusion and oxygenation [14,
15, 16, 17]. Under clinical conditions the direct
determi-nation of venous-arterial pCO
2gradients in the
splanch-nic vascular beds is not feasible. Intramucosal pCO
2can
be measured indirectly within the lumen of the
gastroin-testinal tract by gastroingastroin-testinal tonometry [18].
Howev-er, the clinical utility of gastrointestinal tonometry
re-mains controversial [19, 20, 21], and studies that
evalu-ate the correlation between the intramucosal pH
(calcu-R. Knuesel · S. M. Jakob (✉
)L. Brander · H. Bracht · A. Siegenthaler J. Takala
Department of Intensive Care Medicine, Inselspital, University Hospital Berne, 3010 Berne, Switzerland
e-mail: [email protected] Tel.: +41-31-6323916
lated from intramucosal pCO
2using the modified
Hen-derson-Hasselbalch equation [22, 23]) and splanchnic
blood flow demonstrate inconsistencies [24].
The cellular CO
2level depends on the balance
be-tween (a) CO
2production via both aerobic and anaerobic
metabolism and (b) CO
2removal by blood flow from the
particular tissue bed and by alveolar ventilation from the
systemic circulation [25]. The regional CO
2production
is expressed as the product of the respective blood flow
and the venous-arterial CO
2content difference. The
ra-tionale behind the use of mucosal-arterial
(venous-arteri-al) pCO
2gradients as a measure of the adequacy of
mu-cosal (regional) blood flow is the almost linear
relation-ship between the blood carbon dioxide content and the
corresponding pCO
2under stable conditions. However,
there are potential confounding factors such as
concomi-tant changes in hemoglobin, pH, temperature, and the
Haldane effect: increasing oxygen saturation increases
the pCO
2for any given carbon dioxide content and vice
versa [26]. Furthermore, changes in the local or regional
CO
2content can occur as a result of phenomena entirely
related to metabolism. Hence pCO
2gradients may not
parallel blood flow changes.
Due to the complex anatomy and physiology of the
splanchnic circulation and the limited access to these
vascular beds in patients the interaction between changes
in metabolism and blood flow and their effect on the
measured regional and mucosal pCO
2gradients cannot
be tested in the clinical setting. We therefore developed
an experimental porcine model to selectively reduce the
abdominal blood flow with limited systemic side effects.
The aims of this study were the following: (a) to assess
the regional blood flow distribution within the
splanch-nic circulation, (b) to compare regional perfusion,
oxy-gen consumption, and pCO
2gradients during isolated
re-duction in visceral blood flow, and (c) to assess whether
confounding factors such as changes in temperature,
he-moglobin, and the Haldane effect affect the relationship
between regional venous-arterial pCO
2gradients and
blood flow in a low visceral perfusion state.
Materials and methods
Anesthesia and monitoring
This study was performed according to the National Institutes of Health guidelines for the use of experimental animals, and the pro-tocol was approved by the Animal Care Committee of the Canton of Berne. Sixteen pigs of both genders (weight range 37–43 kg) were deprived of food but not water 24 h before the experiment. They were premedicated intramuscularly with 0.05 mg/kg atro-pine, 4 mg/kg xylacine, and 15 mg/kg ketamine followed by can-nulation of an ear vein and intravenous administration of 5–10 mg/kg thiopental sodium for endotracheal intubation. As de-scribed previously, anesthesia was maintained with 5 mg/kg thio-pental sodium and 30 µg/kg fentanyl per hour during the operation [27, 28]. After completion of surgery the hourly fentanyl adminis-tration was reduced to 5 µg/kg and muscle relaxation with 1 mg/kg
pancuronium per hour was started. The animals were mechanical-ly ventilated with a volume-controlled ventilator (Servo 900C, Siemens, Solna, Sweden) with 5 cmH2O end-expiratory pressure. Fractional inspired oxygen concentration was adjusted to keep paO2levels between 100 and 150 mmHg. Tidal volume was kept at 10 ml/kg and the minute ventilation was adjusted to maintain paCO2levels between 34 and 41 mmHg. A large-bore gastric tube was introduced into the stomach via the mouth. A right-sided ca-rotid artery catheter, a pulmonary artery catheter (via the right submandibular vein), a catheter for later placement in a hepatic vein (via the right internal jugular vein,) and a right-sided femoral artery catheter were inserted. During surgery and the experiment the animals received per hour 10 ml/kg Ringer’s lactate, 10 ml/kg gelatin solution (Physiogel), and 5 ml/kg 5% glucose. Additional fluid was administered if necessary to keep the pulmonary artery occluded pressure between 5 and 8 mmHg. The goal was to keep the body temperature of the animals at 39°±0.5°C by using an op-erating table heater, warmed fluids, and a blanket.
Animal preparation
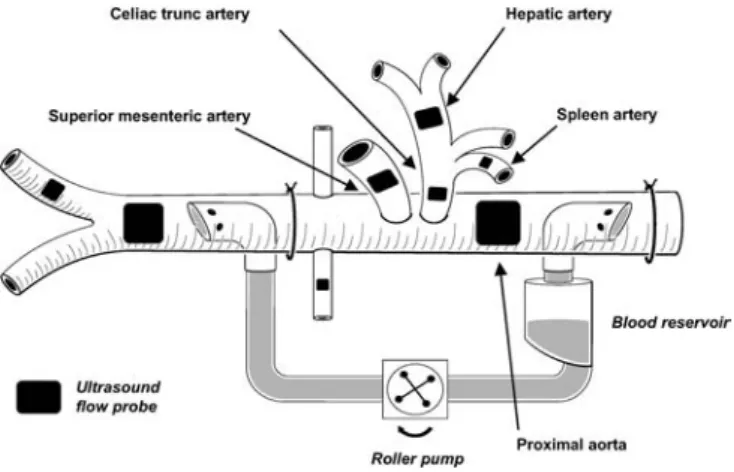
The abdominal cavity was exposed by a midline abdominal inci-sion. A drainage catheter was inserted into the urinary bladder. The superior mesenteric, splenic, hepatic, and femoral arteries, the celiac trunk, and the portal vein were exposed, and ultrasound transit time flow probes (Transonic Systems, Ithaca, N.Y., USA) were placed around the vessels. Two fluid-filled catheters were in-serted proximally and distally into a mesenteric vein. The tip of the first catheter was placed into the portal vein, while the tip of the second catheter remained in the mesenteric vein. A third cathe-ter was inserted into the splenic vein. The abdominal aorta was ex-posed through the left retroperitoneal space, and an ultrasound flow probe was placed around the aorta proximally to the origin of the celiac trunk. A 20-F curved venous cardiopulmonary bypass cannula (Medtronic Cardiopulmonary, Anaheim, Calif., USA) was inserted into the abdominal aorta proximal to the aortic flow probe, and a second 20-F cannula was inserted into the distal aorta with the tip located proximal to the aortic bifurcation. The cannu-las were connected to each other using silicon cardiopulmonary bypass tubes, a cardiotomy reservoir (Jostra, Irvine, Calif., USA) and a precision blood roller pump (Cobe, Denver, Colo., USA). A vascular occluder was placed around the aorta proximal to the dis-tal cannula, and an aortic ultrasound flow probe was placed disdis-tal to the cannula (a schematic illustration of the shunt system is shown in Fig. 1). The pig received boli of 1000–2500 IU heparin to keep the activated clotting time at a level of 400 s minimum.
The measurements were performed using high-range activated clotting time cartridges (Medtronic, Minneapolis, Minn., USA) and an automatized activated clotting time analyzer (Medtronic HemoTec, Parker, Colo., USA). The catheter within the right in-ternal jugular vein was further inserted and the location of the tip within a hepatic vein was confirmed by direct manual palpation. Thereafter the catheter was withdrawn 0.5–1 cm from the wedged position to allow blood sampling. A jejunal and a gastric air to-nometry catheter (Tonometrics, TRIP NGS Catheter, Datex-Oh-meda, Helsinki, Finland) were inserted through an incision in the jejunal wall and orally, respectively, and connected to a Tonocap system (Datex-Ohmeda), after which the incision in the intestinal wall was closed with sutures. When all surgical procedures were completed, the abdominal wall was reapproximated gently, and towels were placed on the surface to minimize heat loss.
Experimental protocol
After preparation 180 min was allowed for hemodynamic stabili-zation before baseline measurements were made and samples were taken. The animals were randomized into two groups: a control group (n=8) and a low-flow group (n=8). In the low-flow group the distal abdominal aorta was occluded to prevent backflow from the distal cannula, and the abdominal aortic flow was reduced to a target total hepatosplanchnic blood flow (=celiac trunk + superior mesenteric arterial blood flow) of 50% of the baseline value by running the roller pump. Once the target abdominal aortic blood flow was reached, the shunt blood flow was kept constant for 45 min. In four randomly allocated animals in the control group (“control/low shunt flow”), the shunt was activated with a low shunt flow of 250 ml/min to control for potential effects of the shunt per se. In the other four animals of the control group the shunt remained closed. At the end of the experiment the animals were killed by an overdose of intravenous potassium. Afterwards the correct position of the hepatic vein catheter was confirmed by anatomical dissection of the liver.
The protocol was carried out in 18 animals. Two animals were excluded post hoc because of discrepancies between size of aorta and aortic cannula with subsequent hypoperfusion of the legs in one animal and bleeding with severe anemia (baseline hemoglobin level less than 4 g/100 ml) in another animal. Measurements after 45 min are labeled as “second measurement”. There were no dif-ferences between groups in systemic hemodynamics and regional blood flow measurements at baseline. In one animal in the low-flow group the spleen low-flow probe was not properly working, and in one animal in the low-flow group and two in the control group it was not possible to obtain blood samples from the mesenteric vein. The corresponding results are therefore missing in the re-spective animals.
Hemodynamic monitoring
Aortic, carotid, pulmonary, and femoral arterial blood pressures, pulmonary artery occluded pressure, and central venous pressure were recorded with quartz pressure transducers and displayed con-tinuously on a multimodular monitor and recorder (S/5 Critical Care Monitor, Datex-Ohmeda). All pressure transducers were si-multaneously zeroed to the level of the heart. Cardiac output was measured by a thermodilution technique (mean value of four mea-surements). Central venous blood temperature was recorded from the thermistor in the pulmonary artery catheter. Heart rate was measured by electrocardiography, which was also continuously monitored.
Blood flow measurements
Abdominal aortic and regional blood flows were measured by ul-trasound transit time flow probes (Transonic Systems). The transit time ultrasound volume flowmeter has been demonstrated to pro-vide adequate measures of arterial and venous flows in experimen-tal animals if carefully positioned and aligned with respect to the vessel [29, 30]. The perivascular ultrasound flow probes were cali-brated in vitro and the signals were visualized and recorded con-tinuously (Flowmeters T108 and T208, Transonic Systems).
Blood gas and lactate measurements
Blood samples for the measurement of hemoglobin, blood gas analysis, and lactate were taken at baseline and after 45 min of sta-ble shunt flow from carotid and pulmonary arteries and from por-tal, hepatic, mesenteric, and splenic veins and were analyzed im-mediately after withdrawal. Hemoglobin concentrations and oxy-gen saturations were measured by an analyzer designed for por-cine blood (OSM 3, Radiometer, Copenhagen, Denmark), and lac-tate and blood gases were analyzed at 37°C in a blood gas, electro-lyte and lactate analyzer (ABL 520, Radiometer).
Calculations
Systemic and regional venous-arterial carbon dioxide content dif-ferences were calculated using an iterative procedure as proposed by Giovannini and colleagues [31] (see Appendix). Since the ac-curacy of this method may be reduced if the metabolic acid-base status in venous and arterial blood largely differs [31], calculations at 45 min were performed only in control animals. The Haldane effect and changes in blood pCO2mediated by changes in hemo-globin-O2saturation and O2-linked CO2binding was calculated as [32]:
(v-a)pCO2HE=0.460 [(a-v)HbO2]0.999e0.015 (pvCO2)−0.852 (Hct)
Re-gional carbon dioxide production was calculated as the product of venous-arterial carbon dioxide content difference and regional blood flow. Regional oxygen consumption was calculated as the product of regional blood flow and arterial-venous oxygen content difference.
Statistics
Statistical analysis was performed with the SPSS software (ver-sion 10.0, SPSS, Chicago, Ill., USA). Because the number of ani-mals per group was small, nonparametric tests were used. Visual-ization of blood flow and metabolic changes within controls and “control/low shunt flow” animals demonstrated no differences. These groups were therefore combined for the statistical analysis (“control group”). Groups at baseline were compared using the Mann-Whitney U test; changes over time in each group were sepa-rately assessed by the Wilcoxon test. For the relative flow changes in the shunt group we used Friedman’s test. Statistical significance was set at p<0.05. All results are presented as median (range) un-less stated otherwise.
Results
Systemic hemodynamics and central temperature are
shown in Table 1. At baseline there were no difference
between the two groups. At the second measurement
heart rate and cardiac output were increased in the
con-trol group while mean arterial pressure did not change in
Table 1 Hemodynamics, temperature, arterial blood gas measurements, and hemoglobin
Baseline Second measurement p
Median Range Median Range Baseline Intervention
Heart rate (beats/min) 0.44
Low flow 116 72–187 147 75–167 0.10
Control 103 73–156 129 81–178 0.03
Systemic mean arterial pressure (mmHg) 0.33
Low flow 86 76–105 74 67–112 0.33
Control 94 66–118 90 75–114 0.89
Pulmonary artery occluded pressure (mmHg) 0.16
Low flow 6 4–9 6 2–7 0.02
Control 7 5–9 6 5–9 0.07
Cardiac output (ml kg−1min−1) 0.15
Low flow 99 74–169 110 83–190 0.35 Control 118 94–160 115 107–210 0.07 Central temperature (°C) 0.65 Low flow 39.8 37.3–41.3 38.7 34.4–39.9 0.01 Control 39.9 38.2–41.5 39.6 38.5–41.4 0.09 pH 0.33 Low flow 7.41 7.34–7.47 7.37 7.30–7.43 0.09 Control 7.42 7.40–7.45 7.43 7.38–7.46 0.40 pCO2(mmHg) 0.96 Low flow 40 35–48 38 34–44 0.02 Control 41 37–46 40 36–42 0.07 SaO2(%) 0.96 Low flow 97 96–98 98 97–99 0.03 Control 98 95–98 98 95–98 0.12 Hemoglobin (g/dl) 0.65 Low flow 7.3 4.4–9.6 5.7 4.1–8.9 0.02 Control 6.1 5.3–8.8 5.7 4.7–9.0 0.12
either group. In the low-flow group wedge pressure was
decreased. Blood gas measurements and hemoglobin
values are also shown in Table 1. Arterial pCO
2and
he-moglobin were decreased in the low-flow group, but
re-mained unchanged in controls. Aortic and regional blood
flows are shown in Table 2. Aortic and regional blood
flows did not differ at baseline, and changes in controls
were not significant. In the low-flow group abdominal
aortic and all regional blood flows were decreased by
50%–80%. The relative flow changes did not differ in
the individual vascular beds (p=0.45). There were no
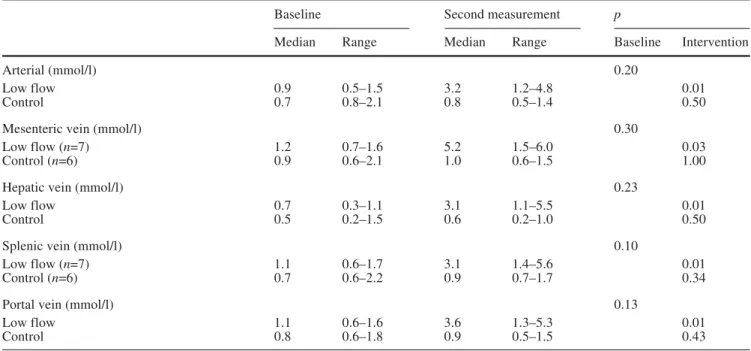
dif-ferences in blood lactate concentrations at baseline
be-tween animals in the two groups (Table 3). Lactate
con-centrations increased in the venous effluents of all
vascu-lar beds in animals from the low-flow group.
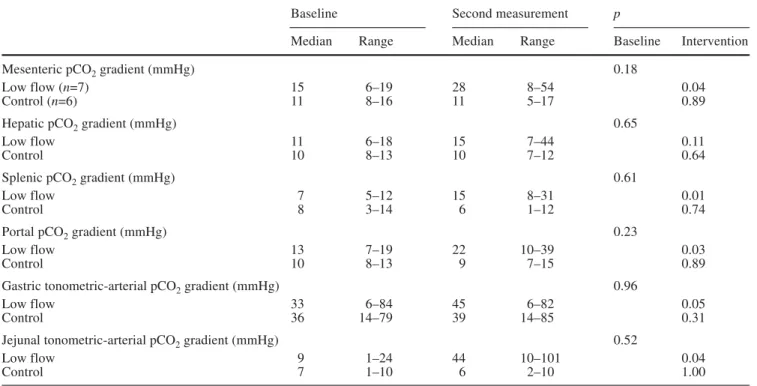
The regional venous-arterial pCO
2-gradients did not
differ between groups at baseline (Table 4). In the
low-flow group the splenic, mesenteric, and portal
venous-arterial pCO
2gradient was increased. In the control
group overall venous-arterial CO
2content differences
remained unchanged. In general, small changes in CO
2content differences corresponded well with the
respec-tive changes in pCO
2differences (Fig. 2). Gastric and
jejunal tonometric values, although highly variable in
both groups, were increased in low flow animals
(Ta-ble 4). Changes in blood pCO
2mediated by changes in
Hb-O2 saturation and O2-linked CO
2binding provided
a mean regional (v-a)pCO
2HE value of 4 mmHg (all
animals and conditions). During low flow, values of up
to 10 mmHg were obtained. The relative contribution to
the measured regional pCO
2gradients was 23%–48%,
depending on the respective region. Results for regional
oxygen consumption (VO
2) and oxygen extraction rates
are shown in Table 5. Hepatic oxygen consumption was
Table 3 Systemic arterial and regional venous lactate
Baseline Second measurement p
Median Range Median Range Baseline Intervention
Arterial (mmol/l) 0.20
Low flow 0.9 0.5–1.5 3.2 1.2–4.8 0.01
Control 0.7 0.8–2.1 0.8 0.5–1.4 0.50
Mesenteric vein (mmol/l) 0.30
Low flow (n=7) 1.2 0.7–1.6 5.2 1.5–6.0 0.03
Control (n=6) 0.9 0.6–2.1 1.0 0.6–1.5 1.00
Hepatic vein (mmol/l) 0.23
Low flow 0.7 0.3–1.1 3.1 1.1–5.5 0.01
Control 0.5 0.2–1.5 0.6 0.2–1.0 0.50
Splenic vein (mmol/l) 0.10
Low flow (n=7) 1.1 0.6–1.7 3.1 1.4–5.6 0.01
Control (n=6) 0.7 0.6–2.2 0.9 0.7–1.7 0.34
Portal vein (mmol/l) 0.13
Low flow 1.1 0.6–1.6 3.6 1.3–5.3 0.01
Control 0.8 0.6–1.8 0.9 0.5–1.5 0.43
Table 2 Aortic and regional blood flows
Baseline Second measurement p
Median Range Median Range Baseline Intervention
Aortic flow (ml kg−1min−1) 1.00
Low flow 71 30–103 16 2–38 0.01
Control 70 61–88 72 37–91 0.89
Superior mesenteric artery flow (ml kg−1min−1) 0.06
Low flow 18 12–31 11 5–23 0.01
Control 27 20–33 28 19–31 0.33
Celiac trunk artery flow (ml kg−1min−1) 0.72
Low flow 18 5–23 10 2–16 0.01
Control 16 11–22 19 14–21 0.07
Hepatic artery flow (ml kg−1min−1) 0.57
Low flow 8 4–18 2 1–14 0.01
Control 10 5–12 10 6–15 0.16
Spleen artery flow (ml kg−1min−1) 0.69
Low flow (n=7) 1.5 1.2–3.0 0.8 0.3–1.8 0.02
Control (n=7) 1.9 0.5–6.2 1.8 0.5–5.5 0.89
Portal vein flow (ml kg−1min−1) 0.57
Low flow 30 19–44 18 10–31 0.01
Table 4 Regional and mucosal pCO2gradients and tonometry data
Baseline Second measurement p
Median Range Median Range Baseline Intervention
Mesenteric pCO2gradient (mmHg) 0.18
Low flow (n=7) 15 6–19 28 8–54 0.04
Control (n=6) 11 8–16 11 5–17 0.89
Hepatic pCO2gradient (mmHg) 0.65
Low flow 11 6–18 15 7–44 0.11
Control 10 8–13 10 7–12 0.64
Splenic pCO2gradient (mmHg) 0.61
Low flow 7 5–12 15 8–31 0.01
Control 8 3–14 6 1–12 0.74
Portal pCO2gradient (mmHg) 0.23
Low flow 13 7–19 22 10–39 0.03
Control 10 8–13 9 7–15 0.89
Gastric tonometric-arterial pCO2gradient (mmHg) 0.96
Low flow 33 6–84 45 6–82 0.05
Control 36 14–79 39 14–85 0.31
Jejunal tonometric-arterial pCO2gradient (mmHg) 0.52
Low flow 9 1–24 44 10–101 0.04
Control 7 1–10 6 2–10 1.00
Table 5 Regional oxygen consumption and oxygen extraction rates
Baseline Second measurement p
Median Range Median Range Baseline Intervention
Mesenteric VO2(ml kg−1min−1) 0.10 Low flow (n=7) 0.8 0.4–1.3 0.5 0.3–1.2 0.02 Control (n=6) 1.1 0.8–2.3 1.1 0.7–2.0 0.31 Hepatic VO2(ml kg−1min−1) 0.04 Low flow 0.8 0.4–1.6 0.4 0.2–1.8 0.26 Control 1.2 0.8–2.5 1.4 0.7–2.7 0.89 Splenic VO2(ml kg−1min−1) 0.38 Low flow (n=7) 0.06 0.02–0.12 0.04 0.01–0.07 0.04 Control (n=6) 0.03 0.02–0.08 0.03 0.02–0.09 0.50 Portal VO2(ml kg−1min−1) 0.38 Low flow 1.4 0.7–2.1 0.8 0.5–1.6 0.01 Control 1.2 0.8–1.6 1.0 0.4–1.4 0.12
Mesenteric oxygen extraction (%) 0.14
Low flow (n=7) 49 20–75 77 30–83 0.09
Control (n=6) 41 34–44 40 27–72 0.75
Hepatic oxygen extraction (%) 0.13
Low flow 38 19–68 59 21–90 0.05
Control 51 32–68 51 41–62 0.67
Splenic oxygen extraction (%) 0.54
Low flow (n=7) 37 13–63 76 26–92 0.01
Control (n=6) 38 11–44 27 10–64 1.00
Portal oxygen extraction (%) 0.13
Low flow 53 24–61 70 40–81 0.07
somewhat higher in control animals at baseline.
Re-gional VO
2remained stable in control animals. In the
low-flow group mesenteric, splenic and portal oxygen
consumption was decreased, while only the increase in
hepatic and splenic oxygen extraction rate reached
sta-tistical significance.
Discussion
The main findings were as follows: (a) In the low-flow
group all regional flows decreased proportionally, no
vascular bed was preferentially perfused, and the
perfu-sion was not preferentially reduced to any vascular bed.
(b) Low abdominal blood flow was associated with a
substantial reduction in O
2consumption in several
splanchnic tissues. (c) In most instances small changes in
pCO
2gradients reflected the respective changes in CO
2content differences. (d) Despite major changes in oxygen
extraction, hemoglobin, and temperature the pCO
2gradi-ents reflected changes in corresponding regional blood
flows in most of the cases (Fig. 3).
This study describes a new model for the assessment
of hemodynamic and metabolic effects of low splanchnic
blood flow. The model excludes to a great extent effects
of hemodynamic and metabolic changes in other
vascu-lar beds. The slight increase in cardiac output and heart
rate in the control group may reflect a systemic
inflam-matory reaction to surgery and indwelling catheters. The
lack of such a circulatory response in the low-flow group
may be explained by the slight reduction in left
ventricu-lar filling, as suggested by a reduction in pulmonary
cap-illary occlusion pressures in these animals. Both a
reduc-tion in systemic vascular resistance due to hemodilureduc-tion
and the resulting reduction in blood viscosity as well as
potential mechanic effects of the running roller pump
may contribute [33, 34]. Another effect of the
extracor-poreal circulation was a reduction in temperature [35,
36, 37], which we were not able to prevent completely
by using warmed fluids and heating blankets. In future
experiments an in-line blood heater can be integrated in
the extracorporeal shunt system to prevent this problem.
Earlier studies have demonstrated an overproportional
decrease in the perfusion of visceral organs in
experi-mental circulatory shock [5, 6, 7, 8, 9]. It has been
sug-gested that contraction of the splanchnic, and
specifical-ly the splenic vascular bed, helps to maintain central
blood volume and cardiac output in hypovolemic states,
Fig. 2 Splenic, mesenteric, hepatic, and portal venous-arterialfor instance, during fluid removal associated with
hemo-dialysis [38]. In the present study all regional blood
flows decreased in parallel by roughly 50% (Table 2);
the more marked reduction in abdominal aortic flow may
be explained by measuring errors due to turbulent blood
flow. It is important to realize that in the experiments by
Bailey and Bulkley and colleagues [7, 8, 9] low systemic
blood flow was achieved by a combination of
hemor-rhage and cardiac tamponade. The authors combined
hemorrhage and cardiac tamponade because they
real-ized that prior hemorrhage sensitreal-ized the animals to
sub-sequent tamponade. In our experiment hypovolemia was
prevented, which could explain the discrepancies
be-tween our findings and those of their experiments.
The reduction in regional blood flows was associated
with marked decreases in regional O
2consumption and
increases in oxygen extraction rates in individual
ani-mals, especially in the low-flow group (Table 5). While
some of the changes may be due to mathematical
cou-pling associated with the use of shared variables in the
calculations [39], and others may be explained by
associ-ated falls in temperature, we believe that the reduction in
regional metabolism in animals in the low-flow group is
due to a transition to flow-dependent metabolism [40].
The rising blood lactate concentrations from the different
splanchnic tissues (Table 3) support this assumption. Our
results and those of others [41] also demonstrate that the
flow/metabolism relationship is not uniform in different
splanchnic vascular regions. On the other hand, in this
experimental setting gastric and jejunal pCO
2gradients
increased similarly, corresponding to a similar decrease
in celiac trunk and superior mesenteric arterial blood
flow. Accordingly, as far as our experimental design is
comparable to a situation of low systemic blood flow in
humans, it can be postulated that gastric tonometry
de-tects substantial changes in mesenteric perfusion.
The rationale behind the use of pCO
2gradients as an
estimate of related blood flow changes is the almost
lin-ear relationship between blood carbon dioxide content
and pCO
2, assuming unchanged oxygen saturation,
he-moglobin, and pH. Although our results demonstrate such
a linear relationship in the group as a whole, in individual
animals there was a dissociation between changes in
Fig. 3 Mesenteric venous-arterial pCO2gradient and superiorme-senteric artery flow, splenic venous-arterial pCO2 gradient and splenic artery flow, hepatic venous-arterial pCO2gradient and to-tal hepatic blood flow, and porto-tal venous-arterial pCO2gradient and portal venous flow
pCO
2gradients and the respective CO
2content
differ-ences (Fig. 2). Several methods exist to calculate regional
venous-arterial CO
2content differences [42, 43].
Unfor-tunately their accuracy is limited in low flow states. The
method proposed by Giovannini et al. [31], for instance,
may not be applied in situations with massive release of
acid ions from anaerobic tissue metabolism into slowly
flowing venous blood in shock states because of the
dis-crepancy between CO
2-binding properties of venous and
arterial blood. Therefore calculation of regional
venous-arterial CO
2content differences and CO
2production is
difficult. Major changes in (venous) oxygen saturation,
hemoglobin, and the venous-arterial pH difference
oc-curred in the present experiment, and such changes also
occur during surgery and intensive care in patients [26].
Among these effects the Haldane effect is quantitatively
the most important one. The Haldane effect describes the
phenomenon of a leftward shift of the CO
2dissociation
curve with decreasing oxygen saturation [44, 45]. The
Haldane effect plays an important role for the magnitude
of changes in pCO
2gradients for a given change in blood
flow as long as the oxygen extraction increases with
de-creasing blood flow, and hence the venous oxygen
satura-tion decreases. In our experiment the mean Haldane
ef-fect on venous-arterial pCO
2gradients was relatively
small (4 mmHg) although maximal values of 10 mmHg
were calculated. These values correspond to 23–48% of
the total pCO
2gradients. Despite this decreases in
region-al blood flows were region-almost region-always associated with
corre-sponding increases in the respective pCO
2gradients.
Er-rors in measurements of pCO
2, hematocrit, and pH are
further explanations for the exceptional discrepancies
be-tween changes in CO
2content and pCO
2differences. The
present model produces regional ischemic hypoxia and
obviously lacks the ability to limit the increasing pCO
2gradients associated with major CO
2stagnation. In
mod-els in which the oxygen content is decreased in the
pres-ence of maintained blood flow (hypoxic hypoxia [46,
47]), the Haldane effect would become a principal
pro-cess in eliminating CO
2.
Progressive anemia during the experiment is another
potential confounding factor. During isovolemic anemia
down to a hematocrit of 12%, CO
2transport is
main-tained mainly by an increased blood flow and an
aug-mented Haldane effect induced by the increased oxygen
extraction [48]. Arterial, venous, and mucosal pCO
2are
maintained [48, 49, 50]. In our experiment blood flow
decreased, and anemia progressed at the same time. We
believe that under these circumstances anaerobic
metab-olism develops earlier than reduction in blood flow
with-out anemia. The combined effect of low blood flow,
an-aerobic CO
2production, and an augmented Haldane
ef-fect on the course of the pCO
2gradients is difficult to
predict. Furthermore, changing body temperature in
indi-vidual animals may also have had an impact on the
rela-tionship between metabolism and blood flow.
We conclude that this new experimental model allows
a selective reduction in visceral blood flows to clinically
relevant levels while systemic perfusion is maintained.
The limitations are extensive surgery, difficulty in
ob-taining stable blood flow conditions and temperature,
and substantial hemodilution. Under the experimental
conditions, with prevention of hypovolemia, no
preferen-tial reduction or preservation of blood flows to the
dif-ferent visceral tissues occurred. In a setting of low blood
flow, even with concomitant metabolic changes, and
pro-gressive anemia pCO
2gradients can be used for the
as-sessment of blood flow changes.
Appendix: calculation of the venous-arterial
CO
2-content difference
Venous-arterial CO
2-content difference was calculated
using the method developed by Giovannini et al. [31].
Briefly, the concentration of CO
2in arterial blood is
de-termined by the concentration of combined CO
2in
plas-ma (CaCO
2p) and red blood cells (CaCO
2r), dissolved
CO
2(CaCO
2d ml/100 ml for all), and hematocrit. CaCO
2=CaCO
2p. [1-Hct
×
(1
−
CaCO
2r/CaCO
2p)]+CaCO
2d. CaCO
2p
is calculated from the arterial pCO
2and pH on the basis
of the Henderson-Hasselbalch equation: CaCO
2p=0.06868
×
(PaCO
2)
×
{10[1.04214
×
(pHa)
−
6.41036]}. The value of
ra=CaCO
2r/CaCO
2p is obtained as a function of plasma
pH and arterial O
2saturation and by using a
concentra-tion fracconcentra-tion of water in plasma and red blood cells
of 0.938 and 0.720, respectively: ra=2.5814
−
0.2640
×
(pHa)
−
[0.2203
−
0.0376
×
(pHa)]
×
(1
−
SaO
2). CaCO
2d is
fi-nally calculated assuming a Bunsen coefficient for red
blood cells 0.00947 ml/100 ml mmHg lower than that of
plasma. CaCO
2d=PaCO
2×
[0.06868
−
0.00947
×
(Hct)]. Any
increase in blood CO
2concentration related to the
in-crease in pCO
2and to the simultaneous decrease in
SaO
2, which takes place when arterial blood becomes
venous, is calculated by considering these two
compo-nents separately and by using the mathematical model
developed and described in detail by Giovannini et al.
[31]. This model simulates the equilibration of whole
blood at increasing pCO
2to determine the virtual values
of combined CO
2concentration in plasma and of plasma
pH, resulting from the increase in pCO
2from arterial to
venous value at constant SaO
2. In a further step the
in-crease in blood CO
2concentration that is related to the
decrease in O
2saturation from arterial to venous value at
constant pCO
2is then calculated. The total increment in
CO
2concentration from arterial to venous blood is
final-ly calculated from the sum of the two changes.
We compared previously the calculated and measured
systemic venous-arterial CO
2content difference
(mea-sured as systemic arterial-venous O
2content difference
multiplied by RQ obtained from indirect calorimetry
[51]). The coefficient of correlation was 0.772 (p<0.001).
The mean of the calculated venous-arterial CO
2content
difference was 3.52±0.95, and the mean of the measured
venous-arterial CO
2content difference was 3.97±1.06.
The difference between the means was therefore
0.44±0.69, and the 95% confidence interval was
−
0.63 to
−
0.25, and significantly different from zero (p<0.001).
Although the standard deviation of the means was similar
to the one reported by Giovannini et al. (0.69 vs. 0.59),
we found a bias which was not reported in their
investiga-tion. Since we were looking at changes in venous-arterial
CO
2content difference rather than absolute values, this
bias is unlikely to confound the results.
References
1. Marshall JC, Christou NV, Meakins JL (1993) The gastrointestinal tract. The “undrained abscess” of multiple organ failure. Ann Surg 218:111–119 2. Antonsson JB, Fiddian-Green RG
(1991) The role of the gut in shock and multiple system organ failure. Eur J Surg 157:3–12
3. Knichwitz G, Van Aken H, Brussel T (1998) Gastrointestinal monitoring using measurement of intramucosal PCO2. Anesth Analg 87:134–142 4. Moore EE, Moore FA, Franciose RJ,
Kim FJ, Biffl WL, Banerjee A (1994) The postischemic gut serves as a prim-ing bed for circulatprim-ing neutrophils that provoke multiple organ failure. J Trau-ma 37:881–887
5. Bulkley GB, Kvietys PR, Perry MA, Granger DN (1983) Effects of cardiac tamponade on colonic hemodynamics and oxygen uptake. Am J Physiol 244:G604–G612
6. Bulkley GB, Oshima A, Bailey RW (1986) Pathophysiology of hepatic ischemia in cardiogenic shock. Am J Surg 151:87–97
7. Bailey RW, Bulkley GB, Hamilton SR, Morris JB, Smith GW (1986) Patho-genesis of nonocclusive ischemic coli-tis. Ann Surg 203:590–599
8. Bailey RW, Bulkley GB, Hamilton SR, Morris JB, Haglund UH (1987) Protec-tion of the small intestine from nonoc-clusive mesenteric ischemic injury due to cardiogenic shock. Am J Surg 153:108–116
9. Bailey RW, Bulkley GB, Hamilton SR, Morris JB, Haglund UH, Meilahn JE (1987) The fundamental hemodynamic mechanism underlying gastric “stress ulceration” in cardiogenic shock. Ann Surg 205:597–612
10. Hamilton-Davies C, Mythen MG, Salmon JB, Jacobson D, Shukla A, Webb AR (1997) Comparison of com-monly used clinical indicators of hypo-volaemia with gastrointestinal tonome-try. Intensive Care Med 23:276–281 11. Heino A, Hartikainen J, Merasto ME,
Koski EM, Alhava E, Takala J (1997) Systemic and regional effects of exper-imental gradual splanchnic ischemia. J Crit Care 12:92–98
12. Heino A, Hartikainen J, Merasto ME, Alhava E, Takala J (1998) Systemic and regional pCO2 gradients as mark-ers of intestinal ischaemia. Intensive Care Med 24:599–604
13. Uusaro A, Ruokonen E, Takala J (1996) Splanchnic oxygen transport af-ter cardiac surgery: evidence for inade-quate tissue perfusion after stabiliza-tion of hemodynamics. Intensive Care Med 22:26–33
14. Zhang H, Vincent JL (1993) Arteriove-nous differences in PCO2 and pH are good indicators of critical hypoperfu-sion. Am Rev Respir Dis 148:867–871 15. Ruokonen E, Soini HO, Parviainen I,
Kosonen P, Takala J (1997) Venoarteri-al CO2 gradient after cardiac surgery: relation to systemic and regional perfu-sion and oxygen transport. Shock 8:335–340
16. Teboul JL, Graini L, Boujdaria R, Berton C, Richard C (1993) Cardiac index vs oxygen-derived parameters for rational use of dobutamine in pa-tients with congestive heart failure. Chest 103:81–85
17. Vallet B, Teboul JL, Cain S, Curtis S (2000) Venoarterial CO (2) difference during regional ischemic or hypoxic hypoxia. J Appl Physiol 89:1317–1321 18. Fiddian-Green RG, Pittenger G, White-house WM Jr (1982) Back-diffusion of CO2 and its influence on the intramu-ral pH in gastric mucosa. J Surg Res 33:39–48
19. Brown SD, Gutierrez G (1996) Does gastric tonometry work? Yes. Crit Care Clin 12:569–585
20. Benjamin E, Oropello JM (1996) Does gastric tonometry work? No. Crit Care Clin 12:587–601
21. Russell JA (1997) Gastric tonometry: does it work? Intensive Care Med 23:3–6
22. Morgan TJ, Venkatesh B, Endre ZH (1997) Continuous measurement of gut luminal PCO2 in the rat: responses to transient episodes of graded aortic hy-potension. Crit Care Med
25:1575–1578
23. Morgan TJ, Venkatesh B, Endre ZH (1999) Accuracy of intramucosal pH calculated from arterial bicarbonate and the Henderson-Hasselbalch equa-tion: assessment using simulated isch-emia. Crit Care Med 27:2495–2499
24. Uusaro A, Ruokonen E, Takala J (1995) Gastric mucosal pH does not re-flect changes in splanchnic blood flow after cardiac surgery. Br J Anaesth 74:149–154
25. Schlichtig R, Bowles SA (1994) Dis-tinguishing between aerobic and anaer-obic appearance of dissolved CO2 in intestine during low flow. J Appl Physiol 76:2443–2451
26. Jakob SM, Kosonen P, Ruokonen E, Parviainen I, Takala J (1999) The Haldane effect-an alternative explana-tion for increasing gastric mucosal PCO2 gradients? Br J Anaesth 83:740–746
27. Tenhunen JJ, Kosunen H, Alhava E, Tuomisto L, Takala JA (1999) Intesti-nal lumiIntesti-nal microdialysis: a new ap-proach to assess gut mucosal ischemia. Anesthesiology 91:1807–1815 28. Jakob SM, Merasto-Minkkinen M,
Tenhunen JJ, Heino A, Alhava E, Takala J (2000) Prevention of systemic hyperlactatemia during splanchnic ischemia. Shock 14:123–127 29. Lundell A, Bergqvist D, Mattsson E,
Nilsson B (1993) Volume blood flow measurements with a transit time flow-meter: an in vivo and in vitro variabili-ty and validation study. Clin Physiol 13:547–557
30. Hartman JC, Olszanski DA, Hullinger TG, Brunden MN (1994) In vivo vali-dation of a transit-time ultrasonic vol-ume flow meter. J Pharmacol Toxicol Methods 31:153–160
31. Giovannini I, Chiarla C, Boldrini G, Castagneto M (1993) Calculation of venoarterial CO2 concentration differ-ence. J Appl Physiol 74:959–964 32. Giovannini I, Chiarla C, Boldrini G,
Terzi R (1999) Quantitative assessment of changes in blood CO (2) tension me-diated by the Haldane effect. J Appl Physiol 87:862–866
33. Hardesty RL, Baker LD, Gall DA, Bahnson HT (1969) Systemic resis-tance during cardiopulmonary bypass. Surg Forum 20:185–188
34. Weiland AP, Walker WE (1986) Physi-ologic principles and clinical sequelae of cardiopulmonary bypass. Heart Lung 15:34–39
35. Pellegrini A, Respighi E, Panzeri E (1967) [Extracorporeal circulation-hypothermia and the problem of hemo-dilution]. Minerva Med 58:2149–2151 36. Moon YS, Ohtsubo S, Gomez MR,
Moon JK, Nose Y (1996) Comparison of centrifugal and roller pump hemoly-sis rates at low flow. Artif Organs 20:579–581
37. Mueller XM, Tevaearai HT, Jegger D, Tucker O, von Segesser LK (2001) Hemolysis and hematology profile dur-ing perfusion: inter-species compari-son. Int J Artif Organs 24:89–94 38. Yu AW, Nawab ZM, Barnes WE,
Lai KN, Ing TS, Daugirdas JT (1997) Splanchnic erythrocyte content de-creases during hemodialysis: a new compensatory mechanism for hypovo-lemia. Kidney Int 51:1986–1990 39. Archie JP Jr (1981) Mathematic
cou-pling of data: a common source of er-ror. Ann Surg 193:296–303
40. Pastor CM (2000) Hepatic and splanchnic oxygen consumption during acute hypoxemic hypoxia in anesthe-tized pigs. Crit Care Med 28:765–773
41. Rendig SV, Chahal PS, Longhurst JC (1997) Cardiovascular reflex responses to ischemia during occlusion of celiac and/or superior mesenteric arteries. Am J Physiol 272:H791–H796
42. Loeppky JA, Fletcher ER, Roach RC, Luft UC (1993) Relationship between whole blood base excess and CO2 con-tent in vivo. Respir Physiol
94:109–120
43. Douglas AR, Jones NL, Reed JW (1988) Calculation of whole blood CO2 content. J Appl Physiol 65:473–477
44. Siggaard-Andersen O, Garby L (1973) The Bohr effect and the Haldane effect. Scand J Clin Lab Invest 31:1–8 45. Christiansen J, Douglas CG, Haldane
JS (1914) The absorption and dissocia-tion of carbon dioxide by human blood. J Physiol 48:244
46. Dubin A, Murias G, Estenssoro E, Canales H, Badie J, Pozo M, Sottile JP, Baran M, Palizas F, Laporte M (2002) Intramucosal-arterial PCO2 gap fails to reflect intestinal dysoxia in hypoxic hypoxia. Crit Care 6:514–520 47. Neviere R, Chagnon JL, Teboul JL,
Vallet B, Wattel F (2002) Small intes-tine intramucosal PCO (2) and micro-vascular blood flow during hypoxic and ischemic hypoxia. Crit Care Med 30:379–384
48. Deem S, Alberts MK, Bishop MJ, Bidani A, Swenson ER (1997) CO2 transport in normovolemic anemia: complete compensation and stability of blood CO2 tensions. J Appl Physiol 83:240–246
49. Dubin A, Estenssoro E, Murias G, Canales H, Sottile P, Badie J, Baran M, Palizas F, Laporte M, Rivas DM (2001) Effects of hemorrhage on gastrointesti-nal oxygenation. Intensive Care Med 27:1931–1936
50. Vallet B (2002) Influence of flow on mucosal-to-arterial carbon dioxide dif-ference. Crit Care 6:463–464
51. Jakob SM, Kosonen P, Ruokonen E, Parviainen I, Takala J (1999) The Haldane effect—an alternative expla-nation for increasing gastric mucosal PCO2 gradients? Br J Anaesth 83:740–746