International Journal of Epidemiology
© International Epidemiological Association 1985
Vol. 14, No. 4 Printed in Great Britain
Trends in Total Mortality and Mortality
from Heart Disease in 26 Countries
from 1950 to 1978
THOMAS J THOM*, FREDERICK H EPSTEIN**, JACOB J FELDMANt AND
PAUL E LEAVERTON*
Thorn T J (Epidemiology and Biometry Program, National Heart, Lung and Blood Institute, Federal Bldg. Room 2C-08, Bethesda, MD 20205, USA), Epstein F H, Feldman J J and Leaverton P E. Trends in total mortality and mortality from heart disease in 26 countries from 1950 to 1978. International Journal of Epidemiology 1985, 14: 510-520.
Death rates for total mortality and for non-rheumatic heart disease and hypertension ('heart disease') are described for men and women ages 45-64 in six time periods during 1950-78 for 26 countries. Rates for men in high-rate countries are three times those in low-rate countries. This variation is more striking for men than women. There were marked increases for heart disease in men in most countries, but in 13 countries there was a slowing or reversal of that trend in the 1960's or 1970's or acceleration of an already downward trend. In 22 countries long-term declines for heart disease occurred in women. There was a widening of the north/south gradient in Europe and of the male/female ratio of heart disease mortality. Countries with high heart disease death rates in men had high ratios of heart disease to total death. Other countries experienced a rise in proportionate mortality. In women, proportionate mortality for heart disease remained flat or declined in most countries. In spite of these changes in rates, each country seems to have a range for heart disease mortality that is characteristic of its population and environmental setting so that profound changes in rates do not substantially alter their relative ranking.
Our intent is to stimulate the search for reasons why heart disease mortality recently declined in some countries but not in others (already begun in the WHO-sponsored MONICA programme). Our forthcoming monograph on international mortality trends for the major causes of death will be a next step in this process.
It has been well documented that mortality from the
cardiovascular diseases improved dramatically in
several countries in recent years with a reversal in the
increasing trend for coronary heart disease and
acceleration of the decline for the cerebrovascular
diseases.
1"
8This development, in the United States
particularly, focused attention on the need for
systematic analysis of mortality trends on an
inter-national scale. To date, comparisons of mortality
trends in different countries have been limited by a
focus that is narrow in terms of number of countries,
causes of death, age range and time periods. As a first
step towards a more complete analysis of these
important changes in mortality trends, we describe
death rates for total mortality and for heart disease
mortality for ages 45—64 by sex for 26 countries, 1950
to 1978. These selected countries are compared with
respect to the impact on total mortality of trends in
* Epidemiology and Biometry Program, National Heart, Lung, and
Blood Institute, Federal Bldg. Room 2C-08, Bethesda, MD 20205,
USA.
** Institute for Social and Preventive Medicine, University of Zurich, Zurich, Switzerland.
+ National Center for Health Statistics, Hyattsville, Maryland, USA.
heart disease mortality and trends in men compared
with women.
METHODS
For each of the 26 countries listed below death rates for
total mortality and for non-rheumatic heart disease and
hypertension (heart disease) were calculated grouped
into six time periods: 1950-1954, 1955-1959,
1960-1964, 1965-1969, 1970-1974, and 1975-1978.for ages
45-64 years by sex. 'Heart disease' includes codes
420-447 in the Sixth and Seventh Revisions of the
International Classification of Diseases (ICD) up to
1967 and codes 400-404, 410-429 in the Eighth
Revision from 1968 to 1978. This cause-of-death group
was chosen to reflect (in most countries) its main
component, coronary heart disease, and to constitute a
comparable category throughout the three ICD
revisions and among the 26 countries. Rates are
adjusted for age using the two 10-year age groups
45-54 and 55-64 and the population of all years and all
countries combined as the standard. Rates are grouped
into these six time periods to enhance their stability.
The level and general direction, slope, and changes in
trends can be seen from grouped rates on a smoothed
510TRENDS IN TOTAL MORTALITY AND MORTALITY FROM HEART DISEASE 511
but sounder basis than through use of annual rates.
Rates for some of the years are missing as shown below.
Rates for the US are for the white population only in
order to be as comparable as possible with rates in most
of the other countries.
Country
Australia (AUL)
Austria (AUS)
Belgium (BEL)
Canada (CAN)
Czechoslovakia (CZE)
Denmark (DEN)
England/Wales (EW)
Finland (FIN)
France (FRA)
Germany, FR (FRG)
Ireland (IRE)
Israel (ISR)
Italy (ITA)
Japan (JA)
Netherlands (NET)
N. Ireland (NIR)
Norway (NOR)
New Zealand (NZ)
Poland (POL)
Portugal (POR)
Scotland (SCO)
Spain (SP)
Sweden (SWE)
Switzerland (SWI)
U.S. white (US)
Yugoslavia (YUG)
Missing Years
50-54
50-53, 77,78
78
50,51,74,76-78
50
50,51,78
78 •
50,51
76-78
50,76-78
78
50
50-58
50-54,77,78
50-59,61,62,
68,77,78
50
50
50-60,78
These 26 countries were selected because we believe
that their population estimates and death registration
systems are reasonably accurate and their cause of
death statistics are reasonably comparable. That may
be true for other countries as well, but either we could
not be certain of that or the mortality data were not
readily available to us.
Systematic errors in certification of the underlying
causes of death, changes in death certification practices
over time, and the uncertain comparability of countries
with respect to cause-of-death statistics are three
problems inherent in mortality analyses. To minimize
these problems we describe total mortality, which we
assume to be accurate and comparable over time and
space, and only the one broad cause-of-death group
'non-rheumatic heart disease and hypertension'. One
caution about this is that in recent years many
investigators have described international mortality
trends for the subcategory 'coronary heart disease'.
Consequently, our results may look quite different
from theirs in several respects, which we will endeavour
to point out.
It is anticipated that a more comprehensive
mono-graphy by the National Center for Health Statistics will
be forthcoming which will include all death rates now
available to us courtesy of Dr. Louis Masse of l'Ecole
Nationale de la Sante Publique in Rennes-Cedex,
France. Our intention is to present an overall picture of
international mortality for major causes of death in
hitherto unprecedented completeness and
compara-bility, to be used in a preliminary search for patterns
and hypotheses.
RESULTS
Trends in Total and Heart Disease Mortality
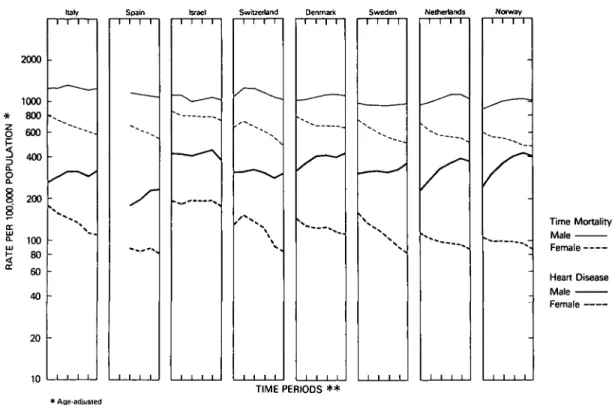
Trends in the total and heart disease mortality rates are
shown on a logarithmic scale in Figure 1 to compare the
rate of change over time. The 26 countries are arranged
in order of descending total mortality during
1950-1954. Between the extremes, Finland and nearby
Norway, total mortality ranges from just over 1800 per
100000 to 900 per 100000 at the start of the period in
men. Among women, the rates are markedly lower and,
in contrast to the men, diminish fairly steeply and
con-tinuously over the entire period of almost 30 years
(1950-1978). Among men, total mortality tends to
diminish uniformly as well, with a number of
excep-tions, but has been decreasing during the last 10 years
everywhere, except in Czechoslovakia and Poland (the
increase in Sweden is minimal).
In order to explain the differences between countries
and the trends within each country for total mortality, a
detailed analysis by all specific causes of death would
be necessary.
9For the present purpose, attention is
confined to the category 'heart disease', as defined
under 'Methods'. Since heart disease deaths constitute
a major, though variable proportion of all deaths,
heart disease mortality will be partly reflected in total
mortality rates and trends. This is generally true for
women but only within limits for men (Figure 1). Total
and heart disease mortality trends among men do not
run parallel in Finland and Scotland and during the
earlier periods, in England and Northern Ireland,
Yugoslavia and Spain. When heart disease rates
increase and total mortality decreases, the explanation
is usually that causes other than heart disease have been
diminishing during the period of observation, which is,
indeed, the case in the above situations.
An additional perspective on secular changes in
heart disease mortality may be gained by ordering
mortality rates in men on a continuous scale, ranging
512 INTERNATIONAL JOURNAL OF EPIDEMIOLOGY 2000 1000 * 800 2 600 1 400
2
|
m t 100 5 80 CC 60 40 20 10 Rntsnd 1 1 : -\ i i i i Scotland_x—-\ } _x—-\ _x—-\ Japan V \ %x
N
i i i i USA i i i i France 1 1 1 1 1 1 1 1 Cnchostovskia 1 1 1 1 ^ -- — -- -- % , I I I I AusnaEa 1 1 1 1 • * - . - — - > 1 1 1 1 Ausma 1 1 1 1 " " " " " ' • ' * « . . 1 1 1 1 England/Wales • -• i i i Total Mortality Male Female Heart Disease Male F e m a l o •• • • • • Age-adjusted T I M E P E R I 0 D S * * * * Six points in time: 1950-54. 1955-59. 1960-64. 1965-69. 1970-74. 1975-78.FIGURE 1A Death Rales for Total Mortality and for Heart Disease: Ages 45-64 by Sex and Country: 1950-1954, 1955-1959, 1960-1964,
1965-1969, 1970-1974, and 1975-1978.
Portugal Belgium Yugoslavia New Zealand Germany. F.fl.
2000 1000 800 400
i
10080 60 40 20 10 Total Mortality Male Female Heart Disease Male Female TIME PERIODS * * * Age-adjusted • • S i x poraj in lime: 1950 54. 195559. 196064. 196569. 1970-74. 1975-78.FIGURE IB Death Rales for Total Mortality and for Heart Disease: Ages 45-64 by Sex and Country: 1950-1954, 1955-1959, 1960-1964,
Italy
TRENDS IN TOTAL MORTALITY AND MORTALITY FROM HEART DISEASE
Spain Israel Switzerland Denmark Sweden Netherlands Norway
513 2000 1000 * 800 g 600 3 400 200 100 80 60 40 20 10 _J ~ J I I I I I I I Time Mortality Male Female Heart Disease Male Female TIME PERIODS * * * Age-adjusted * * S i x points in time: 1950-54. 1955-59. 1960-64. 1965-69. 1970-74. 1975-78,
FIGURE 1C Death Rales for Total Mortality and for Heart Disease; Ages 45-64 by Sex and Country: 1950-1954, 1955-1959, 1960-1964, 1965-1969. 1970-1974, and 1975-1978.
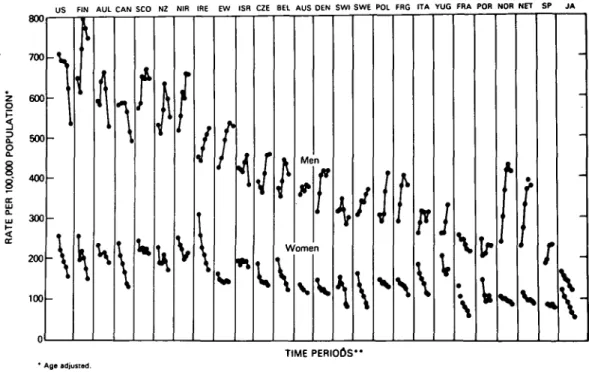
from the initially (1950-1954) highest to the initially lowest rate (Figure 2). This time, an arithmetic rather than a logarithmic scale was used in order to display actual rather than percentage changes over the entire period (1950-1978). Several features are apparent at a glance:
1. Differences between countries are less marked for women than men.
2. The trend for men during the earlier time periods in most countries, with the notable exceptions of the US, Canada and Japan, is upward, with little or no upward change subsequently in the majority of countries. (As in most countries the trend for the subgroup 'coronary heart disease' was substantially upwards in the earlier period in the US and Canada.) 3. The trend for women is uniformly downward in all
countries over the entire 28-year period.
4. Most important and striking, it would almost seem as if each country (except Japan) had a heart disease mortality pattern characteristic for its population and environmental setting. Within each pattern, rates may fluctuate up and down but appear to stay within a relatively narrow range, at least during this 28-year period and under the environmental conditions prevailing during this time.
The situation depicted in this figure may help in making realistic estimates to the extent improvements in heart disease mortality may be expected in different countries, to be discussed later.
It is useful to compare the trends in heart disease and total mortality (Figure 3), arranging countries in the same order of descending heart disease mortality. Again, the ranges are greater for men than women. Mortality in women decreases uniformly and, for total mortality among men, there is a tendency toward a uniform decrease in most countries, in contrast to heart disease. There is a striking cluster of countries with low total mortalities for men throughout the 28-year period: Israel, Denmark, Switzerland, Sweden, Norway, the Netherlands and Spain. Japan more recently joined that group. There are no such unusually high or low groups of countries for total mortality in women or for heart disease mortality in either sex.
Relationships between Recent and Earlier Changes in Heart Disease Mortality
The death rate for heart disease in men 45-64 years of age from 1950 to 1978 was downward throughout this period in Japan and the US with marked acceleration of the rate of decline since about 1965 when reversal of the trend for the subgroup, coronary heart disease took
514 INTERNATIONAL JOURNAL OF EPIDEMIOLOGY
US FIN AUL CAN SCO N2 NIR IRE EW ISR CZE BEL AUS DEN SWI SWE POL FRG ITA YUG FRA POR NOR NET SP JA
z o
2
o 8 < 800 700 600 500 400 300 200 100 \ \ \ Men Women \ \F
Mr
I
F I G U R E 2 TIME PERIODS" * Age adjusted." Six points in time: I960 54. 1955-59. 1960 64. 1966 69 1970 74, 1975 78.
Death Rates for Heart Disease in Men and Women Ages 45-64; 26 Countries, 1950 to 1978.
US FIN AUL CAN SCO N2 NIR IRE EW ISR CZE BEL AUS DEN SWI SWE POL FRG ITA YUG FRA POR NOR NET SP JA
1800 1700 1600 1500 1400 § ,300
E
UJ < 1200 1100 1000 900 -\ \If
1
\
\
• Age adjusted. T I M E P E R I O D S " "Six points in tim«: 1950-54, 1956-59, 1960-64. 1965-69. 1970-74. 1975-78.1100 1000 O 900
5
2
OZ tuTRENDS IN TOTAL MORTALITY AND MORTALITY FROM HEART DISEASE 515
US FIN AUL CAN SCO NZ NIR IRE EW ISR CZE 8EL AUS DEN SWI SWE POL FRG ITA YUG FRA POR NOR NET SP JA
800 8 700 600 500 4 0 0 -\ TIME PERIODS" * Age adjusted.
•• Six points in time: 1950 54. 1955-59, 196064. 1965-69. 1970 74. 1975-78.
FIGURE 3B Death Rates for Total Mortality in Women Ages 45-64; 26 Countries, 1950 to 1978.
place.1 The death rate in France declined throughout
this period as well. Heart disease mortality declined since the 1960's following a rising trend in Canada, the Federal Republic of Germany, Australia, New Zealand, and Finland. The same pattern but with a peak in the early 1970's is seen in the Netherlands, Norway, England/Wales, Portugal, and Israel. A generally upward trend throughout the period is seen in Ireland, Poland, Spain, Czechoslovakia, Yugoslavia, and Sweden. A pattern is not discernible in the other seven countries. Countries with the steepest decline in the 1970/1974 to 1975/1978 period are the US, Australia, and Israel, with declines exceeding 13%. With respect to direction and steepness of the recent trend (1970/1974-1975/1978) versus the level in 1975/ 1978, declines are greater in countries with higher death rates. Many countries with low rates have upward trends. Exceptions are France and Japan with low rates yet steep declines and England/Wales, Northern Ireland, and Ireland with high rates but an upwards or an unchanged trend.
The death rate for heart disease in women 45-64 years of age from 1950 to 1978 was downward through-out the period in Japan, the US, the Federal Republic of Germany, Belgium, the Netherlands, Norway, France, Sweden, Canada, Ireland, Italy, and Austria. The rate of decline accelerated in the 1970's only in the first six countries listed. Countries experiencing a generally downward trend are Finland, New Zealand,
Switzerland, Denmark, Poland, Czechoslovakia, England/Wales. Portugal is in this group except for the anomalous 1965/1969 to 1970/1974 period of a nearly 16% rise. The death rate in Australia is also on the decline but only since the late 1960's. The death rate is on the rise in Northern Ireland after a decline in the 1950's and 1960's. Patterns are not discernible in Scotland, Spain, and Yugoslavia. Countries with the steepest decline in the 1970/1974 to 1975/1978 period are Japan, Australia, France, Finland, the US, Portugal, the Federal Republic of Germany, Belgium, and New Zealand, with declines exceeding 10%. Comparing the direction and steepness of the trend for 1970/1974 to 1975/1978 with the level of the 1975/ 1978 rate one sees steep declines in countries regardless of how high the rate is and an upward trend in two countries with very high rates, Northern Ireland and Yugoslavia. For every country with clear patterns except Sweden, Ireland, Poland and Czechoslovakia the trend in women is consistent with that in men. In these four countries the trend is generally downwards in women and upwards in men. There are, however, ten countries where either the trend in men or the trend in women is not clear in terms of direction over the 28-year period.
Proportionate Mortality
Proportionate mortality (per cent of total mortality due to heart disease) is one measure of the degree to which
516 INTERNATIONAL JOURNAL OK EPIDEMIOLOGY
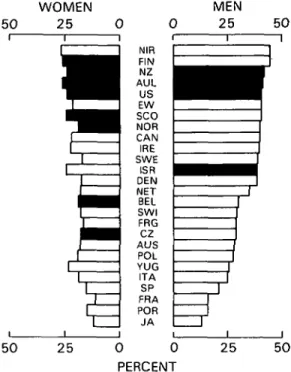
heart disease contributes to total mortality and how changes in mortality from heart disease affect total mortality. The contribution of heart disease to total mortality differs widely from country to country among men and, to a lesser degree and on a lower percentage level among women (Figure 4). In general, countries with higher death rates from heart disease have higher proportionate mortalities.
WOMEN 50 25
PERCENT
Note: A shaded bar represents a decline of at least one percentage point between 1970-74 and 1975-78.
FIGURE 4 Deaths from Heart Disease as Per cent of Total Mortality,
Ages 45-64 by Sex; 26 Countries, 1975-1978.
Among men, proportionate mortality has increased appreciably between 1950 and 1978 in most countries. It increased from about 30% to around 40% in countries with initially intermediate ratios and from 20—25% to around 30% in countries with initially low ratios. In the countries with initially high ratios (the US, Canada, Australia and New Zealand), propor-tionate mortalities remained around 40% throughout the 28-year span. In three of these countries and Israel, there were declines in the ratio of at least one percentage point between the first and second half of the 1970's. In Israel, the decline was from 41.5 to 37.0% but, in the three other countries, it was less than two percentage points.
Among women, more countries had declines beyond one percentage point than among men during the 1970's, but none exceeded two percentage points. In contrast to men, proportionate mortality had a tendency to stay the same or to fall between 1950 and 1978. A rise was observed in the Netherlands only but it hardly exceeded one percentage point.
The Sex Ratio for Heart Disease Mortality: Differences by Country and Time Trends
There are large international differences in the male-female ratio (Table 1). These differences are much more marked in 1975-1978 than almost 30 years earlier (1950-1954). The trends suggest that during the entire period the gap between heart disease death rates for men compared with women widened. The male/female ratio of death rates, increased steadily in all countries. In Sweden, for example, the rate for men was a little less than twice the rate for women in 1950—1954 but over four times that for women in 1975—1978. Countries with the most substantial recent declines in the death rate for heart disease and the smallest earlier increases (eg New Zealand, Japan, the US, and Australia) experienced the most modest increases in the sex ratio. In general, the sex ratio tended to increase most in countries with the worst early 'epidemic' of heart disease among males and the smallest recent declines (eg the Netherlands, the Federal Republic of Germany, Norway, Denmark, and Northern Ireland). The male—female ratio for all causes of death other than heart disease increased in 23 of the 26 countries as well but the average per cent change was rarely higher than 3 or 4% and usually substantially lower, in contrast to the average per cent change for heart disease which tended to be above 10%, with only 11 countries below this level. Therefore, the large differences in M/F ratios from country to country and the marked secular changes seem to be characteristic of heart disease.
While heart disease mortality rates in women are not only lower than the male rates but in general also less subject to secular changes, there is a distinct pattern of change so that, by and large, countries which experience decreases among men show a decline in rates among women as well (Figure 5). The trends are shown for the period 1965-1969 to 1975-1978, suggesting a tendency at least in a few countries for increases in rates to go together. There is a further suggestion that greater declines in men are correlated with greater declines in women. The implication would be that responsiveness of heart disease mortality to environmental changes is not confined to men but affects both sexes similarly.
TRENDS IN TOTAL MORTALITY AND MORTALITY FROM HEART DISEASE
TABLE I Male/'femaleratios ofdealh rate(a) forheart disease, ages 45-64 by country in six lime periods from I9S0IO 1978. Average % Couniry 1950-54 1955-59 1960-64 1965-69 1970-74 1975-78 change (b) FIN NOR SWE NET CAN DEN EW FRA SWI FRG US CZE BEL AUS POL NZ AUL IRE N1R SCO ITA SP POR ISR JA YUG
NOTE: Countries ranked according io ratio in 1975-78. (a) Age-adjusted.
(b) Average change every five years based on log linear slope. * Data not available.
517 2.52 2.27 1.88 1.95 2.45 2.08 2.61 1.97 2.41 1.95 2.76 2.08 1.86 * 2.33 2.55 1.47 1.87 2.32 1.44 • * 2.19 1.34 * 3.15 3.01 2.37 2.55 2.83 2.80 3.04 2.32 2.11 2.40 3.10 2.45 2.08 2.57 2.06 2.69 2.80 1.74 2.36 2.62 1.79 • 1.73 2.29 1.48 • 3.34 3.67 2.85 3.32 3.15 3.31 3.36 2.74 2.49 2.80 3.32 2.52 2.51 2.94 2.08 3.01 2.93 2.10 2.74 2.86 2.14 2.03 1.89 2.14 1.61 1.28 3.98 4.21 3.23 3.78 3.45 3.36 3.64 3.02 2.63 3.04 3.52 2.89 2.93 2.99 2.18 3.01 3.03 2.37 3.01 2.96 2.33 2.30 2.25 2.28 1.74 1.57 4.45 4.46 3.96 4.12 3.68 3.50 3.69 3.23 3.20 3.34 3.50 3.12 3.14 3.21 2.71 3.10 3.09 2.75 3.20 2.98 2.58 2.62 2.16 2.34 1.81 1.84 5.00 4.76 4.40 4.29 3.74 3.73 3.66 3.61 3.61 3.57 3.47 3.36 3.30 3.27 3.17 3.16 3.15 3.09 3.08 3.05 2.88 2.84 2.42 2.15 2.09 1.87 + 14.4 + 15.7 + 18.7 + 17.4 + 9.1 + 11.0 + 7.1 + 12.7 + 10.1 + 12.6 + 4.7 + 9.9 + 13.2 + 6.0 + 12.1 + 5.8 + 4.1 + 16.3 + 10.8 + 5.3 + 14.4 + 12.5 + 8.6 0.0 + 8.8 + 14.4 40-P O L *
30- 20-SWE« C Z E #1 0 -,Rc AUS cpITA
EI
N E;g « J ?
s w . «
F |; < ^
0 R DEN s c o w ^ ^ BEL ^ /-i FRA -10" J A * CAN WISH A U L * • -20-US -30-1 -30-1 -30-1 -30-1 M E N • YUG POR • «NIR • EW 1 WOMEN 1-40 -30 -20 -10 00 +10 +20 +30 +40
518 INTERNATIONAL JOURNAL OF EPIDEMIOLOGY
DISCUSSION
Over the years, a large amount of information on inter-national differences in heart disease mortality and secular trends has been collected.|-8-10" It has become
accepted that a large part of the observed differences from country to country is real and not an artefact due to different fashions in death certification and that coronary heart disease, which makes up a major proportion of deaths due to heart disease, has become increasingly common since the beginning of the century. It is implied that these differences and trends must be related to the environment and life styles. Investigation into such hypotheses has begun with the WHO-sponsored MONICA program.12 The aim of the
present study has been to reassess geographical dif-ferences and time trends over the past 30 years more comprehensively, to relate the mortality from heart disease to the patterns of total mortality and to determine if the differences and trends observed are mostly specific for heart disease or whether given environmental settings affect mortality from other causes in the same or different directions. The analysis is confined to 26 countries in the age group 45-64 years. Since a period of almost 30 years (1950-1978) is covered, a category of 'non-rheumatic heart disease and hypertension' was generated because the category 'coronary heart disease' could not have been used on account of changes in the definition of certification over this time span.1-'
Countries were arranged in order of descending total mortality to see if 'heart disease', as defined, would tend to show similar trends. The picture in men and women contrasts sharply. Among women, both total and heart disease mortality rates have declined markedly and to a similar degree in most countries. In men, there has also been a tendency for total mortality to decline, especially during the last two time periods (the 1970's) and the variation between countries in absolute rates is much greater than in women. But, heart disease mortality does not follow total mortality according to any clearly discernible pattern. For example, a country with a relatively high total mortality might have low heart disease mortality (such as France) or a high mortality (such as England and Wales). In the four countries with the lowest total mortality (Denmark, Sweden, the Netherlands and Norway), mortality from heart disease has been rising, especially steeply in the Netherlands and Norway. Nevertheless, there is much overall parallelism between trends in total and heart disease mortality which is to be expected since heart disease accounts for a considerable part of total mortality. In order to make some progress in understanding these differences in level and trends, it
would probably be most productive to take each country by itself, with particular attention to those with seemingly aberrant patterns, and analyse the situation in terms of comparability and reliability of the mortality data and the changes in life style, social conditions and risk factor distributions which have taken place. In this light, the manner in which the data on total and heart disease mortality have been displayed here will be of help in asking proper questions for further probes.
If the heart disease rates are arranged in order of decreasing heart disease mortality (Figure 2) instead of decreasing total mortality (Figure 1), the pattern is more revealing. Once again, the absolute differences in rate between countries are much greater for men than for women. Plotting the rates on an arithmetic rather than logarithmic scale, as done before, focuses attention on absolute rather than percentage dif-ferences. Analyses of secular trends published so far have concentrated mostly on percentage rather than absolute changes. In terms of percentages, the decline in heart disease mortality is, for example, not much less marked in Japan than in the US. In absolute terms, however, the decline is much more striking in the US, so that the saving of lives, starting from a higher level of mortality, is much greater. Moreover and most important, the display of the data in this form makes it apparent that the relative position of a given country along the whole range has not been much affected by upward or downward trends during the past 30 years. The steep decline of coronary heart disease mortality in the US during the 1970's has drawn attention to the analysis of trends in other countries during the same, comparatively short time period.1'5 It is clear, however,
that neither the recent changes, whether upward or downward, nor those during the 1950's or 1960's have materially altered the overall pattern of international differences in heart disease mortality among men, recalling again that 'heart disease', as defined here, is predominantly coronary heart disease. The need remains, therefore, to explain the differences between countries, apart from the secular trends which have taken place. Nothing of what has just been said belittles the importance of recent secular changes. On the contrary, in view of the fact that the changes, in the 1950's and 1960's, with the notable exception of the US and Japan, have been inexorably upward (Figure 2) makes it all the more gratifying when the beginnings of a decline can be noted and all the more essential to discover the reasons for the change. The same reason-ing applies to continureason-ing increases in heart disease mortality which are observed in some of the countries listed and, no doubt, many others around the world,
TRENDS IN TOTAL MORTALITY AND MORTALITY FROM HEART DISEASE 519
not included in the present analysis. Likewise, the uniform decline of heart disease in women in all countries calls as much as ever for an explanation. In this connection, it is important to note that the differences between countries follow a similar pattern in men and women and that the changes in secular trends among men and women are likewise correlated to an appreciable degree (Figure 5). All of these observations suggest that favourable or detrimental components of the environment are not only of decisive importance in determining international differences and secular trends in heart disease mortality but affect both sexes similarly.
Countries with higher mortality tend to have down-ward trends more often and to a greater degree than countries with initially low mortality in which the trend is more frequently upward. We do not attribute this to 'regression to the mean'. This pattern among men is not found in women where the trend is uniformly down-ward, although the decline is little more marked when initial rates are high, as among men. One explanation for this phenomenon could be that countries with a high heart disease mortality have made greater preventive efforts. As suggested before, the best next step would probably be to look at the countries one by one, in order to find the reasons for each secular trend in terms of the conditions prevailing in that country.
Proportionate mortality, the ratio of heart disease to total mortality (Figure 4) is of obvious public health importance because it measures the burden which heart disease contributes to all deaths. In the 'middle age' group under consideration, this proportion varies in both sexes more than is often realized, ranging from below 20% to almost 45% among men. In a country like the Federal Republic of Germany, Belgium or Switzerland, it is around 30% while in other countries of similar social structure like England and Wales, Sweden or the US, proportionate mortality is about 40%. On plotting heart disease mortality against pro-portionate mortality (not shown here), the relationship is close to linear for both sexes so that the higher the death rate from heart disease, the greater is the propor-tion of all deaths which are caused by heart disease. Thus, variations in total death rate are clearly a reflection of variations in heart disease death rates. However, there are interrelationships between death rates from heart disease and other major causes of death so that international differences in total mortality are not due to differences in heart disease mortality alone, as will be shown in the subsequent report. For the present purpose, it is emphasized that the pro-portionate burden of heart disease mortality is less in countries where heart disease mortality itself is lower.
In Western Europe, countries in the north generally have much higher heart disease death rates than do countries in the south. The north/south gradient became even more pronounced over the 28 years. Except for Sweden, Denmark, and Norway, the death rate for heart disease in men in the north exceeds 420 per 100000 population in 1950-1954 compared with rates below 355 in the south. By 1975-1978 rates were above 525 in the north and below 320 in the south. Rates in Sweden, Denmark, and Norway were initially among the lowest, but now they are near 400 per 100000 population. Countries in the middle of Europe, Belgium, the Netherlands, and the Federal Republic of Germany were in the mid to low range in heart disease mortality. A similar north/south gradient is seen in women. No such gradient is seen for total mortality or for the combined causes of death other than heart disease. Problems in comparability of caus'e-of-death statistics among countries could account for some of the differentials in heart disease mortality, but one would have expected such problems to become less important with time. Yet, the north/south gradient widened; a phenomenon that should be investigated.14
Lastly, the present analyses have yielded some new data on the sex ratio for heart disease (Table 1). It is evident from Figure 2 that there are large differences in the sex ratio from country to country. This has been well known for some time. Finland, Norway, Sweden, and the Netherlands have heart disease death rates that are at least three times higher in men than women in the 45-64 year age group. Along with Israel 'and Japan, some countries in the southern part of Europe, Italy, Spain, Portugal, and Yugoslavia, have male/female ratios ranging from 1.87 to 2.88, lowest among the 26 countries. A systematic analysis of the secular trends in the male/female ratio has shown that the ratio has increased in every country except Israel between 1950 and 1978. The variation among the countries widened substantially over the 28-year period as all countries except Israel showed substantial increases. In 1950-1954 ratios were above 2.00 in only 12 countries and none were above 3.00, whereas, in 1975-1978 there were 25 sex ratios above 2.00 and 20 were 3.00 or greater. Increases resulted from the epidemic rise in the death rate for men in the earlier years and the long-term decline for women. There is a tendency for the increase to have been greater in countries with higher ratios in 1975-1978. Likewise, the ratio tends to be higher in countries with higher heart disease mortality rates in men. Therefore, the male/female ratio has risen more in countries with higher mortality from heart disease. This supports the notion that men react relatively more strongly than women to an environment which favours
520 INTERNATIONAL JOURNAL OF EPIDEMIOLOGY
heart disease. Variation among countries and increases
over time in the sex ratios of death rates for causes
other than heart disease are quite modest compared
with the patterns in sex ratios for heart disease
described above. Only in England/Wales, Northern
Ireland, and the US has the trend turned downwards in
recent years.
The original aim of this analysis of international
differences and trends in mortality has been to relate
deaths due to heart disease to other causes of death, to
seek similarities and differences in secular trends
between these diseases and to determine which diseases
are affected by environmental changes in the same way,
opposite directions or not at all over the 30-year time
span covered. Several findings are new, particularly
those on secular trends, or document known
observa-tions more comprehensively, like those on
propor-tionate mortality and the sex ratio. The data have
yielded a perspective on long-term trends in heart
disease which have not been evident previously.
View-ing secular trends for coronary heart disease durView-ing the
1970's with regard to percentage changes obscures the
fact that absolute changes in heart disease mortality
rates since 1950 have had, from the point of view of
international differences, little effect on the relative
position of a given country along the scale of
descend-ing mortality. It should not be concluded from this by
any means that coronary heart disease mortality rates
for a given country are more or less immutably fixed
within relatively narrow limits. On the contrary, the
fact that comparatively slight changes in the
environ-ment could cause appreciable changes in death rates,
whether upward or downward, indicates that more
concerted rather than largely incidental preventive
efforts are likely to have a more profound impact.
Nevertheless, presenting levels and trends in the way
shown (Figure 2) may help in providing estimates for
what might be expected in the future from prevention
in different countries. The ultimate need is to
understand the reasons for the observed changes.
REFERENCES
1 Havlik R J, Feinleib M. Proceedings of the Conference on the
Decline in Coronary Heart Disease Mortality. NIH Publication No. 79-1610, US Department of Health, Education, and Welfare, Washington, D.C., 1979.
2 Epstein F H. Coronary heart disease: Geographic differences and current trends. In: Schettler G, Gotto A N, Middelhoff G, Habenicht A J B, Jurutlea K R (eds). Atherosclerosis. Berlin, Springer-Verlag, 1983: 772-82.
^ Junge B, Hoffmeister H. "Civilization-Associated" diseases in Europe and industrial countries outside of Europe: Regional differences and trends in mortality. Prev Med 1982; I I : 117-30.
4 Marmot M G, Booth M, Beral V. International trends in heart
disease mortality. In: Gotto A M, Paolietti R, Atherosclerosis
Reviews. New York, Raven Press, 1982: pp 19-27.
^ Pisa Z, Uemura K. Trends of mortality from ischaemic heart disease and other cardiovascular diseases in 27 countries. 1968—1977.
World Health Slat Q 1982; 35: 11-47.
6 Salonen J T, Vohlonen I. Longitudinal cross-sectional analysis of coronary mortality. Int J Epidemiol 1982; 11: 229-38.
7 Feinleib M, Havlik R J, Thorn T J. The changing pattern of ischemic heart disease. Cardiov Med 1982; 7: 139-48.
8 Thorn T J, Kannel W B, Feinleib M. Factors associated with the decline in coronary heart disease mortality in the United States. In: Connor W F, Bristow J D (eds). Coronary Heart
Disease. Philadelphia, J. B. Lippincott Company (In press),
1985.
9 Thorn T J, Epstein F H, Leaverton P E, Feldman J. Trends since
1950 for the major causes of death in 26 countries (in prepara-tion).
10 Keys A. Coronary heart disease—The global picture.
Athero-sclerosis 1975; 22: 149-202.
" Stamler J. Population studies, in nutrition, lipids, and coronary
heart disease: A global view. Levy R I, Rifkind B M, Dennis
B H, Ernst N D (eds). New York, Raven Press, 1979.
12 World Health Organization. Proposal for multinational monitoring
of trends and determinants in cardiovascular disease and protocol (MONICA Project). Geneva, 1983. (Unpublished WHO Document WHO/MNC/82.1 Rev. 1).
13 Clayton D G, Taylor D, Shaper A G. Trends in heart disease in
England and Wales, 1950-1973. Health Trends 1977; 9: 1-6.
14 Keys A. Coronary heart disease in seven countries. Circulation 1970; 41 (Suppl. 1)4: 1-211.