ORIGINAL PAPER
Evaluation of different calibration strategies for the analysis
of pure copper and zinc samples using femtosecond laser
ablation ICP-MS
Heike Traub&Markus Wälle&Joachim Koch& Ulrich Panne&Ralf Matschat&Heinrich Kipphardt& Detlef Günther
Received: 26 June 2009 / Revised: 7 August 2009 / Accepted: 11 August 2009 / Published online: 12 September 2009
# Springer-Verlag 2009
Abstract Solution-doped metal powder pellets as well as aspirated liquids were used as calibration samples to analyze pure copper and zinc certified reference materials (CRMs) by femtosecond laser ablation ICP-MS. It was demonstrated that calibration by copper pellets resulted in relative deviations up to 20%, whereas fs-LA-ICP-MS among copper-based CRMs led to inaccuracies in the same range unless nominal mass fractions were chosen to be <3 mg/kg. Calibration by zinc pellets generally provided better accuracy. Depending on the analyte considered, devia-tions below 10% were obtained even for mass fracdevia-tions close to the limit of quantification. Our data, therefore, indicate solution-doped metal powder pellets to be suitable as calibration samples for fs-LA-ICP-MS of metals. Further-more, the utilization of liquid standards for calibration was found to result in stronger deviations of up to 50% for both copper and zinc samples which, in addition, turned out to be dependent on the plasma conditions.
Keywords Laser ablation . ICP-MS . Calibration . Copper . Zinc . Metal
Introduction
The availability of calibration samples for laser ablation inductively coupled plasma mass spectrometry (LA-ICP-MS) has always been a point of great concern and tremendous efforts have been made to figure out potential alternatives. A compilation of these standards as well as their respective mass fraction values can be found, for instance, in the GeoReM database for geological and environmental reference materials [1]. Nonetheless, a recent study by Luo et al. [2] revealed a major contribution of the uncertainty of contents in the reference materials compared to the over-all uncertainty budget achievable by LA-ICP-MS. In particular, “pure” materials with trace element mass fractions in the low milligram per kilogram range or below are difficult to provide. One way out of this restriction might be the usage of doped powder pellets. Pellets composed of, e.g., metal or ceramic powders, have been applied for quite a long time to serve as calibration samples for direct current glow discharge optical emission spec-trometry (dc-GD-OES) [3, 4], glow discharge mass spectrometry (GD-MS) [5–7], or LA-ICP-MS [8–14], respectively. However, the utilization of metal pellets for analyses by LA-ICP-MS has not yet been successfully accomplished due to difficulties of suppressing material redistribution during the LA process, which results in the formation of non-stoichiometric aerosols if nanosecond (ns) laser sources are used [15]. Compared to this, femtosecond (fs)-LA of metals has been found to cause less “thermal damage” and, thus, to allow the generation of aerosols that H. Traub (*)
:
U. Panne:
R. Matschat:
H. KipphardtBAM Federal Institute for Materials Research and Testing, Richard-Willstaetter-Strasse 11,
12489 Berlin, Germany e-mail: [email protected] M. Wälle
:
J. Koch:
D. Günther (*)ETH Zurich, Laboratory of Inorganic Chemistry, Wolfgang-Pauli-Strasse 10,
8093 Zurich, Switzerland
e-mail: [email protected] U. Panne
Department of Chemistry, Humboldt-Universitaet zu Berlin, Brook-Taylor-Strasse 2,
12489 Berlin, Germany
Anal Bioanal Chem (2009) 395:1471–1480 DOI 10.1007/s00216-009-3061-9
exactly match the composition of the bulk material [16]. X-ray fluorescence spectrometry (XRF), GD-OES, and, above all, spark-optical emission spectrometry (spark-OES) are widely used routinely for the bulk analysis of metallic samples like copper and zinc alloys, e.g., to ensure the product quality, but the limits of detection (LODs) are often not sufficiently low, especially for the analysis of pure metals. LA-ICP-OES gives LODs comparable to spark-OES [17]. GD-MS and LA-ICP-MS are promising alternatives providing LOD in the microgram per kilogram range [18, 19]. A problem is that LA-ICP-OES/MS does often not provide accurate results due to laser-induced fractionation effects, particularly if ns-LA is used for the analysis of metallic samples like Cu–Zn alloys [20–28]. To overcome this limitation, fs-LA systems are increasingly used since several years [29]. All direct solid sampling techniques mentioned before allow multi-element analysis, but require suitable calibration procedures for accurate quantification of element mass fractions with small uncertainties.
This work aims to evaluate the suitability of femtosecond LA-ICP-MS to analyze pure Cu and Zn samples with liquid-doped Cu- and Zn-based powder pellets as calibration samples, respectively. Doping metal powders by solutions of analytes results in an improved micro-homogeneity in the distribution of the dopants compared to analytes admixed in powdered form. This advantage is especially conspicuous in case of very-low-analyte mass fractions in the doped samples, alone in view of the statistical distribution of a low number of single-analyte powder particles. However, a possible disadvantage of liquid doping can be a different thermal behavior of analyte metal salts and matrix metal powders because of different boiling points [15].
Considering the literature published on LA-ICP-MS quantification strategies, there is a growing interest in utilizing liquid standards for calibration [30–33] since this strategy allows autonomy and, thus, maximum flexibility. Due to the size-dependent composition of laser-produced particles, however, this approach occasionally yields inconsistent data and might, therefore, be not considered adequate for the
analysis of any kind of material. Nevertheless, accuracies of better than 5% have recently been reported for, e.g., main constituents of metal alloys or some traces in gold or silicate glass [34, 35]. Another advantage is that both calibration strategies directly fulfill the demands of metrological traceability [36] to the International System of Units (SI) as required by ISO/IEC 17025 [37].
Experimental
Preparation of solution-doped metal powder pellets Pellets to be analyzed were produced from metal powders with a nominal metallic purity of >99.999% and grain sizes of <140 and <150 µm for copper and zinc, respectively, by doping by a defined volume of a multi-element solution (in 1% nitric acid) with known analyte concentrations. The doped powders were dried by IR-radiation, homogenized using the 8000D Mixer/Mill (SPEX Industries, Metuchen, NJ, USA), and pressed to pellets by steel tools using a pressure of 0.9 GPa. The resulting pellets (mass∼1 g) had a diameter of ∼12 mm and a thickness of ∼2 mm. A more detailed description of the production procedure can be found in [7]. Dopants and their mass fractions are listed in Table1. Certified reference materials used
Several copper and zinc CRMs from BAM and IRMM [38–40] were used as calibration samples or as analytical samples to verify the accuracy of the different calibration strategies (Table2). For the LA analysis, the CRMs were cut into smaller pieces to place up to nine samples inside the ablation cell. Preparation of standard solutions
A set of standard solutions was prepared for the copper and the zinc matrix, respectively. The solutions contained 10 mg/L of Cu or Zn for partial matrix matching and as
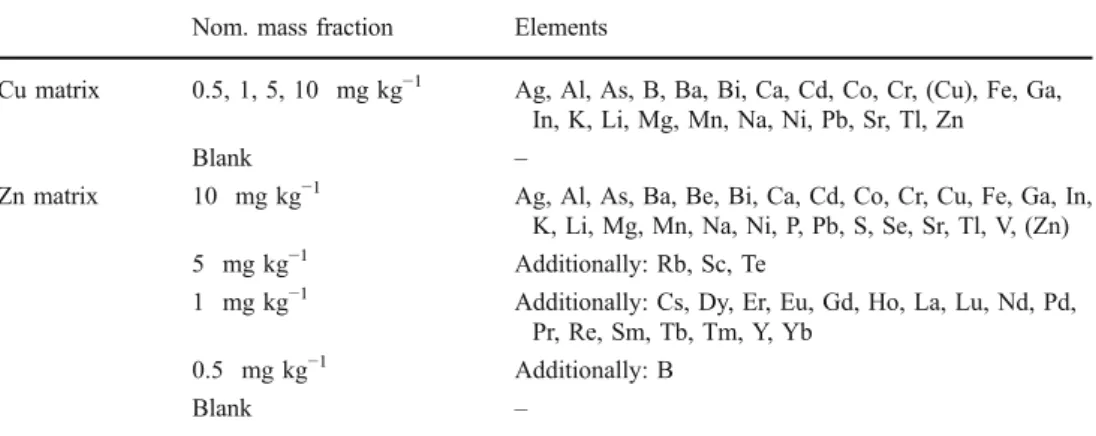
Nom. mass fraction Elements
Cu matrix 0.5, 1, 5, 10 mg kg−1 Ag, Al, As, B, Ba, Bi, Ca, Cd, Co, Cr, (Cu), Fe, Ga, In, K, Li, Mg, Mn, Na, Ni, Pb, Sr, Tl, Zn
Blank –
Zn matrix 10 mg kg−1 Ag, Al, As, Ba, Be, Bi, Ca, Cd, Co, Cr, Cu, Fe, Ga, In, K, Li, Mg, Mn, Na, Ni, P, Pb, S, Se, Sr, Tl, V, (Zn)
5 mg kg−1 Additionally: Rb, Sc, Te
1 mg kg−1 Additionally: Cs, Dy, Er, Eu, Gd, Ho, La, Lu, Nd, Pd, Pr, Re, Sm, Tb, Tm, Y, Yb
0.5 mg kg−1 Additionally: B
Blank –
Table 1 Solution-doped metal powder pellets used
internal standard resulting in about two orders of magnitude lower signal intensities compared to the ones obtained by LA. Other elements of interest were split to four different solutions with concentrations of 1, 2, 5, and 10 µg/L for Cu, and 2, 5, 20, and 100 µg/L for Zn, providing similar signal intensities as the CRMs. All solutions were prepared in 1% sub-boiled nitric acid.
Instrumentation and experimental parameters for fs-LA-ICP-MS
For LA, a Ti:sapphire femtosecond laser system (Legend, Coherent Inc., Santa Clara, CA, USA) operated at its fundamental wavelength at 795 nm (pulse duration <150 fs), with a pulse energy of 2.4 mJ and a repetition rate of 10 to 50 Hz was used. The laser beam was focused by a plano-convex lens (f=75 mm) onto the sample surface. The focal point was placed slightly below the sample surface to avoid distorted crater shapes [41] and to control the crater size. Crater sizes were adjusted to comparatively large diameters of 300 to 600 µm to compensate for the heterogeneity of the powder pellets due to the powder grain size, and to increase the amount of material for analysis. The laser fluence was between 3.4 J cm−2 (crater diameter 300 µm) and 0.85 J cm−2(crater diameter 600 µm), respectively. All samples to be analyzed were placed inside a cylindrical cell with 40 cm3 volume. The copper pellets were ablated applying a 10 µm/s rastering mode, whereas the zinc pellets were ablated in single-hole drilling mode, due to a more homogeneous distribution of the doped elements in the zinc powder pellets compared to the copper ones (see also Fig.2). A quadrupole ICP-MS system (Elan DRC II, PerkinElmer SCIEX, Thornhill, Canada) was used to monitor the elemental composition of laser-produced aerosols. In Table3, the instrumental settings chosen throughout this study are shown. Aerosols were transported using 1 L/min helium as carrier gas mixed with the nebulizer gas (Ar) behind the cell
using a laminar flow adapter. The measured isotopes are specified in Table4.
To avoid detector saturation while measuring the matrix elements Cu or Zn, the respective mass to charge ratios were acquired with a higher resolution by reducing the peak width from 0.7 amu to approximately 0.3 amu, which decreased the count rate by at least two orders of magnitude. A higher mass resolution was also applied to measure the Cu content in Zn matrices due to the low abundance sensitivity on the copper isotopes, which were interfered by neighboring Zn isotopes. However, even reducing the peak width to 0.3 amu made a correction of Cu signals for the Zn abundance sensitivity necessary. For this purpose, the mass spectra of the Cu isotopes were scanned across their corresponding isotope mass in an interval of ±0.25 amu in steps of 0.05 amu. Subsequently, the Zn background contributing to the Cu isotopes was determined by an exponential fit on the non-Cu affected masses, i.e., all points except the isotope mass itself and the masses ±0.05 around the isotope.
A gas blank was measured for 30 to 60 s prior to LA. One CRM or one powder pellet was measured twice in the beginning and the end of each series to monitor and correct for instrumental drifts. The quantification was accom-plished using either powder pellets or CRMs as calibration samples. Prior to calibration using powder pellets, all pellet data acquired were blank-pellet corrected.
For liquid calibration, aspirated standards (using a concen-tric 100 µL/min self-aspirating microflow nebulizer and a cyclonic spray chamber) were admixed to the LA-aerosol transport tube right in front of the ICP-MS. During calibration, no LA was performed whereas a blank solution (1% nitric acid) was aspirated whenever LA-ICP-MS analyses were carried out in order to maintain“wet” plasma conditions. Measurement of particle size distribution
To identify structural differences of aerosols released by LA of pellets and CRMs, particle size distributions were measured by optical particle counting (OPC; HS-LAS, Denver, CO, USA). Prior to OPC detection, the aerosols were diluted by a factor of approximately 200 using a bucket wheel-type device (MD19-li, Matter Engineering AG, Wohlen, Switzerland) to keep the particle count rate sufficiently low and, thus, to avoid coincidences.
Table 2 CRMs used
Mass fractions of the determined elements in mg kg−1
Pure copper BAM-M382a 0.53 (Bi) to 6.0 (Zn)
Pure copper ERM-EB383a 1.02 (Bi) to 7.8 (Zn)
Pure copper ERM-EB384a 3.34 (Bi) to 14.6 (Mg)
Pure copper ERM-EB385a 5.8 (Cd) to 58 (Zn)
Pure zinc BAM-M601a 0.55 (Cd) to 15.7 (Pb)
Unalloyed zinc ERM-EB322b 5.28 (Tl) to 19.1 (Fe) Unalloyed zinc ERM-EB323b 6.51 (Cd) to 48.6 (Pb)
a[38,39]
b[40]
Table 3 ICP-MS Elan DRC II parameters
LA Liquid calibration
Plasma power 1400 W 1400 W
Nebulizer gas flow (Ar) 0.75 L/min 0.6–0.8 L/min
Auxiliary gas flow (Ar) 0.75 L /min 0.8 L/min
Results and discussion
Applicability of the matrix element and its argide as internal standard
Initially, the suitability of the matrix elements copper or zinc and their corresponding argides (CuAr+, ZnAr+) as internal standard was evaluated. In Fig.1, the evolution of relative sensitivities of 59Co+/65Cu+ and 59Co+/65Cu40Ar+ measured over a few hours of analysis is shown.1 Deviations were up 75% at the beginning but tend to stabilize after a few minutes of LA. However, in the course of analysis, heavy deposition of Cu particles on the sampler and skimmer cone and partial clogging of their orifices resulted in shifts of the signal ratios, which was most pronounced on the X+/CuAr+ratios. In fact, the diameter of the sampler orifice at the end of analysis was only half as wide as in the beginning due to a high aerosol mass throughput, which was estimated to be in the range of 1 µg/s. Therefore, the matrix element copper or zinc measured in higher resolution (0.3 amu peak width) was used as internal standard and the cones were cleaned daily. By lowering the repetition rate to 10 Hz (e.g., used for the zinc measurements) the amount of material ablated and therewith the deposition on the cones could be reduced.
Nonetheless, the argides could have been used as internal standard, if after an initial stabilization period of the plasma of about 1 h to reach a constant plasma temperature, only short measurement series of about eight spots was analyzed. In fact, similar spot to spot RSDs of the relative sensitivities ICo/ICu/wCo and ICo/ICuAr/wCo of 5%
and 7% were found, as displayed in Fig.1.
Calibration using solution-doped powder pellets and CRMs Homogeneity of the calibration samples
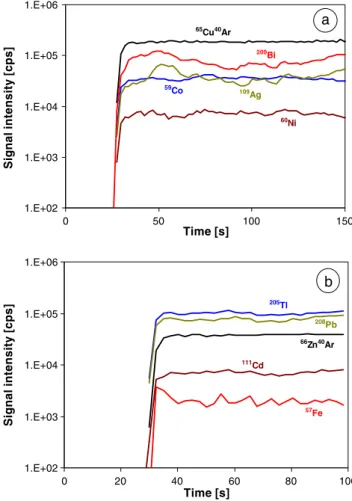
In Fig.2, the transient signals of several dopants measured by raster-mode fs-LA-ICP-MS (raster speed, 10 µm/s, averaging over five points) of copper and zinc powder pellets are shown. The Zn pellets appear to be sufficiently homogeneous over the scan range set, with RSDs of the
dopants of 5% (Al) to 10% (Pb) by an RSD of 2.7% for
68
Zn. However, the Cu pellets showed stronger variations expressed in RSDs in the range from 9% (Mn) up to 25% (Ag) by an RSD of 2% for 65Cu, but are still suitable as calibration samples. Comparable RSDs (5–25%) were observed using single-hole drilling. The homogeneity of the analyte distribution in the copper and zinc CRMs is sufficient for most of the investigated analytes (RSDs typically between 5% to 10%) using either line scanning or single-hole drilling, whereas micro inhomogeneities were detected for Al, Mg, Ti, and Zr in the BAM copper CRMs [15]. The precision of different line scans (Cu pellets) or single-hole drilling measurements (CRMs and Zn pellets) were in the same range as within one measurement (each with four to five replicates). The homogeneity of the metal powder pellets is slightly worse compared to the CRMs due the fact that the analytes in the pellets are mainly distributed as metal salts on the Cu or Zn grains (grain sizes <140 µm and <150 µm, respectively). By contrast, the analytes in the compact CRMs are usually alloyed with the Cu or Zn matrix.
Results using calibration with either doped powder pellets or CRMs
The solution-doped powder pellets were used as calibration samples. The correlation coefficients of the calibration curves from LA-ICP-MS analysis of the Cu or Zn pellets with increasing mass fractions were mostly better than 0.99, suggesting linearity. In Fig. 3, the calibration of Pb using the Zn pellets as calibration samples is shown as an example. On the basis of these calibration curves, the CRMs were quantified. By comparison, the approach proposed by Longerich et al. [42] was applied using ERM-EB384 and ERM-EB322 as calibration sample for Cu and Zn matrices, respectively. These CRMs were chosen as their analyte mass fractions are within the mass fraction range covered by the other CRMs.
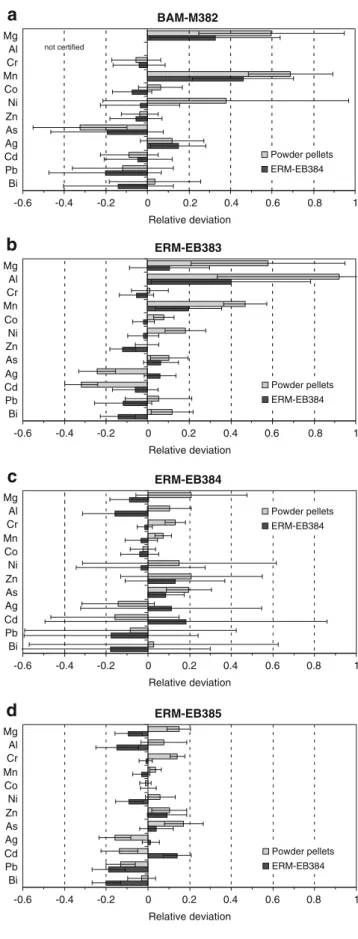
The relative deviations of the mass fractions, summa-rized in Fig. 4 for the Cu matrix and Fig. 5 for the zinc matrix, were calculated from the deviations between the measured and the certified values using either the powder pellets or one of the CRMs as calibration samples. The latter approach means the quantification of ERM-EB384 or ERM-EB322 with itself, as shown in Figs. 4c and 5 Cu matrix 7Li,23Na,24, (25)Mg,27Al,52, (53)Cr,55Mn,59Co,(58,) 60Ni,68Zn,71Ga,75As,
88
Sr,(107,) 109Ag,111Cd,115In,137Ba,205Tl,(206,) 208Pb,209Bi, internal standard
65
Cu (63Cu,63Cu40Ar,65Cu40Ar)
Zn matrix 7Li,9Be,25Mg,27Al,45Sc,51V,52Cr,55Mn,57Fe,59Co,60Ni,(63,) 65Cu,71Ga,75As, 77
Se,85Rb,88Sr,105Pd,(107,) 109Ag,111Cd,125Te,133Cs,137Ba,185Re,(203,) 205Tl,
206, 207, 208
Pb,209Bi, internal standard66Zn (68Zn,66Zn40Ar,68Zn40Ar) Table 4 Measured isotopes
Isotopes in parentheses were measured for monitoring purposes
1
All nine copper samples were placed inside the ablation cell, which was not opened during the whole measurement.
(bottom), revealing a reproducibility below 20% for the Cu and 5% for the Zn matrix, respectively.
Using the Cu pellets for the calibration, the deviation decreased with increasing mass fractions of trace elements
(Fig. 4). Nonetheless, for Mg, Al, and Mn the deviation remained severe (50 to 90%), particularly, for mass fractions below 3 mg/kg, which, in case of Mg and Al, could be partly explained by an incorrect blank correction with the blank powder pellet, indicated by smaller relative deviations when using non-blank-pellet corrected data for calibration. This may be caused by a difference in the gas blank and the hypothetical ablation blank originated by changes in the polyatomic interferences on these masses due to a plasma temperature change induced by heavy mass load from the LA. Furthermore, the Ag/Cu and Cd/Cu signal ratios experienced pronounced drifts, i.e. a stronger decrease in the Ag and Cd signal intensities compared to the Cu intensity was observed, becoming clearly visible to the end of the series while measuring the powder pellet with a nominal mass fraction of 10 mg/kg. This indicates a
1.E+02 1.E+03 1.E+04 1.E+05 1.E+06 0 50 100 150 Time [s] Signal intensity [cps] 65Cu40Ar 209Bi 60Ni 109Ag 59Co a 1.E+02 1.E+03 1.E+04 1.E+05 1.E+06 0 20 40 60 80 100 Time [s] Signal intensity [cps] 66Zn40Ar 111Cd 57Fe 205Tl 208Pb b
Fig. 2 Transient signals acquired during raster-mode LA-ICP-MS of 5 mg/kg-doped Cu (a) and Zn (b) pellets. Before the ablation of the pellets a gas blank was measured (about 30 s). Signal smoothing was done by five points averaging
0 0.00002 0.00004 0.00006 0.00008 0.0001 0.00012 0.00014 0 0.5 1.5 2.5 3.5 4 Measurement time [h] ICo /ICu /w Co [(mg/kg) -1 ] 0 0.01 0.02 0.03 0.04 0.05 0.06 0.07 ICo /ICuAr /w Co [(mg/kg) -1 ] Co/Cu Co/CuAr 1 2 3
Fig. 1 Evolution of relative sensitivities for59Co+/65Cu+and 59
Co+/65Cu40Ar+measured over a few hours of analysis using a laser repetition rate of 50 Hz for 180 s and a rastering speed of 10 µm/s. Each data point repre-sents a single measurement. Squares refer to CRMs and triangles to powder pellets. In the period between 1.2 and 1.5 h, three blank powder pellets were measured Pb calibration y = 0.0027x + 3E-05 R2 = 0.9999 0 0.005 0.01 0.015 0.02 0.025 0.03 0 4 8 10 12 w (Pb) [mg/kg] Intensity ratio (Pb/Zn) 2 6
Fig. 3 Pb-specific calibration curve built form the analysis of solution-doped Zn pellets. Error bars are the standard deviation of the average from five measurements. The uncertainty of the 5 and 10 mg/kg value can be explained by the homogeneity of the sample, reflected in a RSD of ∼10% of the Pb signal in rastering mode ablation as shown in Fig.2for the 5 mg/kg pellet as typical example
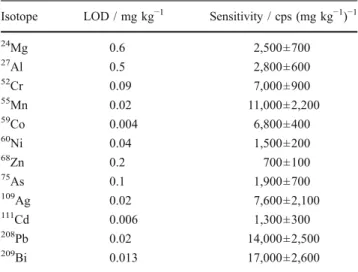
lower extraction efficiency of Ag and Cd ions from the plasma towards the MS caused by a reduction of the cone orifice diameter by clogging and a higher radial spread of these ions over the plasma originating by higher diffusion due to a faster ionization. Therefore, the 10 mg/kg calibration point was excluded for these two elements, because a linear drift correction was not able to deal with the clogging effect occurring by the end of the measure-ment series where the 10 mg/kg pellet was analyzed. The limits of detection (LODs) for the copper matrix estimated on the basis of the standard deviations of the intensity ratios (X+/Cu+) from measurements of the blank powder pellet were given in Table5 together with the sensitivity values. Depending on the operating parameters and the sensitivity of the detection system (quadrupole or sector-field mass spectrometer) comparable LODs could be achieved using nanosecond LA [15]. However, a better laser ablation efficiency (ratio of amount of sample removed to laser pulse energy) is realized by using fs-LA systems.
The calibration by Zn pellets provided relative devia-tions of <10% except for Fe and Cd in CRM BAM-M601 (certified mass fractions of 2.2 mg/kg (Fe) and 0.55 mg/kg (Cd)), as shown in Fig.5. Since a similar trend was already observed by quantification with Zn CRM ERM-EB322, these deviations probably arose from measuring close to the limit of quantification (for Fe and Cd: 1 mg/kg and 0.57 mg/kg, respectively, calculated on the basis of the standard deviations of the signal ratios (X+/Zn+) from five measurements of the blank powder pellet). These inac-curacies could also originate from a wrong background correction, based on the assumption that the imaginary background signal during laser ablation is the same as the gas blank as already observed for Mg and Al in the Cu matrix. The estimated limits of detection (LODs) for the isotopes investigated in the zinc matrix as well as the sensitivity values are given in Table6.
It should be stressed that the quantification of Pb mass fractions using Zn pellets turned out to be not as straightforward as for other analytes because a comparison of the isotopic composition of the CRMs and the pellets revealed deviations of up to 10.7% (206Pb). Therefore, the three main Pb isotopes were taken into account for quantification. In Fig.6, the correlation of 207Pb/208Pb vs.
BAM-M382 -0.6 -0.4 -0.2 0 0.2 0.4 0.6 0.8 1 Mg Al Cr Mn Co Ni Zn As Ag Cd Pb Bi Relative deviation
a
ERM-EB383 -0.6 -0.4 -0.2 0 0.2 0.4 0.6 0.8 1 Mg Al Cr Mn Co Ni Zn As Ag Cd Pb Bi Relative deviation Powder pellets ERM-EB384b
ERM-EB384 -0.6 -0.4 -0.2 0 0.2 0.4 0.6 0.8 1 Mg Al Cr Mn Co Ni Zn As Ag Cd Pb Bi Relative deviation Powder pellets ERM-EB384c
ERM-EB385 -0.6 -0.4 -0.2 0 0.2 0.4 0.6 0.8 1 Mg Al Cr Mn Co Ni Zn As Ag Cd Pb Bi Relative deviation Powder pellets ERM-EB384d
Powder pellets ERM-EB384 not certified
Fig. 4 Relative deviations between the measured mass fractions and the certified values for different copper CRMs (a–d), using the solution-doped powder pellets and the CRM ERM-EB384 as calibration samples. In the case of the quantification of ERM-EB384 with ERM-EB384, different measurements were performed for calibration and “sample”. The error bars represent the relative combined standard uncertainty. The relatively high confidence interval for ERM-EB384 arise from the limited number of “sample” measurement compared to the others, due to the usage of the other ERM-EB384 measurements as calibration points206
Pb/208Pb is plotted for two Zn pellets and the Zn CRMs, illustrating the different clustering of Pb isotopes. These isotope ratio variations are unlikely caused by laser- or ICP-induced fractionation effects as discussed by Horn and von Blanckenburg [43], due to (a) a similar particle size distribution of LA-aerosol, as shown in Fig. 7, (b) the absence of this effect on the thallium isotopes and on the lead isotopes in the copper matrix, and (c) the opposite behavior of the 207Pb/208Pb and 206Pb/208Pb ratio. There-fore, the presence of different lead isotope ratios in the CRMs and powder pellets is more likely. In general, it
could be shown that the calibration with Zn pellets gave accurate results for different Zn CRMs from diverse producers.
Measurement of the aerosol particle size distribution The agreement of measured and certified mass fractions for the Cu and the Zn matrix already suggests that the aerosols formed during analysis of pressed pellets and conventional CRMs are similar. To provide further evidence about the structural similarity of aerosols released by fs-LA of pressed, i.e., “adhesive” metal grains (with analyte salts on the surface of the grains) and “cohesive” solid states (analytes in elemental form or alloyed with copper or zinc), their particle size distribution was measured by optical particle counting. In Fig.7, a series of particle size distributions showed, on the one hand, no significant differences among CRMs and solution-doped pellets. On the other hand, aerosols produced by fs-LA of Zn, apparently, resulted in an increased formation of nanometer particles. These findings are consistent with the assumption
0.4 0.41 0.42 0.43 0.44 0.45 0.44 0.45 0.46 0.47 0.48 0.49 206 Pb/208Pb 207 Pb/ 208 Pb CRM Powder pellets
Fig. 6 Intensity ratios of different Pb isotopes for Zn CRMs (BAM-M601, ERM-EB322, and ERM-EB323) and powder pellets (5 and 10 mg/kg) -0.2 -0.1 0 0.1 0.2 0.3 0.4 0.5 Relative deviation Powder pellets ERM-EB322 BAM-M601 ERM-EB322 ERM-EB323 Fe Cu Cd Tl Pb Fe Fe Cu Cu Cd Cd Tl Tl Pb Pb
Fig. 5 Relative deviations using Zn pellets or CRM ERM-EB322 as calibration samples. CRMs and pellets were four and five times measured, respectively. The 0.5 mg/kg-doped powder pellet was excluded for the Fe calibration. The error bars represent the relative combined standard uncertainty
Table 5 Limits of detection (LODs) and sensitivity values for the Cu matrix
Isotope LOD / mg kg−1 Sensitivity / cps (mg kg−1)−1 24 Mg 0.6 2,500±700 27 Al 0.5 2,800±600 52Cr 0.09 7,000±900 55Mn 0.02 11,000±2,200 59Co 0.004 6,800±400 60Ni 0.04 1,500±200 68Zn 0.2 700±100 75 As 0.1 1,900±700 109 Ag 0.02 7,600±2,100 111 Cd 0.006 1,300±300 208 Pb 0.02 14,000±2,500 209 Bi 0.013 17,000±2,600
The LODs were estimated on the basis of the intensity ratios from four measurements of the blank powder pellet. The sensitivity is the average over the measured doped powder pellets and the CRMs with the corresponding standard deviation
Table 6 Limits of detection (LODs) and sensitivity values for the Zn matrix
Isotope LOD / mg kg−1 Sensitivity / cps (mg kg−1)−1 57 Fe 0.3 140±30 65 Cu 0.4 200±30 111 Cd 0.2 590±90 205 Tl 0.0012 9,700±1400 208 Pb 0.005 7,500±1100
The LODs were estimated on the basis of the intensity ratios from five measurements of the blank powder pellet. The sensitivity is the average over the measured doped powder pellets and the CRMs with the corresponding standard deviation
of aerosols to a large extent be formed by condensational growth. In fact, Zn, as the more volatile compound, passes the critical point for condensation at a later, i.e.,“cooler” plasma stage. As a consequence, the remaining time for the Zn atoms to form nuclei and particles is shorter, compared to Cu. Calibration using nebulized standard solution
In addition to the calibration using either doped powder pellets or CRMs the applicability of liquid standard calibration for the trace element analysis in pure Zn and Cu samples was investigated. When non-desolvated stan-dard solutions (in 1% nitric acid) were used for calibration in LA interferences arising from molecular ions containing hydrogen, nitrogen and oxygen have to be taken into account. Prior to analysis, the same ICP-MS tuning protocol was executed as described in [34], which included reducing the Th oxide rate to values of <3% and maximizing the sensitivity over the whole mass range. In Particle size [µm] 0.05 0.075 0.1 0.2 0.3 0.4 0.5 0.75 1 dV/dr [rel. unit] 0 100 200 300 400 500 EB 322 P Zn P Cu EB 384
Fig. 7 Particle size distributions of aerosols generated by fs-LA of Cu and Zn powder pellets (P Cu and P Zn) and CRMs (Zn ERM-EB322 and Cu ERM-EB384). The peak at 0.2 µm represents a measurement artifact due to a jump in the corresponding channel width
-0.5 0 0.5 1 Li Na Al Cr Mn Co Ni Zn Ga Sr Ag Cd In Ba Tl Pb Bi Relative deviation
5 mg/kg pellet; neb. gas flow: 0.65 L/min ERM-EB384; neb. gas flow: 0.65 L/min 5 mg/kg pellet; neb. gas flow: 0.8 L/min ERM-EB384; neb. gas flow: 0.8 L/min
a Cu -0.5 0 0.5 Li7 Be9
Mg25 Al27 Sc45 V51 Cr52 Mn55 Co59 Ni60 Ga71 As75 Se77 Rb85 Sr88
Pd105* Ag109 Cd111 Te125 Cs133* Ba137 Re185* Tl205 Pb208 Bi209
Relative deviation
Neb. gas flow: 0.6 L/min Neb. gas flow: 0.65 L/min Neb. gas flow: 0.7 L/min Neb. gas flow: 0.75 L/min
b Zn
Fig. 8 Relative deviations of two 5 mg/kg (*or 0.5 mg/kg) doped Cu (a) and Zn pellets (b) and Cu ERM-EB384 (a) using liquid standards for calibration at different nebulizer gas flow rates. Error bars represent the standard deviation of the average (three measurements).
The deviations observed for Sr and Ba are most likely a result of heterogeneities of the pellets used since corresponding data were also subject to a large experimental scatter
addition, the U/Th signal ratio was adjusted to one for both (a) LA of NIST SRM610 (glass) and aspiration of the blank solution and (b) aspirated standard solutions containing these two elements with the same concentration ratio, which led to a nebulizer gas flow of 0.75 to 0.8 L/min. Isotopes interfered by molecular ions with H, N, O showed an increase of the background signal and, thus, a slight degradation of the LODs. The “wet” plasma conditions used had only a marginal influence on the sensitivity compared to variations of the ablation parameters, espe-cially of the crater size.
A nebulizer gas flow rate of 0.75 to 0.8 L/min, which was found to be the optimum during the tuning of the ICP-MS, yielded in an overestimation of Pb and Bi in the Cu matrix, as shown in Fig. 8, and, therefore, the effect of changing the plasma conditions by reducing the nebulizer gas flow was further investigated. As a result, Pb and Bi could be determined accurately in the Cu matrix, but an overestimation of Ag and Cd was observed. The relative deviations of analyte mass fractions measured for Cu samples (5 mg/kg powder pellet and CRM ERM-EB384) and Zn powder pellets (5 mg/kg or 0.5 mg/kg) are shown in Fig. 8. The other samples (pellets and CRMs) showed a similar behavior. Apparently, the application of liquid standard solutions resulted in inaccuracies of up to 50% for Pb, Bi, Ag, and Cd (CRM Cu matrix) and Cd (Zn matrix), which were by a factor of around two to five higher than those observed by matrix-matched calibration using solution-doped powder pellets, whereas other ele-ments like Cr, Mn, Ni (Cu matrix) showed similar or even lower deviations. Furthermore, most of the mass fractions obtained for the Cu samples appear to be overestimated, except for Zn in the powder pellet and Pb and Bi at low nebulizer gas flows. In contrast, deviations for the Zn samples followed the opposite trend, i.e., analyte mass fractions were systematically below the expected ones, independent of which nebulizer gas flow rate was chosen. This finding may be a consequence of higher diffusion losses of Zn released by LA particles compared to the liquid droplets inside the ICP, which might originate from the abovementioned excess of smaller particles formed during LA.
Conclusion
The applicability of solution-doped powder pellets as calibration samples for the analysis of pure copper and zinc samples using fs-LA-ICP-MS was explored. It was shown that analysis of copper CRMs provided deviations of smaller than 20%, except for Al, Mg, Mn and, to a certain extent, Cd and As with mass fractions below 3 mg/kg. However, the tendency of overestimating the mass fractions
for most of the elements indicates a slightly different ablation behavior of the solution-doped powder pellets. This is probably caused by the accumulation of dopants on the grain boundaries in the powder pellets versus the alloyage of the trace elements into the copper matrix. Compared to this, calibration by zinc pellets generally resulted in even higher accuracies. Depending on the element considered, deviations below 10% were obtained even for nominal mass fractions close to the limit of quantification. Our findings, therefore, suggest the utiliza-tion of soluutiliza-tion-doped powder pellets to be a practicable alternative to conventional (alloyed) reference materials. It can, moreover, be expected that calibration by doped powder pellets should be applicable to other (metallic) matrices as Cu and Zn already represent extremes consid-ering their physical properties (ionization potential, melting, and boiling point).
In contrast, liquid standard calibration led to deviations of up to 50% and, thus, turned out to be less favorable for the quantification of trace elements in metals. The quality of data achieved this way was found to depend on the ICP operating conditions chosen. In particular, elements, with a high ionization potential and low melting/boiling points (e.g., cadmium, zinc, and lead) which tend to accumulate in small particles [24, 26], were prone to severe uncertainties, i.e. relative deviation changes form almost 0 up to 50%, due to strong sensitivity to plasma conditions. Furthermore, these results indicate the difficulty to match liquid droplets and LA-aerosols to identical behavior inside the ICP-MS. The reported calibration strategies directly fulfill the demands of metrological traceability to the SI units kg or Mol of the analyte. Acknowledgments Financial support by the Swiss Federal Science Foundation (SNF/project 200020-111825/1) is gratefully acknowledged.
References
1. GeoReM database (2009) Max Planck Institute for Chemistry, Mainz.http://georem.mpch-mainz-gwdg.de
2. Luo Y, Gao S, Longerich HP, Günther D, Wunderli S, Yuan HL, Liu XM (2007) J Anal At Spectrom 22:122–130
3. Ehrlich G, Stahlberg U, Hoffmann H, Scholze H (1991) Spectrochim Acta Part B 46:115–124
4. Hoffmann V, Mai H (1997) In: Payling R, Jones D, Bengston A (ed) Glow discharge optical emission spectrometry. Wiley, New York 5. De Gendt S, Schelles W, Van Grieken R, Müller V (1995) J Anal
At Spectrom 10:681–687
6. Inoue M, Saka T (1999) Anal Chim Acta 395:165–171
7. Matschat R, Hinrichs J, Kipphardt H (2006) Anal Bioanal Chem 386:125–141
8. Van Heuzen AA, Morsink JBW (1991) Spectrochim Acta Part B 46:1819–1828
9. Becker JS, Breuer U, Westheide J, Saprykin AI, Holzbrecher H, Nickel H, Dietze HJ (1996) Fres J Anal Chem 355:626–632 10. Perkins WT, Pearce NJG, Westgate JA (1997) Geostand Newsl
11. Pattberg S, Matschat R (1999) Fres J Anal Chem 364:410– 416
12. Hoffmann E, Ludke C, Skole J, Stephanowitz H, Wagner G (1999) J Anal At Spectrom 14:1679–1684
13. Klemm W, Bombach G (2001) Fres J Anal Chem 370:641– 646
14. Lee YL, Chang CC, Jiang SJ (2003) Spectrochim Acta Part B 58:523–530
15. Traub H et al (2009) submitted
16. Hergenröder R, Samek O, Hommes V (2006) Mass Spectrom Rev 25:551–572
17. Gagean M, Mermet JM (1997) J Anal At Spectrom 12:189–193 18. Resano M, Garcia-Riuz E, McIntosh KS, Hinrichs J, Deconinck I,
Vanhaecke F (2006) J Anal At Spectrom 21:899–909
19. Wienold J, Traub H, Lange B, Giray T, Recknagel S, Kipphardt H, Matschat R, Panne U (2009) J Anal At Spectrom. doi:10.1039= b903251g
20. Outridge PM, Doherty W, Gregoire DC (1997) Spectrochim Acta Part B 52:2093–2102
21. Gagean M, Mermet JM (1998) Spectrochim Acta 53B:581–591 22. Borisov OV, Mao XL, Fernandez A, Caetano M, Russo RE (1999)
Spectrochim Acta Part B 54:1351–1365
23. Koch J, Feldmann I, Jakubowski N, Niemax K (2002) Spec-trochim Acta Part B 57:975–985
24. Kuhn HR, Günther D (2003) Anal Chem 75:747–753
25. Liu C, Mao XL, Mao SS, Zeng X, Greif R, Russo RE (2004) Anal Chem 76:379–383
26. Koch J, von Bohlen A, Hergenröder R, Niemax K (2004) J Anal At Spectrom 19:267–272
27. Liu C, Mao X, Mao SS, Greif R, Russo RE (2005) Anal Chem 77:6687–6691
28. Saetveit NJ, Bajic SJ, Baldwin DP, Houk RS (2008) J Anal At Spectrom 23:54–61
29. Fernandez B, Claverie F, Pecheyran C, Donard OFX (2007) Trends Anal Chem 26:951–966
30. Falk HF, Hattendorf B, Krengel-Rothensee K, Wieberneit N, Dannen SL (1998) Fres J Anal Chem 362:468–472
31. Pickhardt C, Becker JS, Dietze HJ (2000) Fres J Anal Chem 368:173–181
32. Halicz L, Günther D (2004) J Anal At Spectrom 19:1539–1545 33. O'Connor C, Sharp BL, Evans P (2006) J Anal At Spectrom
21:556–565
34. Wälle M, Koch J, Günther D (2008) J Anal At Spectrom 23:1285–1289
35. Kovacs R, Schlosser S, Stab SP, Schmiderer A, Pernicka E, Günther D (2009) J Anal At Spetrom 24:476–483
36. Ellison SLR, King B, Rösslein M, Williams A (2003) EUR-ACHEM/CITAC-Guide: Traceability in Chemical Measurement, EURACHEM.www.eurachem.org
37. International Standards Organisation (2005) ISO 17025—General Requirements for the Competence of Testing and Calibration Laboratories. ISO, Geneva
38. Lange B, Recknagel S, Czerwensky M, Matschat R, Michaels M, Peplinski B, Panne U (2008) Microchim Acta 160:97–107 39. BAM Federal Institute for Materials Research and Testing
(2009) Berlin.http://www.bam.de/pdf/service/referenzmaterialien/ certificate.pdf
40. Institute for Reference Materials and Measurement (2009) Geel.
http://irmm.jrc.ec.europa.eu/html/reference_materials_catalogue/ catalogue/RM_Catalogue.pdf
41. Koch J, Wälle M, Pisonero J, Günther D (2006) J Anal At Spectrom 21:932–940
42. Longerich HP, Jackson SE, Günther D (1996) J Anal At Spectrom 11:899–904
43. Horn I, von Blanckenburg F (2007) Spectrochimica Acta Part B 62:410–422