Introduction
The validation of measurements is a key problem of almost any analytical method [1]. One possibility to realize such a validation is to execute or participate in round robin tests [2]. Comparing data, generated from different laboratories on the same sample, afford a lot of valuable information regarding repeatability and reproducibility of the certain analytical method. In or-der to suppress biased behavior and to obtain a high independency in this field, round robin tests are often organized by neutral federal institutions like Empa (Swiss Federal Institute for materials testing and re-search), BAM (German Federal Institute for materials research) or DACH (German Accreditation for Chem-istry).
The determination of oxidation induction time (OITtime) and oxidation induction temperature (OITtemp) are widely used methods in the thermal analysis of polymers [3, 4]. The aim of these measure-ments is to estimate the stability of polymeric materi-als under oxidative conditions. In particular it is used for polyolefin formulations intended to be used in wa-ter pipes or outdoor applications. Several inwa-terna- interna-tional standards describe the methods and the operat-ing sequence of OIT measurements [5]. The OITtime method is most popular in this context and consider-ably work was done already to investigate the
influ-ence of different parameters on OITtimedata in detail [6–8]. Furthermore, the prediction of the lifetime of plastic products due to OITtimemeasurements was at-tempted [9, 10]. Also approaches with chemilumin-escence measurements were made to study polymer oxidation induction processes by radiation [11, 12], or even combine chemiluminescence with DSC to realize simultaneous measurements of heat flow and light emission [13].
The present work compares OITtimeand OITtemp data obtained from three round robin test campaigns, where the participants uses the same samples for the OITtimeand the OITtempmeasurements. This should re-veal, which of both methods is more precise and which method is more suitable for which measuring problem. Preliminary results on this topic have al-ready been published by our group [14]. In this previ-ous paper the principles and intentions of the round robin tests are described in detail. The meaning of terms like repeatability and reproducibility is dis-cussed and a lot of statistic expressions are explained as well. Table 1 summarizes the most important statistical terms used in the following.
For the evaluation of the ring test data a robust statistic was used. Robust statistics are characterized by the fact that no outlier tests are applied. All data of the round robin test participants are consulted for the evaluation. During an iterative process the data
re-DETERMINATION OF OXIDATION INDUCTION TIME AND
TEMPERATURE BY DSC
Results of round robin tests
M. Schmid
1*, A. Ritter
1and S. Affolter
21
Materials Science and Technology (Empa), Lerchenfeldstrasse 5, 9014 St. Gallen, Switzerland
2
University of Applied Science Buchs (NTB), Werdenbergstrasse 4, 9470 Buchs SG, Switzerland
Results obtained from three round robin tests, performed in 1998, 2000 and 2004, are summarized and presented. Oxidation Induc-tion Time (OITtime) and Oxidation Induction Temperature (OITtemp) on six different grades of polyethylene were measured by DSC.
The measured data were collected by Empa and evaluated using a robust statistical method concerning repeatability and reproducibility standard deviation.
The results of the tests indicate that the determination of OITtimeis associated with a high degree of uncertainty, especially for
low OITtimevalues. Thus, OITtempmeasurements could be a valuable alternative for testing less stabilized or non-stabilized
polyolefin in particular. However, OITtempdata reveal that the ability to distinguish between different polymer samples decreases
drastically as OITtempvalues increase.
Keywords: DSC, interlaboratory test comparison, oxidation induction temperature, oxidation induction time,
round robin test, validation
cords will be weighted depending on how far they are apart from the median value (xmedian). The bigger the gap between the data and the calculated median value, the weaker the influence of this data on the ex-pression of the round robin test becomes. Thus, the ‘good data’, close to xmedian exert more influence on the result. The median value itself, called ‘Hampel-Schätzer’ is also calculated new after every iterative step. The exact mathematics, which is basic of all sta-tistical calculations of our round robin tests, is de-scribed elsewhere [15].
Materials and methods
Overall six different commercially available polyeth-ylene grades were used for the ring test evaluations (see Table 2 for exact description of the materials). The materials are chosen regarding their different
lev-els of stabilization, in order to cover a wide measuring range. Altogether 14 (year 1998 and 2004) respec-tively 16 (year 2000) laboratories participated in the round robin tests. The test program was accurately prescribed for all participants for OITtime measure-ments and OITtempmeasurement as well. The temper-ature of the isothermal oxidation phase for OITtime was defined as 210°C.
The sequence of a standardized OITtime measure-ment using the DSC method according to ISO 11357-6 (2002) is outlined in Fig. 1. After posi-tioning an uncovered sample pan in a calibrated DSC oven (sample mass approximately 5–15 mg), nitrogen is subjected to the measuring cell. The DSC cell is heated rapidly (at least=20 K min–1) to the tempera-ture at which the OITtimevalue should be determined. After reaching the required temperature for the first time, an isothermal step of 3 min follows. The end of this phase is indicated as t1in Fig. 1. At t1the atmo-sphere is switched to oxygen and the DSC-Oven is held at the same temperature until an exothermal sig-nal (oxidation) can be recognized. The onset of this oxidation signal corresponds to a time t2. The OITtime
Table 1 Important statistical terms and definitions used in
the present publication
Expression Abbreviation Explanation
Repeatability
conditions –
Conditions where independent test resuts obtained with the same method on identical test items in the same laboratory by the same operator using the same equipment within short intervals of time
Reproducibility
conditions –
Conditions where test results obtained with the same method on identical test items in different laboratories by different operators using different equipment Median value (‘Hampel Sch¬tzer’) xmedian Median value calculated by robust statistics from all mean values obtained from a fourfold determination from every participant
Repeatability standard deviation
sr
The standard deviation of the test results obtained under repeatability conditions and calculated by robust statistics Reproducibility standard deviation sR
The standard deviation of the test results obtained under reproducibility conditions and calculated by robust statistics
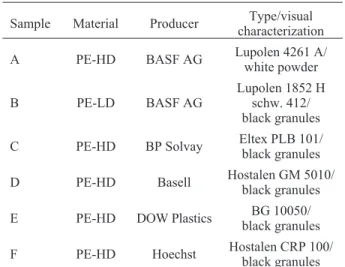
Table 2 Description of the materials used in the round robin
tests
Sample Material Producer Type/visual characterization
A PE-HD BASF AG Lupolen 4261 A/ white powder
B PE-LD BASF AG
Lupolen 1852 H schw. 412/ black granules
C PE-HD BP Solvay Eltex PLB 101/ black granules
D PE-HD Basell Hostalen GM 5010/ black granules
E PE-HD DOW Plastics BG 10050/ black granules
F PE-HD Hoechst Hostalen CRP 100/ black granules
Fig. 1 Principle sequence of OITtimemeasurements according
value can now be determined as the time between t1 and t2, as described in Fig. 1. Frequently however, the oxidation signal is less pronounced than indicated in Fig. 1, making the determination of a clearly defined onset temperature difficult. Finding a suitable mea-suring temperature for the isothermal phase often causes further difficulties with OITtimemeasurements. If the temperature is too low there is a substantial in-crease of the duration of the measurement. And if the temperatures are too high, oxidation takes place im-mediately after the introduction of oxygen. The onset temperature of the decomposition signal (t2) can no longer be determined.
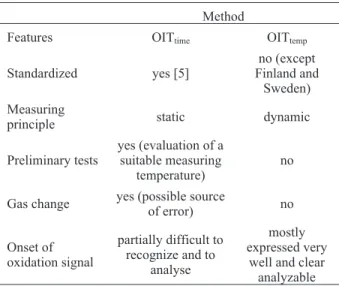
The oxidation induction temperature (OITtemp) is evaluated in accordance with Fig. 2. The sample is heated up continuously (i.e. 10°C min–1) under a pure oxygen gas flow. A change of gases at a defined time, as stated under OITtime measurement, isn’t necessary. OITtempis determined as the onset of the decomposition signal results. OITtemp is usually more clearly pro-nounced as the onset time t2in OITtimemeasurements (t2 is necessary for the determination of the OITtimevalues). To give an overview, the essential characteristics of both methods (determination of OITtimevs. OITtemp) are summarized in Table 3. By comparing the statements in Table 3 it is obvious, that OITtempneeds less effort in set-ting up the measurements and in the majority of cases it delivers clear defined onset points.
Results and discussion
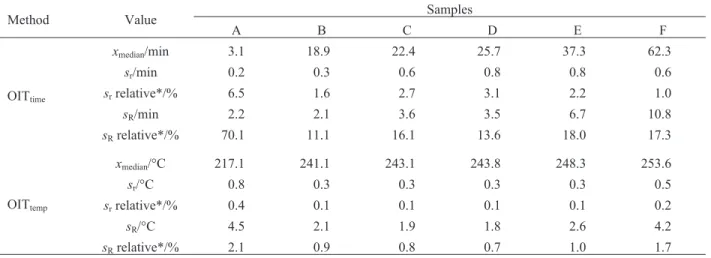
The interlaboratory test data of the OITtimeand OITtemp values are summarized in Table 4. From the data in Ta-ble 4, it is possiTa-ble to establish that the repeatability and reproducibility of the OITtimevalues depend on the order of magnitude of the median values of the samples. The lower the OITtimemedian values, the greater the relative values (srrelative, sRrelative) of the standard deviations. This correlation becomes obvious when the data of the ring tests are compared with data from other round robin
tests (Table 5). From the data in Table 5, it is possible to see, as a tendency, what influence the OITtime median values exert on the sr- and sR-results. The lower the OITtimevalues, the greater the relative standard devia-tion becomes. This could be seen with the relative reproducibility standard deviation (sRrelative) in partic-ular. Even a border line within the range of 10 to 20 min seems to be present, below which the sRvalues rise sig-nificantly (relative reproducibility standard deviations greater than 60%!). Evaluations of OITtime values of samples with very low stabilizer amounts (OITtimelower than 15 min) must therefore be regarded as critical. One possibility to improve the precision of OITtime in that case could be, to lower the isothermal temperature in or-der to increase t2to a time region above 20 min. The key data of the interlaboratory test obtained from the evalua-tion of the OITtemp values are summarized in Table 4. The standard deviations (sr, sR) of the temperature val-ues in Table 4 seem to be reasonable because they have a similar order of magnitude as those found in other round robin tests, where temperatures was evaluated by means of DSC measurements [16, 17].
In the case of temperature measurements, it is quite clear that calculated relative values (sr relative and sR relative) strongly depend on the temperature scale used. For instance, if absolute temperatures (Kelvin scale) are used in our round robin tests, the relative standard deviation would become smaller. Another proposal could be to define the melting point of every material as the zero point of the respective OITtempmeasurement. In this case the relative stan-dard deviations would increase substantially. In our interlaboratory test, we decided to use temperatures corresponding to the centigrade scale, because it is quite common in DSC measurements. Therefore, all further discussions and comparisons of relative tem-perature data refer to °C.
Table 3 Correlation and comparison of the two oxidation in -duction measuring principles
Method
Features OITtime OITtemp
Standardized yes [5]
no (except Finland and
Sweden) Measuring
principle static dynamic
Preliminary tests
yes (evaluation of a suitable measuring
temperature)
no
Gas change yes (possible source
of error) no Onset of oxidation signal partially difficult to recognize and to analyse mostly expressed very
well and clear analyzable
Comparison of OIT
timeand OIT
tempdata
Table 4 summarizes the median values, standard devi-ations (sr, sR) and relative standard deviations (sr rela-tive, sRrelative) of the six PE samples and the two ox-idation induction methods. By comparing the relative standard deviations (sr relative and sR relative) of OITtime and OITtempdata it can be seen that the dy-namic measurement (OITtemp) is connected with sig-nificantly smaller relative standard deviations thanthe static OITtimemethod. This could lead to the inter-pretation, that OITtempmeasurements are always more reproducible than OITtime tests and should be pre-ferred anyway. Additionally, also the set up of OITtempmeasurements is even less complex.
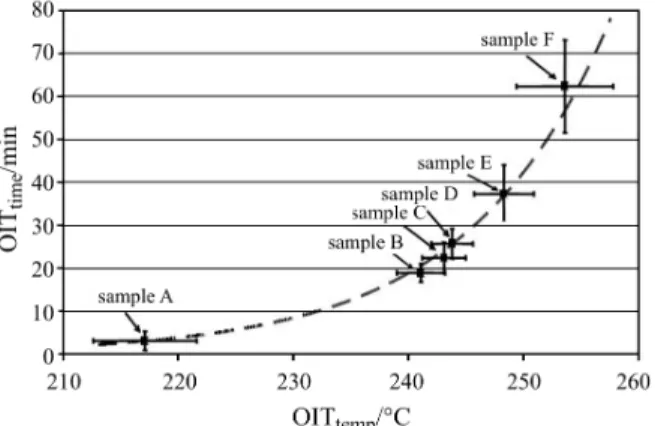
However if one compares the absolute values, then it is noticeable that in the case of OITtemp measure-ments the differentiability between individual samples decreases significantly with rising temperature. This correlation is shown clearly in Fig. 3. The six round Table 4 Summary of the results of OITtimeand OITtempmeasurements on samples A–F
Method Value Samples
A B C D E F OITtime xmedian/min 3.1 18.9 22.4 25.7 37.3 62.3 sr/min 0.2 0.3 0.6 0.8 0.8 0.6 srrelative*/% 6.5 1.6 2.7 3.1 2.2 1.0 sR/min 2.2 2.1 3.6 3.5 6.7 10.8 sRrelative*/% 70.1 11.1 16.1 13.6 18.0 17.3 OITtemp xmedian/°C 217.1 241.1 243.1 243.8 248.3 253.6 sr/°C 0.8 0.3 0.3 0.3 0.3 0.5 srrelative*/% 0.4 0.1 0.1 0.1 0.1 0.2 sR/°C 4.5 2.1 1.9 1.8 2.6 4.2 sRrelative*/% 2.1 0.9 0.8 0.7 1.0 1.7 * sr,Rrelative/%=(sr,R×100)/xmedian
Table 5 Comparison of relative standard deviations (srrelative and sRrelative) of OITtimedata from own (Empa) and foreign
round robin tests (described in the mentioned standards)
Material Number of participants OITtime
xmedian/min sRrelative/%
Empa 1998 (sample A)a PE-HD 14 3.1 70.1
Öfi 2000b PE-HD 13 3.7 62.2
Öfi 2000b PE-HD 12 9.3 64.1
Empa 1998 (sample B)a PE-LD 14 18.9 11.1 Empa 2004 (sample C)a PE-HD 14 22.4 16.1
ASTM D 3895c PE-LD 11 23.4 20.1
ISO 11357-6d PE-LD –d 24.0 17.9
Empa 2004 (sample D)a PE-HD 14 25.7 13.6
Empa 2000 (sample E)a PE-HD 16 36.9 17.6
Empa 2000 (sample F)a PE-HD 16 62.4 15.3
ASTM D 3895c PE-LD 11 79.9 18.9 ISO/CD 11357-6d PE-LD –d 83.4 20.9 ASTM D 3895c PE-LLD 11 119 14.0 ISO 11357-6d PE-LLD –d 120 12.2 ISO 11357-6d PE-HD –d 163 13.3 ASTM D 3895c PE-HD 11 166 14.5
aEmpa round robin test; evaluation according DIN 38402-45 with robust statistics,bround robin test performed by the Austrian Plastic Institute (Öfi); evaluation according ISO 5725-2 with consideration of outliers,cround robin tests performed by ASTM (1991); evaluation according ASTM E 691,devaluation according ASTM E 691; not specified regarding the number of participants
robin test samples are plotted here in an OITtime/OITtemp diagram with the median values as x,y values (symbol: n) and the reproducibility standard deviations (sR) as uncertainty bars. It can be clearly noticed that due to the exponential character of the oxidative decomposi-tion of plastics with respect to temperature (dotted line in Fig. 3), OITtempvalues above approx. 240°C lead to an accumulation of the measured OITtempvalues. This finally leads to an overlay of the error bars concerning abscissa (overlapping region in Fig. 3). Thus, the dif-ferentiation between samples no longer exists in the case of the OITtempvalues, despite very small relative standard deviations (e.g. sample 5 and sample 6 may give the same OITtempresult although they behave dif-ferent in the oxidation process). In contrast to that, it is possible to distinguish the samples by way of the OITtime values (ordinate axis), despite high relative standard deviations.
Conclusions
The present report indicates what repeatability and reproducibility standard deviations must be taken into account when oxidation induction time (OITtime) or temperature (OITtemp) measurements are performed us-ing DSC. The data from this OIT rus-ing tests demonstrate that the determination of the oxidation induction time (OITtime) shows a substantial variation in the measured values, particularly for very low OITtimevalues. Here, only a reduction of the temperature of the isothermal phase (T<210°C) or a reduction of the oxygen content in the measuring chamber could increase the differentiability of similar samples. The high values for repeatability and reproducibility standard deviations also show that the significance of OITtime measure-ments, e.g. with regard to quality control or lifetime predictions of polyolefin parts, must be considered as
rather critically. Particularly for very low OITtime val-ues (polyolefin with none or low stabilization) the dy-namic procedure for the determination of the oxidation induction temperature (OITtemp) seems to be a valuable alternative. But, the OITtempdata show clearly that dif-ferentiation between individual samples decrease rap-idly as OITtempvalues increase.
Acknowledgements
The authors wish to thank all participants of the round robin test campaigns in 1998, 2000 and 2004 who produced the ba-sic data for this presentation and all colleagues of Empa who made it possible for the round robin tests to be carried out.
References
1 S. L. R. Ellison, M. Roesslein and A. Willams editors, EURACHEM/CITAC Guide, Second Edition, 2000, 7. 2 J. Mandel, Chemometrics and Intelligent Laboratory
Systems, 11 (1991) 109.
3 J. R. Pauquet, R. Todesco and W. O. Drake, Limitations and Applications of Oxidation Induction Time (OIT) to Quality Control of Polyolefins, 42ndInternational Wire and Cable Symposium, 1993.
4 G. W. Ehrenstein, G. Riedel and P. Trawiel, Praxis der Thermischen Analyse von Kunststoffen, Hanser Verlag, 2. Auflage, München 2003.
5 ISO 11357-6 (2002); EN 728 (1997); ASTM D 3895 (1995). 6 S. Wallius, Angew. Makromol. Chem., 212 (1993) 103. 7 A. T. Riga and G. H. Patterson, Oxidative Behaviour of Materials by Thermal Analytical Techniques, ASTM STP 1326 (1997).
8 L. R. Mason and A. B. Reynolds, J. Appl. Polym. Sci., 66 (1997) 1691.
9 H. Gebler, Kunstst., 79 (1989) 9. 10 Z. Dobkowski, Polimery, 50 (2005) 213.
11 V. Dudler, D. J. Lacey and Ch. Kröhnke, Polym. Degrad. Stab., 51 (1996) 115.
12 G. Ahlblad, P. Gijsman, B. Terselius, A. Jonsson and K. Möller, Polym. Degrad. Stab., 73 (2001) 419. 13 P. K. Fearon, S. W. Bigger and N. C. Billingham,
J. Therm. Anal. Cal., 76 (2004) 75.
14 M. Schmid and S. Affolter, Polymer Testing, 22 (2003) 419. 15 DIN 38402-45, Interlaboratory comparisons for
profi-ciency testing of laboratories (2003).
16 S. Affolter, M. Schmid and B. Wampfler, Kautsch. Gummi Kunstst., 52 (1999) 519.
17 M. Schmid, S. Affolter and A. Ritter, Macromol. Mater. Eng., 286 (2001) 605.
Received: June 5, 2005 Accepted: September 22, 2005
DOI: 10.1007/s10973-005-7142-5
Fig. 3 X,Y-pair of OITtime/OITtempvalues (symbol:n) of the six
round robin test samples with the corresponding reproducibility standard deviation (sR) as uncertainty bars