HAL Id: tel-01418248
https://hal-pjse.archives-ouvertes.fr/tel-01418248
Submitted on 16 Dec 2016
HAL is a multi-disciplinary open access
archive for the deposit and dissemination of sci-entific research documents, whether they are pub-lished or not. The documents may come from teaching and research institutions in France or abroad, or from public or private research centers.
L’archive ouverte pluridisciplinaire HAL, est destinée au dépôt et à la diffusion de documents scientifiques de niveau recherche, publiés ou non, émanant des établissements d’enseignement et de recherche français ou étrangers, des laboratoires publics ou privés.
Nathalie Ferrière
To cite this version:
Nathalie Ferrière. Three essays on food and humanitarian aid. Economics and Finance. École des Hautes Études en Sciences Sociales - Paris, 2016. English. �tel-01418248�
Thèse pour l’obtention du titre de Docteur en Sciences Economiques
Aide alimentaire et humanitaire : analyses
économiques des donneurs aux bénéficiaires
Three essays on food and humanitarian aid
Thèse présentée et soutenue publiquement le 14 Décembre 2016 par
Nathalie Ferrière
Membres du Jury
Directrice de Thèse
Akiko Suwa-Eisenmann Directrice de Recherche, INRA et Paris School of Economics Rapporteurs
Gani Aldashev Professeur, Université libre de Bruxelles Lisa Chauvet Chargé de recherches, IRD et DIAL Suffragants
Stefan Dercon Professor, Oxford University
La partie la plus simple à rédiger de la thèse : les remerciements. Le plan est déjà conçu à l’avance : remercier le/la directrice de thèse puis dans cet ordre les distingués rapporteurs, les éminents membres du jury, les institutions qui ont financé la thèse, les membres du laboratoire avec toujours un mot gentil pour le personnel administratif qui arrive tant bien que mal à résoudre nos problèmes, les autres doctorants et particulièrement nos collègues de bureau, les amis, la famille au sens large et pour finir la famille de tous les jours : mari et enfant(s). On observe parfois quelques variations mais elles sont toujours marginales. Finalement l’aspirant docteur, le chercheur devant faire preuve de créativité pour ses travaux est d’un traditionalisme à toute épreuve quand il s’agit de remercier les personnes qu’il doit remercier. Comme je ne suis pas une révolutionnaire dans l’âme je vais donc suivre ce plan conçu à l’avance par de nombreux docteurs avant moi. Je me permettrai seulement un seul écart en commençant par remercier Matthieu.
Matthieu, à cause de toi ma thèse a duré plus longtemps que prévu. La gestation de cette thèse a finalement été plus difficile que ma grossesse. Je pense que tu m’as fourni plus de cheveux blancs pendant la grossesse et après ta naissance que toutes mes régressions avec des résultats non significatifs. Mais je voulais te remercier en premier pour ton amour inconditionnel (qui parfois peut s’avérer fatigant surtout à des heures indues de la nuit où il te faut maman et personne d’autre). Ta présence a pleinement contribué à l’équilibre et au bonheur qui m’ont accompagnée pendant ces années de thèse. Ton père sera remercié à la fin comme l’usage le veut.
Maintenant reprenons l’ordre naturel des choses. Akiko Suwa-Einsenman, un grand merci ! Tu m’as accompagnée inconditionnellement pendant tout ce temps avec constance, rigueur et détermination. Tu as toujours fait en sorte que les tracas quotidiens de la thèse soient résolus le plus vite possible pour pouvoir se concentrer sur le plus important : mes travaux de recherche même quand j’avais moi-même tendance à m’éparpiller. Tes lectures, relectures, annotations, commentaires sur mon anglais (et tes conseils de lecture dont Grammar in Use pour l’améliorer : le livre a été acheté mais rarement ouvert je l’avoue), conseils et suggestions ont été primor-diaux. Merci aussi pour ton engagement constant pour me trouver des financements. Une thèse finalement ce n’est pas un travail solitaire, c’est au minimum un travail de binôme et je pense que je ne pouvais avoir de meilleur binôme que toi. Je suis arrivée en milieu de M2 avec une idée en tête et tu l’as acceptée directement. Cette idée s’est développée en sujet de thèse, a
fortement évolué au cours de la thèse mais tu as toujours su m’accompagner au mieux. Si cette thèse ressemble à ce qu’elle est aujourd’hui c’est grâce à toi.
Ensuite merci à Gani Aldashev et Lisa Chauvet d’avoir accepté de rapporter cette thèse malgré les délais serrés. Vos commentaires lors de la pré-soutenance, soulignant votre lecture attentive de ma thèse, étaient les bienvenus. J’espère que cette version ainsi que la soutenance sauront répondre à vos exigences. Merci à Karen Macours d’avoir fait partie de mon comité de thèse tout au long de celle-ci, d’avoir pris part à la pré-soutenance et d’avoir accepté de faire partie de mon jury.
Thanks to Stefan Dercon for agreeing to be a jury member. My literature review starts and ends with your work. The start of my PhD thesis which is now the first chapter would not be possible without your implication on the ERHS panel. The thoughts for my second chapter (which is the last chronologically) have benefited to your last book.
Plusieurs institutions ont financé cette thèse : l’Université Paris 1 qui m’a attribué un contrat doctoral et qui, après une lutte acharnée de ma part pour faire valoir mes droits, a finalement accepté de le proroger de la durée du congé maternité, l’INRA, je remercie particulièrement à nouveau Akiko Suwa-Eisenmann mais aussi Anne-Célia Disdier pour son rôle et l’Université Paris Sud qui m’a engagée en qualité d’ATER. Un merci particulier à Miren qui a fait en sorte que mon intégration se passe pour le mieux. La première et dernière institutions m’ont surtout permis d’enseigner des matières dans lesquelles j’étais plus ou moins compétente. Cela a révélé mon appétence prononcé pour l’enseignement. Merci aux professeurs qui m’ont acceptée en chargé de TDs et notamment à Catherine Doz.
D’autres institutions m’ont aussi été d’une grande aide par la mise à disposition gratuite de leurs données : le CSAE et l’IFPRI pour les données éthiopiennes, l’ONU pour les flux internationaux d’aide alimentaire et humanitaire. Sans elles, cette thèse n’aurait jamais abouti. Merci à ces gens de l’ombre pour leur collecte de données.
Merci à l’équipe de recherche de PSE, particulièrement aux chercheurs du rez-de-chaussée du bâtiment B et à Pamina Koenig. Mais si une thèse se déroule bien c’est aussi grâce au personnel administratif : merci à Véronique Guillotin, Weronika Leduc, Eliane Madelaine, Marie-Christine Paoletti, et plus particulièrement à Béatrice Havet. Et puis il ne faut pas oublier le service informatique : Radja, José et Rémi. Radja je me souviens encore que tu es venu spécialement pour moi un lundi de Pâques !
La richesse de ces années de thèse doit beaucoup aux (post-)doctorants et anciens docto-rants, qui ont largement contribué aux bons souvenirs que je garderai de cette époque. Par ordre alphabétique merci à Avner, Alexandre, Brice, Camille, Diana, François, George, Jérémie, Jona-than, Kenneth, Marie, Marianne, Margaux, Olivia, Paola, Rozenn, Simon, Stefano et Yannick. Malgré mon exil dans le bâtiment B, les pause déjeuner ont bien servi. Eux méritent un mot particulier, ce sont évidemment Cyril, Cristina, Mattea, Pauline et Thomas: mes co-bureaux. Pauline : tu as profité de mon congé maternité pour fuir notre bureau glacial mais avant cela c’était toujours un plaisir de t’avoir les jours où tu étais à PSE. Cyril, je ne décorerai plus ton
ordinateur avec Cristina mais je ne serai plus là non plus pour t’épauler en Stata, mais bon maintenant tu es devenu autonome. Par contre je pourrai aller manger au resto U ou acheter à manger chez Lidl sans me confronter à ton regard assassin. Cristina je n’aurai plus à t’entendre fredonner le Fantôme de l’Opéra dans le bureau mais je prends rendez-vous pour le voir malgré les annulations ; essaie quand même de dormir et de te reposer de temps en temps. L’ambiance du bureau va quand même me manquer mais je vous laisserai peut-être ma plante comme souve-nir de mon passage ! Mattea, c’est toi la prochaine à soutesouve-nir en développement a priori, bonne dernière ligne droite. Thomas, tu débutes, bon courage.
Je remercie ensuite mes amis de l’ENSAE notamment pour les après-midi tarot que nous avons pu passer ensemble : Claire, Floriane, Gwennaëlle (qui a réussi l’exploit de commencer sa thèse après moi et de la soutenir avant, mais bon c’était en statistiques !), Rémy. Les amis d’ENSAE Solidaire aussi. Mais comme toujours et avant tout Alice, 18 ans que tu me supportes ! Quand je t’ai dit les dates approximatives de ma soutenance, tu m’as de suite répondu : “OK, dès que tu as la date définitive je réserve mon billet." Je sais que je peux toujours compter sur toi.
Enfin la famille ! Mes parents (qui m’ont fait si belle et intelligente, ah non ce n’est pas ça) qui nous ont notamment dépanné pour les gardes d’enfants, fait passer de bonnes vacances à jouer tous les jours ; mon frère et sa famille et surtout ma sœur Adeline et son conjoint civil et solidaire Rémi si j’ai eu ma bourse de thèse c’est grâce à vous deux ; mais aussi ma belle-famille. Cher beau-père je peux enfin répondre à votre sempiternelle question « Alors tu soutiens quand ? Tu as ton jury de thèse ? » Papèpe je vous annonce que ça y est les études ont arrêté de me poursuivre, il était temps.
Pour conclure merci à Thomas. Pour ton effet tisane quand je commence à trop m’en faire, pour m’avoir dit « il faudrait la finir à un moment cette thèse quand même », pour être sans concession avec moi (dans le bon sens du terme) ce qui m’a permis d’arriver là où je suis maintenant, pour t’occuper de Matthieu si bien tout le temps, pour avoir fait plus que ta part ces dernières semaines, et pour tout le reste.
Finalement merci aussi aux futurs enfants, qui ne sont pas encore là mais que je n’en doute pas finiront pas remplir la maison de leur joie débordante, de leurs caprices, de leurs disputes, de leurs rires, de leur vie. Ce n’est pas parce que vous n’êtes pas encore là que les remerciements doivent se cantonner à Matthieu.
Remerciements iii
General Introduction 1
1 Does Food Aid Disrupt Local Food Market? Evidence from Rural Ethiopia 7
1.1 Introduction . . . 8
1.2 Context . . . 11
1.2.1 Food aid in Ethiopia . . . 11
1.2.2 Related studies on Ethiopia . . . 12
1.3 Data and descriptive statistics . . . 16
1.4 Empirical specification . . . 18
1.4.1 On production . . . 18
1.4.2 On sales and purchases . . . 22
1.5 Results and analysis . . . 22
1.5.1 On production . . . 22
1.5.2 On sales and purchases . . . 25
1.5.3 Robustness checks . . . 26
1.6 Conclusion . . . 27
1.7 Figures and tables . . . 28
1.8 Appendix . . . 39
2 Donors Versus Implementing Agencies: Who Fragments Humanitarian Aid? 49 2.1 Introduction . . . 50
2.2 Humanitarian aid: data and descriptive statistics . . . 52
2.2.1 Data . . . 52
2.2.2 Descriptive statistics . . . 55
2.3 Fragmentation of humanitarian aid . . . 58
2.3.1 Indicators of aid fragmentation . . . 58
2.3.2 Donor and implementing agency fragmentation . . . 59
2.4.1 Positive impacts of delegation and fragmentation on aid efficiency . . . . 63
2.4.2 Negative impacts of delegation and fragmentation on aid efficiency . . . . 65
2.5 Three case studies of implementing agency fragmentation . . . 67
2.5.1 Haiti 2010: the burden of fragmentation . . . 67
2.5.2 Pakistan 2010: a useful fragmentation . . . 69
2.5.3 Sudan 2010: the leading role of the UN . . . 71
2.6 Conclusion . . . 73
2.7 Figures and tables . . . 74
3 To Give or Not to Give? How Do Donors React to European Food Aid Allocation? 89 3.1 Introduction . . . 90 3.2 Empirical strategy . . . 94 3.2.1 Specification . . . 94 3.2.2 Instrumental strategy . . . 96 3.2.3 Potential concerns . . . 99
3.3 Data and descriptive statistics . . . 103
3.3.1 Food aid statistics . . . 103
3.3.2 Controls . . . 104
3.4 Empirical results . . . 106
3.4.1 Baseline results . . . 106
3.4.2 Bilateral reactions . . . 108
3.4.3 Placebo tests and robustness checks . . . 109
3.5 A donor typology . . . 111
3.5.1 Setting . . . 112
3.5.2 Reaction function . . . 114
3.5.3 Typology . . . 115
3.6 Conclusion . . . 115
3.7 Figures and tables . . . 116
3.8 Appendix . . . 126
General Conclusion 147
1 Share of humanitarian and food aid on international aid . . . 2
A1.1 Timing of Food Aid Allocation and of the Survey . . . 42
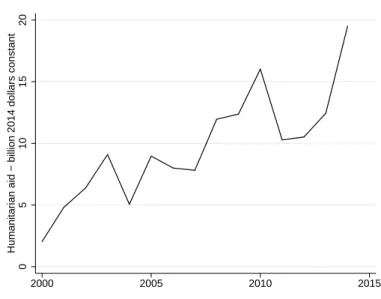
2.1 Humanitarian aid over time, billion of current US dollars . . . 74
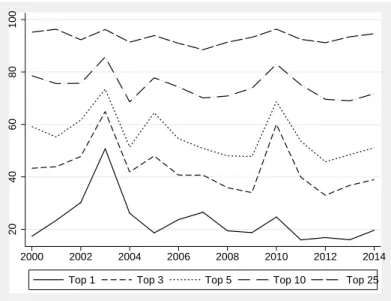
2.2 Percentage of world humanitarian aid allocated to top recipients . . . 75
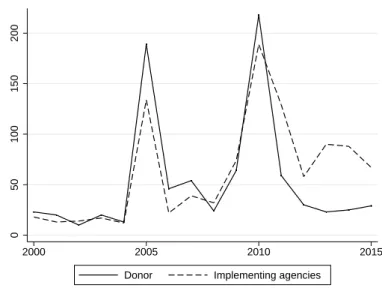
2.3 Number of actors in humanitarian aid from 2000 to 2014 . . . 75
2.4 Distribution of the number of donors and implementing agencies over time . . . . 76
2.5 Number of implementing agency and donor in Pakistan over time . . . 76
2.6 Persistence of donor over time . . . 77
2.7 Persistence of implementng agency over time . . . 77
2.8 Link between implementing and donor fragmentation . . . 78
2.9 Proportion of donors using only one implementing country in a given country . . 79
2.10 Number of donors and implementing agencies in Haiti . . . 79
2.11 Donor and implementing agency fragmentation – 1 - CR3 – in Haiti . . . 80
2.12 Donor and implementing agency fragmentation – 1 - CR3 – in Pakistan . . . 80
2.13 Number of donors and implementing agencies in Sudan . . . 80
2.14 Donor and implementing agency fragmentation – 1 - CR3 – in Sudan . . . 81
3.1 Number of recipient countries . . . 117
3.2 Average probability of receiving food aid from the EU . . . 117
3.3 Relative variation of the probability of receiving food aid from the EU . . . 118
A3.1 EU donor ranking . . . 131
A3.2 Number of recipient countries . . . 132
A3.3 Share of local or triangular purchases . . . 137 A3.4 Average quantity received from the EU by EU recipient countries (in metric tons) 137
1.1 Descriptive Statistics . . . 29
1.2 Probability of receiving aid over two rounds . . . 30
1.3 Household Characteristics and Food Aid . . . 31
1.4 Transition matrix of types of market participation . . . 32
1.5 Market Participation and Aid . . . 33
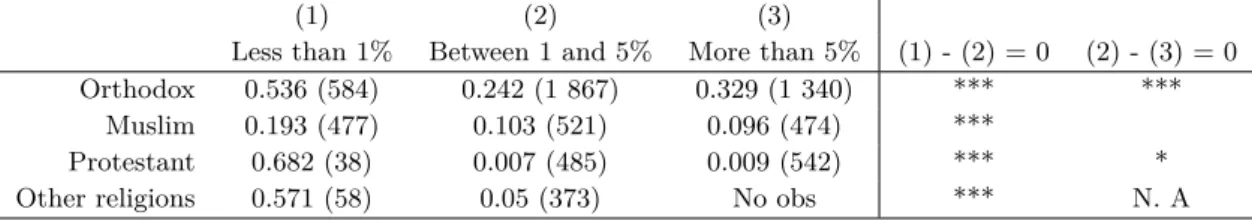
1.6 Probability of being a wheat producer and the share of religious holidays during the growing season . . . 34
1.7 Being a Wheat Producer . . . 35
1.8 Impact of receiving ten additional kilograms of wheat on the type of market participation . . . 36
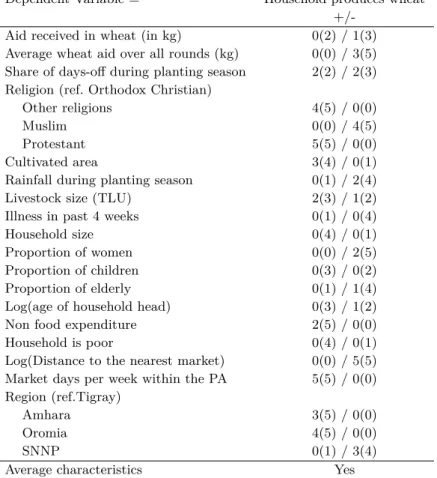
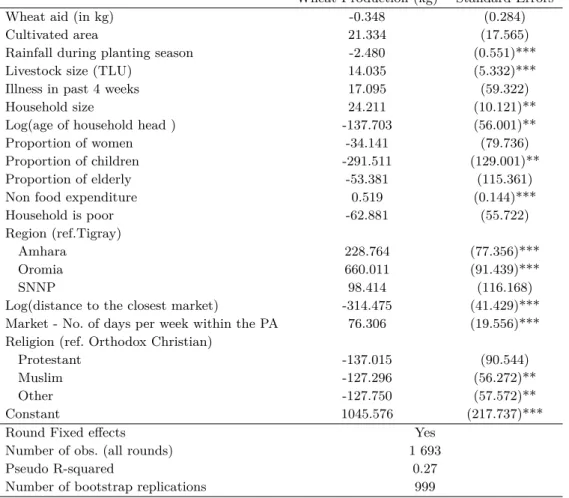
1.9 Wheat Production . . . 37
1.10 Simulated impact of food aid on the number of wheat producer and on total wheat production . . . 37
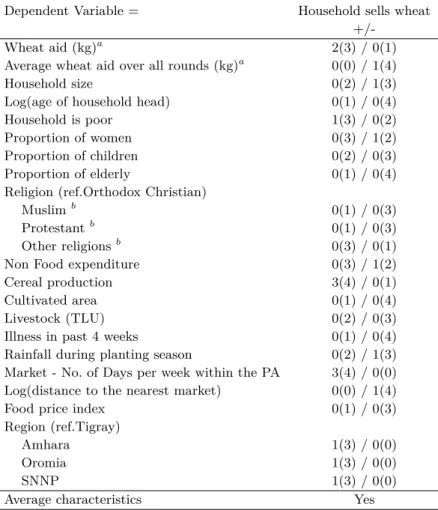
1.11 Being a Wheat Seller . . . 38
1.12 Wheat Sales . . . 39
1.13 Being a Wheat Buyer . . . 40
1.14 Wheat Purchases . . . 41
B1.1 Being a Producer: Alternative Specifications . . . 43
B1.2 Wheat Production (kg): Alternative Specifications . . . 44
B1.3 Being a Wheat Seller: Alternative Specifications . . . 45
B1.4 Wheat sales (kg): Alternative Specifications . . . 46
B1.5 Being a Wheat Buyer: Alternative Specifications . . . 47
B1.6 Wheat Purchases (kg): Alternative Specifications . . . 48
2.1 Type and importance of donors and implementing agencies . . . 82
2.2 Share of projects directly implemented by types of donor or implemented by recipient country . . . 82
2.3 Distribution of projects depending on donors and implementing agencies . . . 82
2.4 Average size of projects depending on donors and implementing agencies . . . 83
2.6 Share of recipient country-year by number of implementing agencies and donors . 84
2.7 Implementing agency fragmentation in a given recipient country . . . 84
2.8 Correlation between fragmentation indicators . . . 84
2.9 Share of concentration, dilution or status quo on fragmentation of IAs over frag-mentation of donors . . . 85
2.10 Average number of IAs by donors and of donors by IAs . . . 85
2.11 Haiti: experience of implementing agencies in percentage of cases . . . 85
2.12 Haiti: average project size depending on the experience of the implementing agency 86 2.13 Pakistan: experience of implementing agencies in percentage of cases . . . 86
2.14 Pakistan: average project size depending on the experience of the implementing agency . . . 86
2.15 Sudan: experience of implementing agencies in percentage of cases . . . 86
2.16 Sudan: average project size depending on the experience of the implementing agency . . . 87
3.1 Number of recipients and correlation among donors . . . 119
3.2 Donors’ reaction to the allocation of EU food aid on the decision stage - Small countries and extra-EU members . . . 120
3.3 Strategic interactions depending on the type of recipients and the sample of donors121 3.4 Bilateral response to EU food aid allocation . . . 122
3.5 Placebo Tests . . . 123
3.6 Robustness checks - Small recipients . . . 124
3.7 Donor typology . . . 124
3.8 A Donor Typology for small recipients . . . 125
A3.1 Desciptive statistics on food aid quantities and correlation among donors . . . . 127
A3.2 Descriptive statistics on regular and irregular recipients . . . 128
A3.3 Average number of recipient countries by donor and period . . . 129
A3.4 Descriptive statistics . . . 130
B3.1 Pre-trend analysis for EU food aid allocation - small and large countries - depen-ding on their type . . . 132
B3.2 Evolution of recipient’s characteristics in small countries depending on the pro-pensity of receiving from the EU . . . 133
B3.3 Evolution of recipient’s characteristics in large countries depending on the pro-pensity of receiving from the EU . . . 134
B3.4 Control Variables: 2SLS estimates - Small recipients and extra EU members donors.135 B3.5 Bilateral response to EU food aid allocation – All recipients . . . 136
B3.6 Robustness checks - first stage estimates . . . 138
C3.1 Reaction to the allocation of EU food aid on quantities - small recipients and non-EU donors . . . 140 C3.2 Strategic interactions depending on the type of recipients and the sample of
donors – quantities . . . 141 D3.1 List of recipient countries . . . 145
82.5 million of people among 37 countries depended on humanitarian aid to ensure their lives in 2015 according to the Office of Coordination of Humanitarian Affairs (OCHA) United Nations Office for the Coordination of Humanitarian Affairs (2016a). 20.1 billion of dollars have been allocated the same year to respond to these needs partly through the OCHA. However numerous crises were under-funded: all needs were not covered.1 Other countries who were not
targeted by an UN appeal also received humanitarian aid from other type of donors. Partly in collaboration with the OCHA, 76.7 million of people, with a special focus to women and children, among 81 different countries received food aid from the World Food Program (WFP) and other donors.2 Food and humanitarian aid amounts are still small compared to amounts allocated to
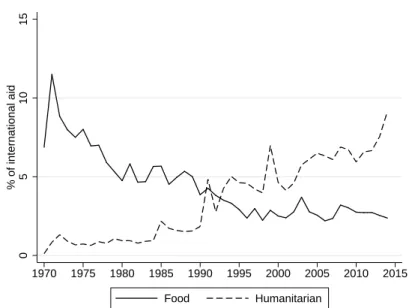
development aid (about 132 billion of dollars). Nevertheless the share of humanitarian aid is increasing (Figure 1).
Humanitarian aid represented about 5 percent of total aid in 1995 and 10 percent in 2014.3
On the contrary the share of food aid is decreasing but food aid still remains important in some countries. This trend is partly explained by the almost end of program food aid. In addition emergency aid which used to be food aid is more diverse now: school meal, cash, demining action, livestock care, water sanitation, immunization, clothes, and schooling for refugees. . . (United Nations Office for the Coordination of Humanitarian Affairs, 2016b).
Despite the fact humanitarian and food aid aim to save lives, they have been criticized over the last years. On the one hand, aid is too scarce and badly allocated to be effective and relevant (United Nations Office for the Coordination of Humanitarian Affairs, 2015). Indeed the amounts devoted seem to be small given the accuracy and the increasing number of crises. This trend of criticism also points out important and recurrent delays on the delivery. For instance in 2011 three months after the emergency statement in the Horn of Africa because of severe drought and hungry, the amounts of delivered aid were small and commitments of future aid also compared to the estimated needs.4 About the allocation, criticism focus on the fact some
1. Source : Financial Tracking System database, OCHA.
2. Women and children represent 82 percent of beneficiaries according to World Food Programme (2015). 3. It is the share focusing on DAC donors, which are not the only donors but traditional donors. It excludes private sector and NGOs that are more active in humanitarian sector.
4. Newspaper publicized extensively the delay on the international community reaction as show these French exemples: Jeune Afrique, 08/02/2011, Libération, 09/29/2011, La Croix, 09/07/2011. Some NGOs, such as OX-FAM or Groupe URD, also point out the lack of reaction of the UN system.
0 5 10 15 % of international aid 1970 1975 1980 1985 1990 1995 2000 2005 2010 2015 Food Humanitarian
Figure 1– Share of humanitarian and food aid on international aid
Source: author’s calculation from OECD data.
well publicized crises concentrate large amounts of humanitarian and/or food aid while other crises are almost forgiven.5.
On the other hand, some criticized aid to create humanitarian trap in which beneficiaries are stuck. Receiving aid would decrease incentives to improve their situation and thus increase the probability of future crisis. Hence aid would create dependency (Devereux, 2004). This type of criticism has been well-developed for food aid but can be applied for humanitarian aid. Relief aid decreases the needs of prevention and preparedness of disasters. The criticism can go a step further: humanitarian aid system has incentives to self-maintain (De Waal et al. , 1997): relief is a business. It leads to some situations in which countries received every year humanitarian and/or food aid. The second problem underlined is about the crowd-out effect. Indeed aid would deter (or even substitute) to local coping system. Third aid would not be suited to local contexts. A survey by the UN in 2015 on refugees draws a concerning picture. Aid does not fit their needs, information and communication are low, and projects are accused to be developed to fund-raising purposes rather than to help beneficiaries, etc.
In this context, academic research in economics can make a contribution. Indeed, an objective analysis of the effectiveness of aid both at the micro level and macro is crucial given the needs and resources available. At the micro level, it can help to highlight the direct but also indirect effects of assistance on the beneficiaries and the local economy. Indeed the beneficiaries can change the behavior and thus affect the actual effectiveness of aid. For example food aid is often given to rural households, where economic theory shows that consumption and production are not separable. Further aid is part of a specific economic system often undermined because of a crisis. This assistance may affect the functioning of the system. Understand the full implications 5. Advocacy NGOs do a lot to un-forgive forgiven crises. For instance in March 2016, a group of international NGOs launched an alert about the humanitarian crisis in Yemen (link)
of the provision of aid at the micro level can therefore afford to implement projects that will minimize the disincentive effects that can theoretically generate help.
An analysis at the macro level is complementary to the first type of analysis. It allows us to understand the overall effect for a country with a multitude of local and sometimes disparate projects for which the secondary consequences and general equilibrium effects are sometimes neglected. Moreover, macroeconomic analysis does not focus more on beneficiaries but often on the behavior of donor and recipient governments. These two types of actors, their behavior and interests, may also affect the effectiveness of aid must be understood. Indeed literature has extensively documented that institutional donors allocate aid not only to the needs of recipient countries but also according to their own interests which could reduce the effectiveness of aid. It also showed that the context - the characteristics of the recipient country - had a great impact on its effectiveness, at least for development aid (Burnside & Dollar, 2000).
In this rich literature on aid effectiveness and the different channels that can influence it, relatively little empirical work mentions the existence of the third major player: the agency in charge of implementing projects. Many theoretical work shows that they also have personal and strategic interests (Annen & Knack, 2015). Two papers (Dietrich, 2013; Acht et al. , 2015) differ, however, by taking account of these intermediaries. Nevertheless they implicitly assume that the choice of implementing agencies depends only on the donor and that these intermediaries are ultimately neutral apart by their relative effectiveness and vis-à-vis independence of recipient governments.Hence analyzing these three players is critical to better understand the system and be able to reform if necessary to improve the effectiveness of aid. This thesis contributes to this general understanding and is mainly based on empirical work. The third chapter also introduces a framework to classify donors as to their vis-à-vis reaction allocation of food aid from the European Union. Nevertheless it remains essentially empirical work and mobilizes data types and different methodologies, to address three important obstacles inherent in the empirical analysis of aid.
The first of these obstacles is the scarcity of data especially for humanitarian and food aid that is often allocated in a context of fragile states. Each chapter uses a specific database. The first chapter takes advantage of a panel of Ethiopian rural households. This investigation set up after the great famine of the 1980s in Ethiopia is unique. Indeed few investigations include a detailed questionnaire on aid and more specifically food aid while many countries are still regular recipients. It follows on over fifteen years a thousand households throughout Ethiopia. The panel dimension was crucial to take into account the effects of endogenous selection and allocation of aid. The second chapter is based on international data flows of aid collected by OCHA through the Financial Tracking System since 2000. The wealth of information collected both on donors than on the agencies responsible for the implementation and beneficiaries is amazing. Finally, the third chapter is based on data collected by WFP in INTERFAIS base. The data is reliable only for institutional donors (countries, UN bodies). The advantage of these data is to focus specifically on one type of aid over a long period: 1988-2016 (as part of this thesis the years after 2012 are not processed).
The second obstacle is the empirical difficulty of establishing causal links both at micro and macro levels. Indeed there is a selection phenomenon both in terms of beneficiary households and recipient countries. Beneficiary households are on average poorer, cultivate less land, etc. So it is empirically challenging to distinguish what in the effect of aid on the choice of production and marketing, reports and what is due to these original differences. Likewise countries receiving humanitarian or food aid have special characteristics. Another problem is due to a risk of reverse causality. For the allocation of aid at the household level, it can also be explained by the subsequent choice or anticipated households. At the country level, the allocation can be strategic on the part of donors. Will they allocate humanitarian aid based on the potential recovery of the country whatever the level of aid - to communicate on its effectiveness - or to countries for which the prospects of recovery are low - the risk that humanitarian aid seems not very efficient? Finally if donors take into account the allocation of other donors, the classic problem of reflection appears.
To address these two common pitfalls, three empirical chapters of the thesis are based on rich data, and pay special attention to the development of specific strategies to consider, to the extent that data permit, the risk of endogeneity. This thesis has three original contributions to the empirical literature on aid, focusing specifically on humanitarian and food aid. Specifically, she is interested in the role of each actor involved in the process of assistance: recipients (chapter 1) donors (Chapters 2 and 3) and the agencies responsible for project implementation (Chapter 2 ). Each of the three sections described highlights how each actor can have an impact on the effectiveness of aid.
Chapter 1
The first chapter deals with beneficiaries’ behavior. Co-authored with Akiko Suwa-Eisenman it is entitled “Does Food Aid Disrupt Local Food Market? Evidence from Rural Ethiopia". Food aid may induce changes in beneficiaries’ behavior that could affect its efficiency and thus maintain high level of food insecurity. This chapter tests this existence of these changes focusing on production but also sales and purchases decisions. Indeed food security does not depend only on production (because of auto-consumption) but also on what a household can afford (through purchases and sales). To do, so we look at both the extensive margin (the 0/1 choice) and the intensive margin (quantities). The chapter also investigates whether changes on allocation’s criteria and programs have consequences on beneficiaries’ behavior. It has policy implications on the way food aid programs have to be implemented.
We analyze it in the context of rural households in Ethiopia. The reason is twofold in that choice. First Ethiopia is the country receiving the most food aid from the international community and is characterized by chronic food insecurity. Second, we have the ability to use a next panel database of households from 1994 to 2009. The use of panel data allows us to take into account the endogeneity problem associated with the non-random allocation of food aid to households.
The contribution of this chapter is twofold. First we show that food aid has an impact on the behavior of beneficiaries in terms of production, purchasing and sales but only at the extensive margin. This will provide an explanation to the apparent paradox between the results previously obtained at the macro level and the micro level. Then we show that the conditions of allocation are critical and influence the reactions of the beneficiaries. The new program implemented by Ethiopia in 2004 appears to reduce the disincentive effects of food aid and allows the inclusion of beneficiaries in the marketing chain, which should reduce food insecurity.
Chapter 2
The second chapter extends the analysis and focuses in part on the previous link in the humanitarian aid system, that is to say, the agencies responsible for the implementation of projects. How they manage projects, interact with beneficiaries and donors but also between them may affect aid efficiency. Entitled “Donors versus implementing agencies. Who fragments humanitarian aid?" this chapter contributes to the debate on aid effectiveness and fragmenta-tion in two ways. First, it is to my knowledge the first study that documents humanitarian aid fragmentation not only at the donor level but also at the implementing agency. Disparities exist between the two types of fragmentation which shows that the two types of actors need to be dif-ferentiated. Donor fragmentation is mitigated at the implementing agency level. Fragmentation is less a concern than expected as in 13 percent of the case only one donor and implementing agency are involved within a country. In addition high level of fragmentation – more than 50 donors and 50 implementing agencies – is not frequent: only one percent of the cases.
The second contribution of this chapter is about the debate on aid fragmentation and its effects on efficiency. Indeed there is a broad consensus on the fact that fragmentation is bad for the effectiveness of aid.6 Nevertheless only fragmentation at the donor is analyzed. But in
most cases donors are only donors and there are other agencies that implement humanitarian aid projects in recipient countries. Using three case studies, I illustrates that fragmentation is not necessary a burden. The way aid is delegated and the strength of the recipient country are important to avoid negative consequences of aid fragmentation.
This chapter contributes to highlight the importance of agencies in charge of implementing projects that are almost systematically excluded from the analysis concerning aid allocation and effectiveness. They add an additional layer on the aid system.
Chapter 3
The third chapter, whose title is “To Give or Not to Give? How Do Donors React to Eu-ropean Food Aid ", is interested in the third major player: the donor. Indeed the slightest aid effectiveness may also stem from donor behavior. The literature has shown that donors were 6. This consensus is beginning to be questioned by some studies (Gehring et al. , 2015; Han & Koenig-Archibugi, 2015).
allocating their assistance not only to the needs of recipient countries but also according to their own strategic interests. However literature implicitly assumes that these interests are linked to recipient countries: bias linked to trade concerns, historical links between the donor and the recipient. However donors can also act strategically in relation to other donors.
To take into account the endogeneity problem, the identification strategy is based on the differential impact of a reform of the EU in 1996 of its food aid program on the probability of receiving food aid from the European Union. The reform aims to move from a system of allocation related to agricultural surplus of the Union to a system governed by the needs of recipient countries. Consequently the number of European food aid recipient countries has been halved in the space of five years. The reform first hit small countries (particularly small islands) and next other countries. The more often a country received aid before the reform the more affected the country is. The reform and its differential effect allow me to instrument the EU allocation.
Using the INTERFAIS database, I find that other donors do take account of the EU allo-cation choices to determine their own alloallo-cations. Thus not only the alloallo-cation of food aid is skewed by the own interests of donors, but this bias is reinforced by a set of interactions between donors. In fact on average if the EU allocates aid to a country it increases by one the number of other donors. I then studied the heterogeneity of responses by donors. There is a wide variety of response among donors. Large donors and Nordic countries complement the EU while the WFP substitutes.
I then developed a framework in order to classify donors that offers two main reasons why donors react to the allocation of the European Union. They react indirectly for reasons related to the recipient (altruism, geopolitical concerns) or directly because they compare their allocation with the European Union. This allows me to propose a typology of donors based on their behavior towards the allocation of aid. For small countries, donors tend to react to the allocation of the European Union by directly comparing their allocation to that of the European Union. Large donors within and outside the EU and Nordic countries react directly to the EU while the WFP is recipient-driven.
This chapter is one of the first studies showing empirically that donors are responding to the allocation of other donors. This has important consequences in terms of potential reform to implement in order to improve donor coordination in order to improve the effectiveness of aid ; especially as the reactions of reasons are twofold and vary among donors.
Does Food Aid Disrupt Local Food
Market? Evidence from Rural
Ethiopia
Abstract1
The paper examines the impact of food aid on households’ marketing behavior, based on a panel of households followed between 1994 and 2009 in 15 villages of Ethiopia. The impact of aid is examined at the intensive margin (on quantities produced, sold or bought by the house-holds) and at the extensive margin (on the number of producers, sellers and buyers). Food aid reduces the probability of being a producer. It also increases the probability of being a seller after a reform of aid policy in 2004 from ’repeated emergency distributions’ towards a multi-year program aiming at agricultural development.
1. This chapter is co-authored with Akiko Suwa-Eisenmann. It was published in December 2015 in World
Development.
We thank participants of the Casual Friday Development Seminar at the Paris School of Economics and the First International Conference on Global Food Security. For their helpful comments we are especially grateful to Luc Behaghel, Denis Cogneau and Karen Macours. Nathalie Ferrière thanks University of Paris 1 - Panthéon Sorbonne for its fellowship. The research leading to these results has received funding from the European Union’s Seventh Framework Programme FP7/2007-2011 under Grant Agreement n290693 FOODSECURE. The authors only are responsible for any omissions or deficiencies. Neither the FOODSECURE project and any of its partner organizations, nor any organization of the European Union or European Commission are accountable for the content of papers.
The ERHS data have been made available by the Economics Department, Addis Ababa University, the Centre for the Study of African Economies, University of Oxford and the International Food Policy Research Institute. Funding for data collection was provided by the Economic and Social Research Council (ESRC), the Swedish International Development Agency (SIDA) and the United States Agency for International Development (USAID) ; the preparation of the public release version of these data was supported in part by the World Bank. AAU, CSAE, IFPRI, ESRC, SIDA, USAID and the World Bank are not responsible for any errors in these data or for their use or interpretation.
1.1
Introduction
Food aid has evolved in recent years from a one-size-fits-all food transfer to a variety of interventions, tailored to the context and needs of recipient households: food can be distribu-ted for free or in exchange of work (Bezu & Holden, 2008) ; it can be transferred in cash or in-kind (Hoddinott et al. , 2014; Sabates-Wheeler & Devereux, 2010) ; in the latter case, it can be procured locally (or regionally) or shipped from overseas (Lentz et al. , 2013; Garg et al. , 2013; Violette et al. , 2013). Free food can be distributed to specific groups such as meals for schoolchildren ; food-for-work may be coupled with agricultural investments. The efficacy of this wide array of interventions is attracting attention as ever (Lentz & Barrett, 2008).
This paper re-examines an important question on the efficiency of aid, namely if food aid could have a negative impact on production, sales and purchases by recipient households, thus disturbing crop marketing. This question has been already largely debated. We take advantage of a panel dataset stretching over 1994-2009, in a country that was one of the world top aid recipients, Ethiopia.2 This long period allows us to assess whether there is "aid dependency" in
the long run ; moreover, as Ethiopia has overhauled its aid policy in the mid 2000s, we can see if the shift in aid philosophy in the recent years, from simple commodity transfers to holistic developmental interventions, can be felt on local markets. Using a panel of households followed over fifteen years allows controlling for the endogenous allocation of aid in an innovative way.
In a poor country where most aid recipients are farmers, food aid can have a negative impact on production if aid is non additional (meaning that food aid transfers do not increase food consumption by an equal amount) and partly monetized, thus depressing the prices received by agricultural producers (Schultz, 1960). On the other hand, food aid also raises income, hence the demand for food bought on the local market, mitigating the negative price effect. In the case of food-for-work, there is also the risk that the program might displace normal employment. In the long run, repeated aid could also create dependency and lack of agricultural investments by farmers themselves or by the government. It could also shift consumers’ preferences away from indigenous food (Maxwell & Singer, 1979; Maxwell, 1991; Barrett & Maxwell, 2007).
A variety of papers have put these assumptions to the data, and among them, many on Ethiopia. Four lessons emerge from this rich literature. First, there is a discrepancy between micro and macro approaches. While some (but not all) macro studies have found a small disin-centive impact of aid at the country or at the regional level (Mann, 1967; Isenman & Singer, 1977; Barrett et al. , 1999; Gelan, 2006; Tadesse & Shively, 2009), micro studies have failed to find any significant and negative impact of aid at the household level (Abdulai et al. , 2005).
2. According to INTERFAIS, the Food Aid Information System created by the World Food Programme (WFP), Ethiopia was the second largest recipient of food aid in the world in 2004 and the first one from 2008 to 2011. About 5 million Ethiopians live in food insecurity, especially in rural zones.
Second, the dynamic impact of aid is worth studying, as short-term effects may differ from long-term ones. Abdulai et al. (2005) find a slight negative impact of aid received in 1994 in Ethiopia on labor supply for permanent and semi-permanent crops one year later, while they see no significant impact of current aid.
Third, a major difficulty in assessing the impact of aid comes from the endogeneity of aid allocation, namely, that aid is not distributed at random but is the result of targeting. Without controlling for targeting, Abdulai et al. (2005) find a negative impact of aid on households’ la-bor supply and use of agricultural inputs. But this negative impact vanishes once controlled for household characteristics that might explain aid allocation. Hence, aid must be considered as an endogenous variable and the problem becomes one of finding a credible instrument that might explain aid allocation but not the outcome. Abdulai et al. (2005) instrument aid by house-holds’ observable characteristics and whether they have received aid in the past (thus assuming a kind of "aid inertia"). Gilligan et al. (2009) use a propensity score matching method. The propensity score is based on observable household characteristics ; moreover, as the matching compares treated and non-treated households in the same village, the method implicitly takes into account unobservable characteristics at the community level. However, they are not control-ling for unobservable characteristics at the household level that might also explain aid allocation. Fourth, the impact of aid on households is heterogeneous, because of the varying degrees of households’ reliance on local markets. Levinsohn & McMillan (2007) show that the effect of aid on poverty depends on whether the household is a net buyer or a net seller. In the case of Ethiopia, poor households who are mostly net buyers will benefit from the low prices induced by aid. Yamano et al. (2000) look at the impact of food aid on local markets and suggest that purchases and sales must be examined separately. Based on a 1996 survey in Ethiopia, they find that food-for-work decreases local purchases of wheat, while free food transfers slightly decrease wheat sales. However, they do not take into account the endogeneity of aid allocation.
In this paper, we try to go further on these four points. First, we take into account hete-rogeneity of impact. We consider as Yamano et al. (2000) that the impact of aid depends on households being buyers or sellers of the crop they receive. We add two more groups: households that might grow a crop without selling or purchasing it on the local market (they are in autarky, producing for their own consumption only) ; and households that neither produce nor buy the crop that they receive as a food transfer. These four categories define what we call the "type" of households’ participation to markets.
The data shows that households do indeed switch their type of market participation from one year to another. Wouldn’t be likely that receiving food aid in non negligible quantity has influenced their decision to do so? Hence, we look at the impact of aid at the intensive margin (on quantities, controlling for a given type of market participation), and at the extensive margin
(on the type of market participation itself). We focus on wheat, which is the most distributed crop in food transfers in Ethiopia.
Second, we refine the estimation method in order to take into account the endogenous alloca-tion of aid. Our strategy is based on the panel dimension of the dataset we are using, five rounds of the Ethiopian Rural Household Survey (ERHS) between 1994 and 2009. As the dependent variables are a mix of continuous variables (for instance, the quantities produced) and discrete variables (such as the decision to produce), we cannot simply include household fixed effects. We estimate a panel tobit which allows for selection and endogeneity, a method presented by Semykina & Wooldridge (2010). Households fixed effects are included as the average over time of households characteristics. This method allows taking into account time-invariant unobservable household characteristics that might explain the allocation of aid.
On the dynamic impact of aid, we take advantage of the fact that aid is included twice in our estimations: first, as the current quantity of aid received by the household and as the average quantity received over fifteen years. The coefficient of the latter variable may be interpreted as an indicator of aid dependency in the long-run and will be contrasted with the short-term impact. Moreover, the impact of these two variables will be followed over fifteen years, a period during which Ethiopia has overhauled its aid policy. We will also distinguish between the impact of free food transfers and food-for-work.
The main findings of the paper are the following. On production, food aid has an impact at the extensive margin: it decreases the probability of being a wheat producer. Once controlled for selection, there is no evidence of any impact at the intensive margin, on quantities produ-ced. This finding might help reconcile macro studies that find a slight negative impact of aid on production and micro studies that fail do to so: even thought there is no significant impact on average individual productivity aid reduces the number of producers, thus decreasing aggre-gate (nationwide) production. Based on reasonable assumptions, our results suggest that aid in wheat has decreased wheat output by 114’000 tons in Ethiopia in 2009 compared to a total production of 3 million tons, a negative but small impact, which does not undermine the utility of aid in general.
Food aid has also an impact on sales after 2004. Here too, the channel goes through the extensive margin: after 2004, aid increases the probability of a household to be selling wheat, es-pecially in the case of food-for-work. On the other hand, food aid (mostly free food distribution) had a positive impact on the probability of buying wheat before 2004 ; the effect is no longer significant and switches sign after 2004. The impact at the intensive margin, on quantities of wheat sold or purchased by households, is not significant. The change in 2004 coincides with the introduction of innovative aid policies in Ethiopia, aimed at building agricultural assets. Our results suggest that aid reform did make a difference in households’ marketing behavior.
Moreover, our results show the importance of factors that relate to the frequency and closeness of local markets within the district.
The remainder of the paper is structured as follows: section 1.2 sets the context of food aid in Ethiopia and recalls related literature ; section 1.3 describes the data and households’ heterogeneity with respect to market participation. In section 1.4, we present the empirical framework and the way we deal with selection and reverse causality. Section 1.5 discusses the empirical results and the robustness checks before we conclude in section 1.6.
1.2
Context
1.2.1 Food aid in Ethiopia
Ethiopia has been one of the world’s major recipients of international food aid for decades. As a result, over the last twenty years, food aid has amounted to one-tenth of domestic pro-duction in Ethiopia (Planel, 2005). For wheat, a major staple in the country, food aid has even reached 40 percent of domestic production.3
Ethiopia has faced a major shift in food aid policy in the mid 2000s. Before that date, food aid was basically repeated emergency interventions. While those interventions were successful in terms of alleviating starvation, they did not prevent asset depletion and were not integrated in agricultural development activities (Berhane et al. , 2014).
Against this background, a number of policy changes have occurred. First allocation criteria of free food aid were reformed(DRMFSS, 1995, 2003). Before 2003 those who used to be eligible for free food delivery were the elderly, disabled persons, lactating or pregnant women, and hou-sehold members attending to young children. In 2003, the Disaster Risk Management and Food Security Sector revised the official guidelines and introduced the Household Economic Approach. This method is based on a survey that assesses hazard probability and coping strategies at the household level. For instance, it takes into account resources available to the household, such as assets (livestock) or relatives who could give transfers. While the Household Economic Approach is based on sound economic theory, it is hard to apply on the ground, partly because the ins-titutional channels through which aid is actually allocated have hardly changed (Shoham, 2005). Secondly starting 2004-2005, Ethiopia, with the help of donors, implemented the Productive Safety Net Program (PSNP). This multi-year program seeks to prevent asset depletion at the household level and build assets at the community level ; it also ensures timely and predictable 3. Data from the UN’s World Food Programme for aid in wheat and from the Food and Agriculture Organi-zation for wheat production.
cash and/or food transfers to chronically food-insecure people.4 The program covers now more
than 50 percent of the communities (woredas) in the country.5The shift from “annual emergency
aid" to an integrated safety net approach is likely to have influenced households’ marketing behavior and is worth studying over time.
1.2.2 Related studies on Ethiopia
As one of the countries most dependent on food aid, Ethiopia has been the focus of nume-rous studies.
A first stream of work focuses on targeting and dependency. Aid allocation in Ethiopia re-sults from a three-step process where the government decides the geographical allocation of aid at the regional level, regional leaders decide the allocation of aid by woreda, and local leaders at the Peasant Association (PA) level select households within each community. All steps are subject to inefficiency and potential political capture. According to Clay et al. (1999), Jayne
et al. (2001) and Enten (2008), allocation at the woreda level results from negotiations between
the government, the administrative staff and local communities and, as a result, is not (entirely) related to effective needs. These three papers, although written ten years apart, show that the Tigray region has been favored because of its close ties to the government.6At the local level,
re-cipient households with political connections and involved in village organizations receive more food aid than recipient households without connections (Broussard et al. , 2014). The system perpetuates itself, as PA leaders who are elected are reportedly manipulating the election, by threatening voters that they will be excluded from federal support (Human Rights Watch, 2010). Two consequences emerge from these papers on allocation process in Ethiopia. First, tar-geting is likely to be imperfect. Only 22 percent of food-insecure people received some aid ; this comes either because their district was not targeted or because their household was not selected (Planel, 2005). As allocation under the new Household Economic Approach relies less than before on easily households’ observable characteristics such as age and gender, it may be subject to political capture.
4. The first year of implementation of the PSNP has coincided with a large increase in both the number of households receiving food-for-work and those receiving free food transfers. The PNSP was to be complemented by improvements in access to credit and seeds that were included in the Other Food Security Programme (OFSP). The latter lacked sufficient agricultural extension agents and the coverage was limited. Hence, the OFSP was redesigned in 2009 and a new program was introduced, called the Household Asset Building Program (HABP).
5. A woreda is an administrative unit, defined below region and zone, and roughly equivalent to a district elsewhere. Woredas are composed by kebeles (group of villages) and peasant associations (PA). In order to obtain land, households have to register with the PA which keeps the list of recipient households. A peasant association can cover many villages. For instance, the Adele Keke PA consists of 28 villages.
6. Politically motivated aid allocation is of course not restricted to Ethiopia. For instance, in Madagascar, regions with close ties to the government receive more aid (Francken et al. , 2012) .
Second, because of political stability in Ethiopia, with a national coalition staying in power for many years, it is likely that the same politically-connected households have received aid over time. Hence, the part of the selection that is based on unobservable households characteristics such as political connections may be considered as time-invariant.
Political capture is not the only culprit of poor targeting. The fixed costs of setting operations and identifying needs also account for the inertia of food aid allocation. Jayne et al. (2002) show, based on a nationally representative rural dataset of 1996, that the spatial allocation of aid in 1996 is highly correlated with the spatial pattern of vulnerability in 1984 during the famine and is concentrated in areas that are not the poorest. The inertia is particularly prevalent for food-for-work, possibly because the latter is often a multi-year program.
Asfaw et al. (2011) investigate the determinants of participation in food aid programs and the impact of such programs on poverty reduction, based on the ERHS surveys from 1999 and 2004. They show that households’ size and asset endowments determine the extent of poverty alleviation and food aid dependency. Based on quantitative and qualitative data from 1999-2000 and 2002-2003, Little (2008) finds that food aid plays a significant role in households’ recovery strategies, without creating dependency. This is due to the fact that aid deliveries are poorly timed and come with uncertainty. Bevan & Pankhurst (2006) have conducted interviews in 20 villages, including the villages surveyed in the ERHS. Their study gives a sense of attitudes towards aid. Respondents mention that aid in the long-term can make "people lazy". They also claim that food aid may come too late, is insufficient and distributed in centers that are too far away.
A second stream of literature investigates the impact of food aid on food prices and food production. Levinsohn & McMillan (2007) argue that the impact of aid on poverty depends on its effect on prices and on the household being a net seller or a net buyer. Based on two nationally representative household surveys in 1999-2000, they estimate the welfare impact of a change in prices and infer the impact of food aid on prices using a partial equilibrium model. They find that aid is alleviating poverty in the short term, as net buyers are more numerous than net sellers and poorer. Kirwan & McMillan (2007) extend the time span of the previous analysis to the period 1970-2003 and use indirect evidence based on aggregate data on production and prices. They find no correlation between food aid and producer prices, the latter declining stea-dily after 1984 while food aid, mostly driven by variations in the US price of wheat, has been volatile. As a consequence, food aid might have an impact on long-run production, not through prices but because of uncertainty about shipments that might have deterred investment in the wheat sector. Re-examining the relationship between aid and prices, Assefa Arega & Shively (2014), using monthly data over 2007-2010, do not find an impact of food aid on local producer prices of wheat, teff and maize in Ethiopia.
finds a disincentive impact of food aid on domestic food production. Removing food aid stimu-lates demand and generates an expansion of the food producing sector with a slight increase in producer prices. In general equilibrium, consumers would substitute between grains ; as house-holds receive wheat for free, they would shift away from maize or teff, hurting not only wheat growers but also the producers of other cereals.
Abdulai et al. (2005) re-examines the impact of aid on food production both at the micro level on Ethiopia and at the macro level with a VAR model estimated on 42 Sub-Saharan Afri-can countries. They do not find evidence of a disincentive impact with either method. If any, the macro analysis tends even to find a positive impact of food aid on production one or two years later. The micro analysis is based on two rounds of the ERHS in 1994 and one in 1995. They estimate the impact of receiving food aid on various outcomes: labor supply (of various sorts: on-and off-farm, wage work on-and own business, male on-and female), agricultural investment on-and use of inputs, and informal labor sharing. Some of these outcomes are of a 0/1 type. Others are conti-nuous with zero values, and are estimated with a tobit. A naive estimation finds that aid has a strong disincentive impact. However, once controlled for household characteristics that might explain aid allocation (location, age, gender and education of household head, household size and holdings of land and oxen), only one impact remain significant (and positive), on off-farm female wage work. Then they estimate a model where aid is endogenous and is instrumented by past aid, reflecting an inertia effect as in Jayne et al. (2002). Aid received one year before, in early 1994, has a small disincentive effect on family labor supply for permanent and semi-permanent crops. On the contrary, contemporaneous aid (that received in 1995) has a positive impact on the same type of labor supply. Both past and current aid increase male labor supply of off-farm work. Overall, these findings make a very convincing case on the convergence of macro and micro analysis and the non existence of disincentive effects of aid in Ethiopia, at least in the short run. Recent papers focus on the PNSP (Gilligan et al. , 2009; Hoddinott et al. , 2012; Berhane
et al. , 2014) using propensity score matching and difference-in-difference estimations. The
propensity score matching is based on observable households’ characteristics. It also accounts for unobservable characteristics at the village level, as it compares treated and control hou-seholds from the same woreda. The first paper finds a weak impact of PNSP in its first year of implementation in 2006 because of delays and under-payment of transfers. Aid recipients tend to increase their livestock suggesting a positive impact of aid on production. The second paper finds a positive impact of the PSNP on agricultural inputs use, especially when it is coupled with the OFSP extension program. The third paper considers treatment as continuous: it is the number of years of PNSP transfers. The paper compares the outcome between one and five years of PNSP. The propensity score is based on the demographic characteristics of the households before the program. Aid has a positive effect on food security and livestock holdings. A third direction in the literature compares the different types of aid (Yamano et al. , 2000;
Gilligan & Hoddinott, 2007; Bezu & Holden, 2008). For instance, food-for-work (FFW) target household members that are able to work and provide them a job with payments usually in-kind. If work requirements are harsh, not all eligible households enroll in the program, thus, there is self-selection on top of eligibility criteria. By contrast, free distribution is aiming at those that cannot work, children or elderly people. Bezu & Holden (2008) finds that food-for-work has encouraged the adoption of fertilizer in Tigray in 2001. They estimate a Heckman two-step model where first the household decides whether to adopt fertilizers, before deciding the actual quantity, conditional on selection. Gilligan & Hoddinott (2007) compares two programs that were expanded after the 2002 drought, free food distribution (FFD) of the "Gratuitous Relief", and food-for-work (the "Employment Generation Scheme" or EGS). They use the 1999 and 2004 waves of the ERHS and estimate a propensity score. They find that EGS participants had significantly lower growth of livestock holdings ; the effect is partly driven by outliers (some hou-seholds with large livestock in the control group). Houhou-seholds could also have decreased their precautionary saving as they felt protected and insured by aid. On the other hand, free food distribution was better targeted and smaller in size and had no significant impact on livestock. Yamano et al. (2000) also distinguish between FFW and free distribution and examine their impact on purchases and sales separately. They argue that looking at net sales is not sufficient in order to assess the impact on local markets. They find that FFW decreases the purchase of wheat, while free distribution decreases the level of sales albeit the effect is small and not statistically significant.7
To push their argument one step further, one would like to examine other types of market participation, such as households that grow wheat for their own consumption. Moreover, aid might not only influence the quantities sold or bought, but also the 0/1 decision of the type of market participation, for instance, determining producers who were growing wheat for their own consumption, to sell on the local market. Moreover, Yamano et al. (2000) were not controlling for the endogeneity of aid allocation. Last, we would like to take advantage of a panel stretching over 1994 and 2009 and contrast the short-run and the long-run impact of aid as well as look for any change in households’ behavior following the reform of aid policy in Ethiopia in the mid 2000s.
7. Another differentiating characteristic of food aid is whether it is sourced from local or regional procurement (LRP) or shipped from overseas. Lentz et al. (2013) show that LRP aid reduces delay and improves the adequacy between needs and shipments ; thus, it should reduce the risk of disincentive effect. Violette et al. (2013) show that LRP is more culturally accepted. This may reduce the negative impact on markets, as households are more likely to consume LRP aid instead of selling it, a consequence that is not investigated in their paper. Garg
et al. (2013) examines the potential price effect of LRP aid and do not find any statistically significant impact.
Unfortunately the EHRS does not provide information on the type of procurement. At the country level, one quarter of aid in wheat comes from local purchases (INTERFAIS-WFP).
1.3
Data and descriptive statistics
Our data comes from the Ethiopian Rural Household Survey Dataset (EHRS), a longitudi-nal survey which covers some villages between 1989 and 2009. The survey results from a joint project between Addis Ababa University, the CSAE at the University of Oxford and IFPRI. The data are not nationally representative but account for the diversity of non-pastoral farming systems in the country (see Dercon & Hoddinott (2009) for more details). The survey gives information on household characteristics, agriculture and livestock, food consumption, transfers and remittances, health, women’s activities, and information at the village level on electricity and water, health services and education, wages, production and marketing.
Most of the results of this paper are based on a balanced panel of 1215 households in 15 villages, followed over 5 rounds (in 1994, 1995, 1999, 2004 and 2009).8 In the robustness checks,
we also run the estimations on the whole (unbalanced) sample.
Table 1.1 provides descriptive statistics of the sample. The poverty rate was 48.2 percent in 1994, decreased in the late 1990s and early 2000s, but has returned to its previous level in 2009. Households are cultivating 1.5 hectares on average. The worst harvest took place in 1995 with only 533 kgs of wheat produced by the average household, and the best in 2009 with a production three times higher. The size of livestock holdings has increased continually since 1994 and reaches an average of 5 tropical livestock units in 2009 (one tropical livestock unit -TLU - equals 1 cow or 10 goats or 11 sheep or 100 chickens).
[Table 1.1 here]
The variables of interest are whether a household has received free food aid or food-for-work, and the quantities received. We focus on one crop, wheat, which is one of the major cereals in Ethiopia. From the mid-1990s, wheat consumption has increased steadily in both urban and rural areas and wheat has become one of the top priority crops deemed to solve food security challenges in the country (Tefera, 2012). Thus, a large share of food aid is provided in wheat (74 percent in our sample).9
The share of recipients is highly variable: only seven percent of households received free food aid in 1995 whereas almost 30 percent did so in 2009.10 Hence, on average, only one third of
8. We drop the second round of EHRS (December 1994-January 1995), as its reference period was six months instead of one year, and the fourth round (1997), which surveyed additional villages. However we include pro-duction, sales and food aid of the second round in order to compute the annual quantities in 1995.
9. At the national level, aid in wheat represents about 72 percent of total food aid from 1988 to 2011 (INTERFAIS-WFP).
10. In 1995, total food aid distributed across the world dropped as the US reduced its shipments because of a spike in food prices.
beneficiaries receives a transfer again in the next round (Table 1.2).
The share varies between villages as well, from zero to almost 80 percent. Quantities of wheat received per household vary from 30 kilograms in 1995 to 100 kilograms in 1999. The share of household benefiting from food-for-work programs was stable during the 1990s at around 10–11 percent. It has doubled after 2004.11
[Table 1.2 here]
Looking at targeting criteria (Table 1.3), recipient households have fewer and older members. They have fewer children on average, though we would have expected the opposite, given the official allocation guidelines before 2004. Food-for-work and free food aid recipients seem to differ in terms of agricultural assets and household composition. Households receiving free food are smaller than those receiving food-for-work but have more old-age members. Food-for-work households, as expected, cultivate less land than other households and have less livestock.
[Table 1.3 here]
Regarding households market participation, we define four groups. First, households can be wheat buyers or sellers (these categories are defined in gross terms). They can grow wheat for their own consumption, without selling or buying it: these households are called "autarkic". Finally, they can be "non-involved" (in any wheat-related activity), meaning that they neither produce nor buy wheat. Household are considered as producers if they sow wheat, even if they get no harvest.
All four types of market participation are present in Ethiopia.12 The share of households
cultivating wheat (for their own use or to sell) increases over time, going from 24 percent in 1994 to 32 percent in 2009. 11 percent of households were sellers and 18 percent buyers in 2009 ; 20 percent were in autarky and 55 percent were "non-involved". As buyers and sellers are defined in gross terms, they might overlap (as some households are doing both) but these are in very small number, making up less than four percent of the sample.
Households’ market participation status is not stable across rounds (Table 1.4). Transition happens mostly between buyers and non-involved households, and to a lesser extent between sellers and autarkic households. In addition, only three-quarter of households that have grown wheat at time t cultivate it again at time t + 1 (not reported in the Table).
11. 2004-2005 marks the end of a long drought and the first implementation year of the PSNP.
12. The exception is 1995, when the data shows no autarkic households and a large increase of the number of sellers. One reason might be a policy shift that has enhanced incentives to sell: "In the 1995/96 season, the Ethiopian Grain Trading Enterprise was explicitly mandated to support producers’ maize and wheat prices at the stated support price" (Negassa & Jayne, 1997). In the robustness check, we present the estimations without 1995.
[Table 1.4 here]
In the descriptive statistics, food aid recipients differ from other households in terms of their market participation status. Beneficiaries are more likely to be non-involved in wheat-related activity and less likely to be autarkic households or sellers (Table 1.5). They are as likely to buy wheat. Regarding quantities, aid recipients produce less (the difference being significant at 1 percent level of confidence for autarkic households) ; they also buy more wheat. However, they sell as much as non-recipient households. How much of these differences come from selection and endogenous aid allocation and how much could be triggered by aid itself?
[Table 1.5 here]
1.4
Empirical specification
1.4.1 On production
We model simultaneously the production decision and the quantity produced. We allow food aid to affect both stages differently. We run a panel Tobit type II with selection and endogeneity (Semykina & Wooldridge, 2010). The model is defined as:
yit = yit∗ ∗ sit sit = 1s∗ it>0 yit∗ = xitβ+ γ1F Ait+ ci1+ uit1 s∗it = xitβ2t+ z1itδt+ γ2tF Ait+ ci2+ uit2 (1.1)
where yitis the quantity of wheat produced in year t by household i, and sit is the househol-d’s 0/1 decision to produce. Both are observed if s∗
it, the latent variable that drives production decision, is higher than 0. y∗
itis the latent variable that drives the level of production. F Aitis the quantity of wheat aid received in the last 12 months by each household (through free food dis-tribution and/or food-for-work programs). If food aid is well targeted, we should expect that it affects neither the decision to produce nor the quantities. ci1and ci2are households fixed effects.
xit are control variables, meant to capture market conditions and transactions costs: whe-ther whe-there is a daily market within the Peasant Association, the distance to the nearest market and regional dummies. We also add consumption and production shifters such as household size (per adult equivalent), the age of the household’s head, whether the household is poor, the amount of non-food consumption, livestock size (in tropical livestock units) and the size of the cultivated plot (in hectares). The household size takes into account the fact that larger families can allocate more labor on their plots. The size of livestock holdings matters in two ways for cereals production: first, part of the harvest is used to feed the livestock ; second, manure is used