HAL Id: halshs-01279896
https://halshs.archives-ouvertes.fr/halshs-01279896
Submitted on 27 Feb 2016
HAL is a multi-disciplinary open access archive for the deposit and dissemination of sci-entific research documents, whether they are pub-lished or not. The documents may come from teaching and research institutions in France or abroad, or from public or private research centers.
L’archive ouverte pluridisciplinaire HAL, est destinée au dépôt et à la diffusion de documents scientifiques de niveau recherche, publiés ou non, émanant des établissements d’enseignement et de recherche français ou étrangers, des laboratoires publics ou privés.
Outward foreign direct investment by Brazilian and
Indian multinational companies: comparison with
Russian-Chinese multinationals
Wladimir Andreff
To cite this version:
Wladimir Andreff. Outward foreign direct investment by Brazilian and Indian multinational compa-nies: comparison with Russian-Chinese multinationals. S. Balashova, V. Matyushok. The Trajectory of Growth and Structural Transformation of the World Economy Amid International Instability, Peo-ples’ Friendship University of Russia, pp.252-297, 2014. �halshs-01279896�
1
International Conference “The BRICS Countries: International Instability, Growth Trajectories and Structural Transformations”, People‟s Friendship University of Russia,
October 30-31, 2014
Outward foreign direct investment by Brazilian and Indian multinational
companies: comparison
with Russian-Chinese multinationals
Wladimir Andreff1
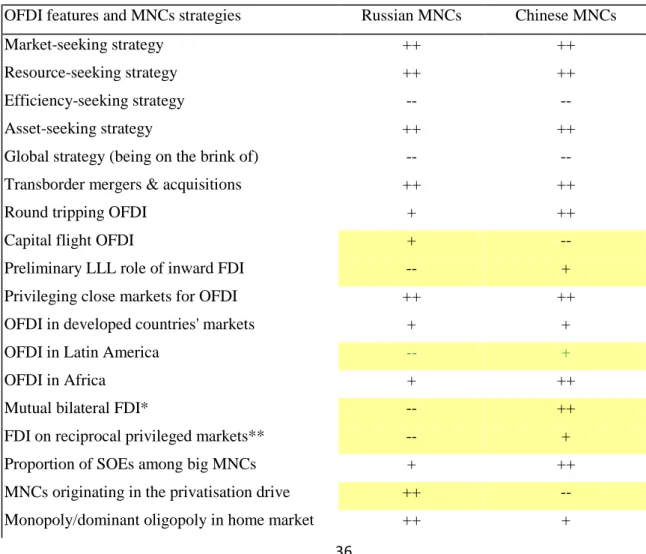
The purpose of this paper is to complete an overall comparative study of outward foreign direct investment (OFDI) from BRIC countries and strategies conducted by multinational corporations (MNCs) whose parent companies are based in the BRICs2. In a sense, it is a follow-up to three previous companion papers (Andreff, 2013a, 2013b & 2014) which already compared OFDI and strategies of those MNCs based in the two post-communist transition economies, China and Russia, which are classified with Brazil and India into the BRICs group. Here the focus is on Brazilian and Indian MNCs and their OFDI using as a benchmark major outcomes derived from the study of Chinese and Russian multinationals (Table 1). Such a benchmark does not mean that we were expecting at the starting point of this research to find the same OFDI features and MNC strategies for firms based in Brazil and India as those identified for Chinese and Russian companies that have extended their investments abroad. To the contrary the intent is to check, against a benchmark of MNCs emerging from former centrally planned economies with a single (communist) party regime, how much the differences in Brazilian and Indian market economies with a democratic political regime over the past decades3 countervail (or not) the assumed similarities across all the BRICs.
1 Professor Emeritus at the University Paris 1 Panthéon Sorbonne, Honorary Member of the European
Association for Comparative Economic Studies, Honorary President of the International Association of Sports Economists, and the European Sports Economics Association, former President of the French Economic Association.
2 This is a wider comparison than those already existing in the literature such as: Duanmu & Guney (2009),
Goldstein & Pusterla (2010), Milelli, Hay & Shi (2010), Tolentino (2010), Pradhan (2011), Zhao (2011), De Beule & Van den Bulcke (2012), Andreff & Balcet (2013), Kothari, Kotabe & Murphy (2013). The study by Holtbrügge & Kreppel (2012) indeed covers all the four BRICs‟ OFDI though only with case studies of eight companies.
3
Even though India has had a system of central planning from the 1950s on (but not a centralised mandatory quantitative planning as in former Soviet countries) until 1991 and Brazil has endeavoured some decades of authoritarian political regime before the 1990s.
2
Table 1 about here
The present paper reads as follows. Its starts with reminding in an historical perspective when and how first companies based in Brazil and India started up to proceed with OFDI, a final note comparing it with the first emerging Chinese and Russian MNCs (1). Then a brief empirical macro-description is provided of how Brazilian and Indian OFDI evolved over the past decade or so, again with a comparison to Chinese and Russian OFDI (2). Then it is exhibited how Brazilian and Indian MNCs have muddled through the crisis since 2008 as against Chinese and Russian MNCs (3). A next step consists in checking the specificities of Brazilian and Indian OFDI in terms of firm size and ownership, geographical orientation and industrial specialisation (4). The following section picks up from existing economic literature a comparison between the econometrically-tested determinants of Brazilian and Indian OFDI (5). Finally, the most significant differences of Brazilian and Indian MNCs when compared with Chinese and Russian MNCs are observed in the relationships between home-based investors abroad and the government (6). An overall comparative picture concludes (7).
1. The emergence of Brazilian and Indian multinational companies
Indian and Brazilian firms are known to have started up investing abroad earlier than Chinese and Russian MNCs, the latter respectively in 1979 and 1994. Indian OFDI first emerged as early as in the late 1950s while Brazilian OFDI dates back to the mid-1970s.
1.1. Emerging Brazilian MNCS
The first international flows of Brazilian companies investing abroad happened in the mid- 1970s. The economic slowdown of the late 1970s which led to the 1980s crisis was a main reason mentioned by Brazilian entrepreneurs to explain this first wave of Brazilian OFDI. Domestic economic slowdown was the first factor pushing Brazilian firms to internationalise. At the time being banks, engineering service firms and Petrobrás expanded their activities to bordering countries. Between 1975 and 1980, a dozen Brazilian MNCs had already emerged (Andreff, 1982; Lall, 1983a).
Data from the Brazilian Central Bank show that foreign investments were concentrated in financial services, up to 54% of OFDI flows in 1980 (Villela, 1983). The strong presence of banking investments overseas was strategically targeted to support the marked expansion of Brazilian firms exporting activities. Besides banking services, first Brazilian MNCs were
3
involved in other sectors such as oil exploration and production, construction and engineering, and a few manufacturing. Its main destination was Latin American, then African (oil and construction) and Middle East countries (engineering services). During the 1980s trade agreements motivated Brazilian MNCs in the auto parts and electrical industry to set up production facilities in Argentina. Villela (1983) provides a list of the largest non-financial investors abroad in the 1980s: Petrobràs (oil and gas), Copersucar (coffee), Mendes Junior (construction), Vale do Rio Doce (mining), Camargo Corrêa (engineering), Odebrecht (construction) and Brahma (beverages). In 1982, Brazilian MNCs were already holding 147 subsidiaries abroad.
Since the early 1990s, large Brazilian companies have entered a new stage in their internationalisation process (Cyrino et al., 2010) though Brazilian OFDI was relatively insignificant up to the late 1990s. In 1995, UNCTAD listed only four Brazilian (and no Indian) firms among the top 50 TNCs based in developing countries: Petrobras, Vale, Brahma and Sadia Concordia. OFDI flows soared in the 1990s as a consequence of deregulation, privatisation and trade liberalisation followed by Brazil‟s outward oriented economic strategy, as in many Latin American countries during this period of time. Consequently in the second half of the 1990s, due to economic and institutional reforms in Brazil, a tendency to growing internationalisation of Brazilian firms was registered; OFDI was triggered by a strategy of expanding business in foreign markets (market-seeking FDI). This process has particularly developed after 2002, corresponding to a recovery of the Brazilian economy from the 2001 crisis, after it has been driven by a cycle of economic growth in developed and developing countries (Amal et al., 2012).
1.2. Emerging Indian MNCs
In a pioneering paper, Lecraw (1977) checked that nine Indian firms had already invested in Thailand at the time being. According to Lall (1983b), the first OFDI from India occurred as early as 1962 with Jay Engineering Works setting an assembly line for sewing machines in Sri Lanka. In fact, the really first one was the establishment of a textile mill in Ethiopia by Birlas in 1955 (Saikia, 2012). Indian firms began to significantly invest abroad in the 1960s, but India‟s restrictive OFDI regime limited them to small, minority joint ventures (JVs) in developing countries such as Kenya, Uganda, Nigeria, Malaysia Thailand and Sri Lanka. In manufacturing industries, seven Indian MNCs had eight subsidiaries in four less developed
4
countries till 1968 (Agarwal, 1985). The liberalisation of OFDI policy pushed up Indian firms to invest abroad but under stringent conditions fixed by the state, namely with the objective of developing JVs with foreign partners rather than fully-owned subsidiaries.
Indian OFDI developed in the 1970s, reaching a peak in 1976-1977, then slowing down. At the moment, Indian OFDI was felt – namely by the government – as a tool for export promotion in particular in the equipment goods industry. This drove market-seeking OFDI primarily in neighbouring host countries like Malaysia, Indonesia, Singapore, and Thailand, and other Asian developing countries, but also in the Middle-East and few African countries, with a focus on countries having a significant number of people with Indian origins as local residents, as well as slightly in the U.K. and the USA. In the 1970s, India was reported as a net exporter of FDI since as a planned economy it hosted a very low level of inward FDI. In 1980, 82% of Indian OFDI was located in the manufacturing industry and 18% in the tertiary sector. In 1982, India had 225 JVs in 37 developing and developed countries. Compared to MNCs from other BRICs, Indian MNCs were clearly benefiting from a first mover advantage. The major Indian MNCs in the 1980s were Birla, Thapar, Tata group, JK Group, Modi, Hindustan Machine Tools, Usha Martin Black, Kirloskar, Shahibag, Godrej, Larsen & Toubro, Sarabhai, Indian Tobacco, Mahindra & Mahindra, Nowrosjee Wadia, and Mafatlal. Some were partially or fully state-owned but most of them were owned by Indian family capital though often in collaboration with the state – public financial institutions (Grou, 1988). The size of their OFDI was still rather modest.
With the liberalisation of the Indian economy in the 1990s, targeting inward and outward FDI since 1994, the number of Indian firms investing abroad grew up: in the pharmaceutical industry, 11 companies had 15 JVs in other developing countries in the 1980s while over the 1990-2000 period the corresponding figures reached 55 companies and 142 JVs and wholly- owned subsidiaries (Bruschieri, 2008); in the automotive industry 10 Indian firms had invested abroad in 1990-1999, and 55 in 2000-2007. Faced with a downturn of the Indian economy between 1998 and 2002, Indian firms internationalised operations not only for their survival but with specific strategies for sustained growth (Kant, 2008).
A classical presentation of India‟s OFDI in historical perspective splits it into three phases (Hansen, 2010). The first phase (1970s-1980s) was mainly led by modest investments made in JVs in Asia and Africa and was shaped by political and regulatory restrictive government policies. Second was the start up phase (1990s-early 2000s) which was largely an outcome of more liberal government stance on FDI (see 6.2 below). The third was the take-off phase
5
(from early 2000s on) when Indian OFDI exhibited a totally different trend as compared to previous two phases in terms of growth, industrial composition, and geographical orientation. Let us end up with a paradox: Brazil and primarily India had benefited from a first mover advantage, compared to other BRICs, as regards investing abroad. However, at the end of the day, in 2009-2012, both countries are lagging behind China and Russia whose OFDI benefited from a last mover fast growth since the 1990s – a sort of swift catching-up process.
2. Outward FDI from Brazil and India
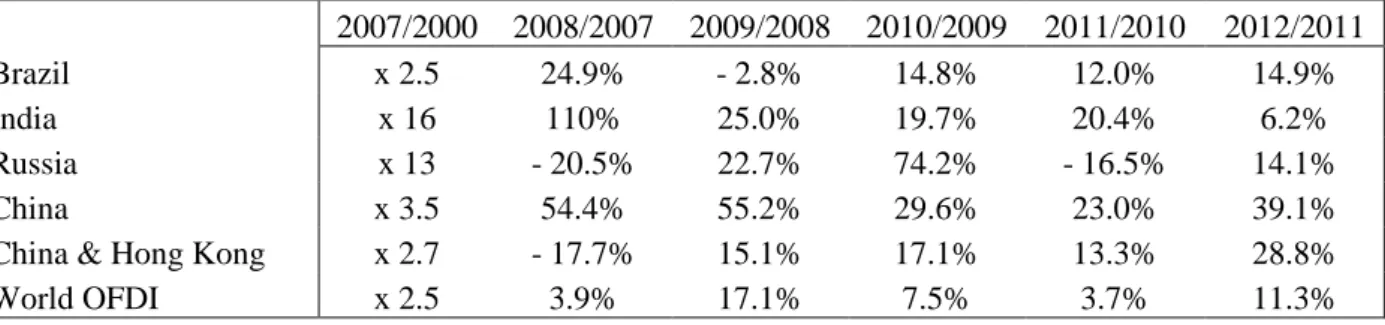
Brazil‟s OFDI had a fast development momentum between 1997 and 20004 in the wake of privatisation and deregulation; it multiplied by 7 as against Russian OFDI multiplied by 3, Indian OFDI multiplied by 2 and Chinese OFDI5 increasing by 33% over 1997-2000 (Table 2). For all the BRICs, high-speed OFDI growth has only taken place in the 21st century. However Brazilian OFDI stock in 2000-2007, multiplied by 2.5 and grew exactly at the same pace as the world OFDI stock overall (Table 4); consequently, its pace was passed over by OFDI stock from China (x 3.5), Russia (x 13) and India (x 16). Despite its impressive growth, Indian OFDI stock remained by far quite smaller than the Russian (8 times smaller), Brazilian (4 times) and Chinese (3 times) ones in 2007. On the brink of financial crisis, with regards to investing abroad, the major BRIC was Russia whereas the laggard was India, with Brazil and China in between. This confirms that Russian OFDI achieved a world record in terms of growth from 2000 to 2007 (Andreff, 2014), but Brazil performed rather well in comparison, keeping a second rank standing among the BRICs after Russia as regards its OFDI stock. Indian was the fastest growing source of OFDI flows among the BRICs right before the crisis. .
Table 2 about here
Looking at Table 3, and with reference to Dunning‟s IDP model (Dunning, 1981; Dunning & Narula, 1998)6, Brazil exhibits a quite lower OFDI/GDP ratio than Russia – twice lower from
4 However, its growth pace was slower than OFDI from other Latin American countries such as Argentina,
Chile, Mexico and Venezuela (Daniels, Krug & Trevino, 2007).
5 All the comments refer to OFDI from mainland China; on the additional role of Hong Kong OFDI see, among
others, Andreff (2014).
6
One paper raises some doubt about Indian inward and outward FDI exactly matching the stylized IDP model (Verma & Brennan, 2011), but the study is too much macroeconomic to be convincing since it neglects both sectoral and bilateral dimensions of FDI.
6
1999 to 2011 – while it is much higher than in India and China which compare in this respect. If an OFDI/GDP ratio higher than 5% were assumed to be required for a country to be in the third stage of IDP model (Andreff, 2003a), Brazil and Russia reached it in the early 2000s while India and China attained such stage only by 2011. With regards to the outward/inward FDI stock ratio, Brazil and India had the lowest in 1999; this ratio multiplied by more than 5 in Brazil between 2000 and 2007 and was only outperformed by Russian OFDI at this date. Due to the crisis, of which Brazilian and Russian OFDI suffered more than their Indian and Chinese counterparts (see 3 below), in 2011 Brazil was lagging behind India and China as to the outward/inward FDI stock ratio, and of course Russia. However, if a 25% ratio is hypothetically retained for qualifying the third stage of IDP model all the BRICs stick to the criteria in 2007 as well as in 2011, with only Russia having filled it before 1999. For the first time in history, in 2006 Brazilian FDI outflow abroad outweighed the amount of equivalent inflow FDI in Brazil.
Table 3 about here
3. Brazilian and Indian outward FDI muddling through the crisis
Global FDI flows sharply slowed down during the 2008 financial crisis, and again in its 2010-2012 aftermaths. The financial crisis had a negative effect on OFDI from emerging markets as well. However, emerging market MNC contribution to OFDI was more resilient to the crisis and less volatile than that of other MNCs, although it too went through cycles (Ramamurti, 2011). While overall world OFDI significantly and repeatedly slowed down in 2008, 2010 and 2011 (Table 4), the situation was scattered among the BRICs as regards OFDI fluctuations during the crisis.
Russian OFDI stock was by far the most unstable and the most affected by crisis (Andreff, 2014) suffering a 20% decrease in 2008, and again 16% down in 2011; but in between its recovery was the strongest in the world with the highest growth rate (74%) in 2010. On the other hand, though fluctuating, Chinese OFDI stock kept on growing at between 23% and 55% a rate per year from 2008 to 2012: the most stable and the least affected by crisis. Brazilian and Indian OFDI stocks stand somewhere in between. Indian OFDI stock was still one of the fastest growing in the world in 2008 (110%) but dropped off significantly in 2009 and since then its growth rate is on a decreasing slope down to 6% in 2012. Brazilian OFDI
7
stock is the most unstable after the Russian one, decreasing by 3% in 2009 and sticking to a 12% to 15% growth rate since then.
Table 4 about here
The rather high growth rate (25%) of Brazilian OFDI stock in 2008 is mainly due to intra-company loans from parent companies to underperforming subsidiaries abroad as well as new acquisitions of mining and natural-resource-based industries (UNCTAD, 2009). In 2009, most likely in response to worldwide economic and financial crisis, FDI outflows from Brazil were negative, with Brazilian parent companies repatriating $10 billion from their foreign subsidiaries through intra-company transfers. The combination of Brazilian real depreciation and loss of market value of overseas equity did not result in more ventures abroad for Brazilian companies. The latter were strongly hit by tightened international credit conditions and uncertainty fuelled by economic crisis. Trans-border mergers and acquisitions (M&As) by Brazilian MNCs plummeted sharply in 2009, although the effects of crisis in Brazil were still relatively limited. In 2010, Brazil‟s GDP growth was 7.5%. Equity investments made by Brazilian MNCs in foreign subsidiaries reached $11.5 billion in 2010. Since 2010, Brazilian OFDI stock located in Europe has considerably raised namely in Austria, through special purpose entities and takeovers of Austrian banks.
Indian OFDI rate of growth peaked up at 98% per year in 2004-2007 (Pradhan, 2010). This growth rate declined since 2008 though, on average, less than in other BRICs but China. Indian MNCs had borrowed heavily in dollars to finance mega trans-border M&As. They were thus hit badly by the sharp rupee depreciation and tightened international credit conditions. Since 2008 continuously tumbling trans-border M&As by Indian MNCs7 were driving the decline in OFDI growth, affecting only slightly OFDI in services while it turned out to be a real decrease in manufacturing industry. After years of overseas expansion, Indian firms started consolidating their foreign operations and adjusting to the crisis. Indian MNCs suffered from a credit crunch and difficulties in raising financial resources. The sudden depreciation of Indian rupee against US dollar led to heavy losses for those Indian MNCs which had acquired derivatives and to an increase of their overseas debt in domestic currency.
7 Between 2007 and 2009, the number of overseas M&As plummeted from 243 to 82; the total trans-border
M&A value fell from $32.8 billion to $1.4 billion; and the average M&A size decreased from $135 million in 2007 to $17 million in 2009.
8
Nevertheless, after Chinese MNCs, the Indian ones are the least affected by crisis among the BRICs‟ MNCs so far.
4. Specificities of outward FDI from Brazil and India
In terms of OFDI stock, India became the world‟s 34th largest outward investor in 2007 whereas Brazil had reached the 19th rank the same year as against Russia the 12th, and mainland China the 23rd. In 2012, OFDI stock from Brazil was the 18th most important source of OFDI worldwide and Indian OFDI the 23rd, as against Russian OFDI being the 15th and Chinese OFDI the 12th. From 2007 to 2012, during the crisis, all the BRICs have climbed this ranking based on UNCTAD OFDI data, except Russia. In the past recent years, post-communist transition economies are the most significant foreign investors among the BRICs as compared to the two major countries emerging from under-development.
4.1. Evolving major Brazilian and Indian multinational companies
In the 1990s and up to 1999 Reliance Industries was the only Indian MNC that showed up among the biggest 50 MNCs from developing countries; then it disappeared from the UNCTAD ranking. Brazilian MNCs were four (Petrobras, Vale, Brahma, Souza Cruz) in this top 50 group. In 2006, among the biggest 100 MNCs from developing countries were found three Brazilan (Petrobras, Vale, Gerdau) and two Indian (Oil and Natural Gas Corporation, Ranbaxy Laboratories) firms.
4.1.1. Brazilian MNCs: global players and small and medium-sized enterprises
There were altogether more than 1000 Brazilian firms that had invested abroad in the late 1990s (Gammeltoft, 2008); this number compares with the one for Russian MNCs (Andreff, 2014). In 2006, a KPMG study checked that 885 Brazilian MNCs had invested in 52 countries where they were employing 77000 people. Most of them were privately-owned companies though some significant MNCs were partly state-owned like Petrobras. In 2007, using the UNCTAD transnationality index, the most transnationalised Brazilian companies were Gerdau, Sabo (auto parts), Marfrig, Vale and Metalfrio. Foreign subsidiaries of 40 Brazilian MNCs were located 46% in Latin America, 17.1% in North America, 20.6% in Europe, 4.6% in Africa, 10.7% in Asia, and 0.4% in Oceania (Cyrino et al., 2010). However, some Brazilian
9
small and medium sized companies had become MNCs. The group of Brazilian firms with significant amounts of OFDI is around 100 of which about 50 „global players‟ (Carvalho et al., 2010). In 2013, seven Brazilian MNCs were listed in the Fortune 500 biggest companies in the world: Petrobras, Banco de Brasil, Bradesco, Vale, JBS, Itau, Ultrapar Holdings, and Brazilian Distribution.
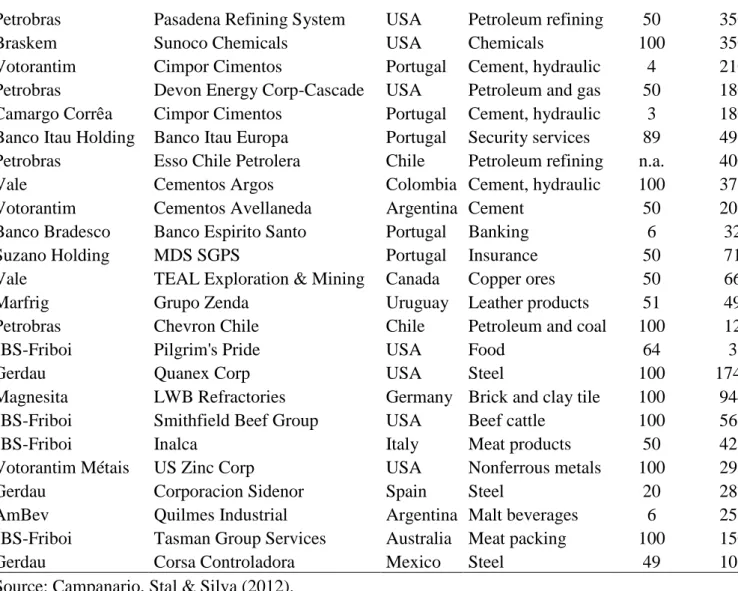
Table 5 about here
In the past recent years, the above-mentioned pioneering Brazilian MNCs have been joined by a larger group of Brazilian companies investing abroad, namely those listed in Table 5, as well as Petroflex (chemicals), CVRD (mining and metals), Usiminas (steel), Tupy (steel) Aco Altona (metal products), Cotia Trading (metallurgy and construction), Camargo Corrêa (construction), Tigre (construction), Metodo Engenharia (construction), Souza Cruz (diversified), Ultrapar (diversified), Artecola (chemicals), Potobello (ceramics), Aracruz Celulose (pulp and paper, now FIBRIA), Suzano (paper and pulp), Itautec (information technology), Sabo (car parts), Duas Rodas (motorbikes), Duratex (furniture), Ambev (beverages), Sadia (food & beverages), Perdigão (food), and Unibanco (banking).
4.1.2: Indian MNCs: conglomerates and others
Indian firms investing abroad before the 1990s were mostly conglomerates (Lall, 1982) competing into those sectors that required simple technology, low product differentiation and more labour intensive techniques but they have worked in developing countries more efficiently than developed countries.The government liberalisation policies changed the size distribution of Indian MNCs from big industrial houses with minority stake in pre-1991 period mainly due to the prevailing restrictive regime to small firms. After a first liberalisation phase (see 6.2 below), continual industrialisation in the domestic market, experience attained from home and abroad, financial relaxation and local government supports paved the way for Indian MNCs to invest more globally (Hansen, 2003). They not only invested into developing countries and the share of their OFDI into developed countries increased after 1990 (Arockia Baskaran & Chaarlas, 2012). Faced with a downturn of the Indian economy between 1998 and 2002, Indian firms internationalised operations for their survival but also with specific strategies for sustained growth (Kant, 2008).
10
Indian OFDI is undertaken primarily by publicly-listed, private firms and, as yet, only a handful of Indian public-sector firms have internationalised. Unlike Chinese MNCs, they do not enjoy „go global‟ privileges (Andreff, 2014). The conglomerate structure of some well-known Indian MNCs is sometimes considered as a key factor of their success (Ruet, 2010). It helped them in catching up in production process-efficiency and technology while raising their borrowing capacity in the international market. Those non conglomerate Indian firms that became MNCs often used foreign networks, namely parental networks (Elango & Pattnaik, 2007) for those MNCs launched by big families like the Kalyani‟s (Bharat Forge), the Mahindra brothers, Dilip Shanghvi (Sun Pharmaceuticals), Nicholas Piramal and so on. In 2007, the number of Indian MNCs stood at 3149, operating across 122 countries, but many had a relatively small size, namely compared with Chinese MNCs. In 2008, seven Indian firms were listed in the Fortune 500 biggest companies of the world: Indian Oil, Reliance Industries, Bharat Petroleum, Hindustan Petroleum, Tata Steel, Oil and Natural Gas Corporation and State Bank of India. In 2013, they were eight, the same plus Tata Motors, as against 89 Chinese companies and 7 Russian companies. Some of these biggest Indian firms did not yet show up among the biggest Indian MNCs in 2006 (Table 6).
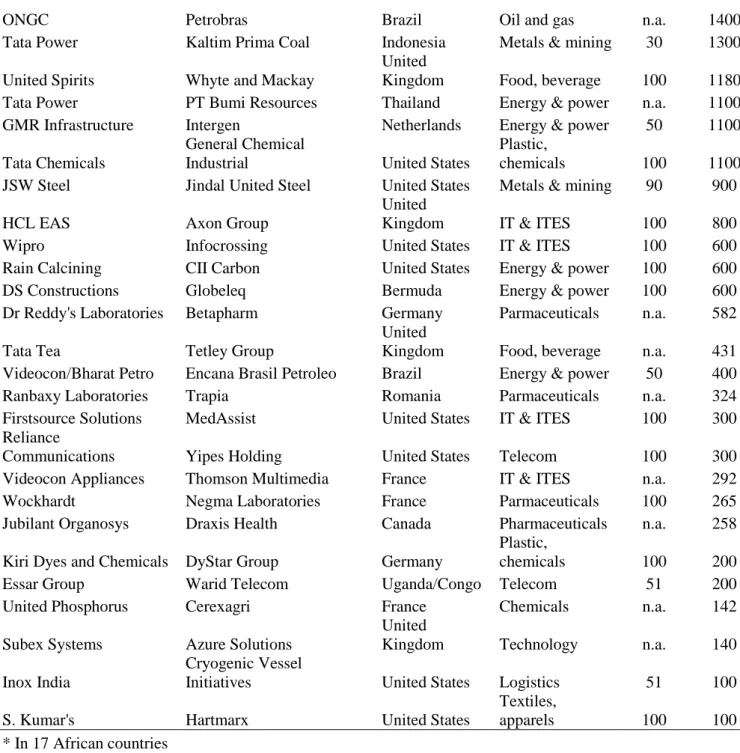
Table 6 about here
Beyond those listed in Table 6, a number of Indian MNCS are well known namely in the pharmaceutical industry (Ajanta Pharma, Aurobindo Pharma, Wockhardt, Matrix Laboratories, Piramal Healthcare), information technology (IT) services (Aptech, Mastek, Firstsource Solutions, 3i Infotech, Mphasis Ltd, Reliance Infocomm, Videocon Industries, Satyam Computer Services, iFlex Solutions, Polaris Software, Pentasoft Technologies), chemicals (Orchid Chemicals, Nirma, United Phosphorus), engineering (L&T, Voltas and Usha Beltron, Asian Paints), as well as Essel Packaging, Subex Azure, Hotel Leela, Bajaj Hindustan group, Havells India, JSW Steel, Punj Lloyd, Bharti Airtel, Essar Steel Holdings, United Spirits, GMR Infrastructure, Opto Circuits India, NTPC, GAIL (Gas Authority of India Ltd), Era group, and Ispat Industries.
11
Brazilian MNCs invest abroad by means of both greenfield investment and trans-border M&As. For instance, Camargo Corrêa acquired Loma Negra (Argentine) in 2005, Marco Polo created a JV with Tata Motors (India) in 2006 setting up the biggest bus plant in the world, Vale acquired INCO (Canada) in 2006 and AMCI Holdings (Australia) in 2007, a year when Votorantim acquired Acerias Paz del Rio (Colombia), Gerdau acquired Chaparral Steel (US), JBS-Friboi acquired Swift Foods (US); with the latter acquisition, JBS had become a world‟s slaughterhouse group with the largest capacity of processing worldwide. Marfrig acquired Mirab (Argentina) and Ambev merged with Interbrew in 2008.
Table 7 about here
Overseas acquisitions have gained strength, especially due to the stabilisation of the Brazilian economy and the appreciation of real face to dollar. An appreciated currency made M&As much cheaper, namely in the USA. Brazilian MNCs have taken this opportunity to expand their market and access natural resources that are not available in domestic market: it was the purpose of Vale-Inco Steel, Votorantim-US Zinc, and Gerdau-Chaparral Steel acquisitions, among others. The search for technological assets that are not available to firms in their domestic market is an important driver of OFDI in general, and has become a central motivation for firms from emerging markets to internationalise (Matthews, 2002; Dunning et al., 2008; Dunning & Lundan, 2008). However, in Brazil, technology-seeking OFDI, this specific form of asset-seeking strategy, responds of only 7.2 percent of sampled MNCs (Carvalho, 2009); the recent increase in trans-border M&As might be a signal that Brazilian MNCs are seeking now to augment their strategic position through such investment.
Table 8 about here
Though relatively small in a global context, Indian MNCs are notable for their global buy-outs of enterprises far larger than themselves. Indian MNCs started seriously adopting overseas M&As in the 2000s. Indian MNCs have systematically acquired leading developed country firms, rapidly to boost domain expertise, technological competitiveness, market size, and brand recognition. In some cases, these acquisitions were specifically undertaken to attain global size and status, and to build new competitive advantages by combining the best international technology with low-cost Indian labour (Andreff & Balcet, 2013). Severe domestic competition triggered increasingly larger strategic asset-seeking trans-border M&As
12
in sectors such as the automotive industry (Tata Motors, Mahindra & Mahindra), auto-components (Bharat Forge), electronics (Videocon), electrical machinery (Crompton Greaves) and the metals sector (Tata Steel, Hindalco, Essar Steel, Jindal Steel). In order to improve their world image, Indian MNCs were attempting to acquire firms with established and prestigious brands, for example, Tata Motors‟ purchase of Jaguar and Ford assets.While the largest trans-border M&As were smaller than $500 million in the early 2000s, they were higher than $10 billion after the mid-2000s with the record Arcelor takeover by Mittal ($47 billion). Many Indian firms also used M&As to bring home new products and services and build competitive strength in India, which also explains the dominance of natural resource-seeking investments in India‟s recent trans-border M&As.
4.1.4. Predominant strategies of Brazilian and Indian MNCs
Since the very beginning, Brazilian MNCs had adopted either an export-substitution or an export-complementing OFDI strategy that is a market seeking strategy in any case. The latter was fuelled in the long run by trade liberalisation at home and abroad. From Table 7, one can infer that trans-border M&As by Brazilian MNCs target acquiring foreign companies geared towards consumer markets (food, services, banking), which confirms market-oriented OFDI. Then come M&As with foreign competitors for natural resources (petroleum, gas, various ores), and just one trans-border M&A is asset-seeking in information retrieval. Completed with the presence of Petrobras and Vale among the biggest MNCs, this highlights a resource seeking OFDI strategy. Thus, predominantly Brazilian MNCs‟ strategy is market-seeking, to some extent resource-seeking and to a much lesser degree, and only recently, technological asset-seeking, less than 10% of declared OFDI motives. Despite the rise of some big investors, mostly in the extractive sector, Brazilian MNCs have not yet developed a global strategy8, much less than Chinese and Indian MNCs, even though Brazil is still the main source of investment from the group of Latin American countries. There is no sign of an efficiency-seeking strategy with relocating production units in low unit labour cost countries. Early Indian OFDI was market-seeking and concentrated in developing countries where there was little technological competition. Indian MNCs invested abroad largely to circumvent a stagnant domestic market and policy restrictions on large firms‟ growth stemming from the
13
Monopolies and Trade Restrictive Practices Act, the Foreign Exchange Regulation Act, and licensing regulation and reservation policies for public-owned and small scale sector (Pradhan, 2008a). In the 1990s, Indian OFDI became more high-tech and trade supporting, as Indian IT firms – such as Infosys, Wipro or Satyam – began to win large global contracts and located in developed countries to be close to key clients. Indian pharmaceutical firms – such as Ranbaxy, Dr Reddy‟s Laboratories, Sun Pharmaceuticals, Biocon – followed the same route to break into Western generic markets. India‟s pharmaceutical companies looked for new unregulated markets for their generic drugs while seeking to acquire facilities that have regulatory clearance in regulated markets such as the USA and Western Europe.
Some Indian firms‟ have persistently pursued natural resources. This resource seeking strategy is primarily conducted by the state-owned Oil and Natural Gas Corporation (ONGC), but also India‟s Suzlon Energy Ltd, the world‟s fifth largest wind turbine manufacturer, and Hindalco‟s acquisition of copper mines in Australia while the market seeking strategy is widespread among privately-owned Indian MNCs. Resource-seeking OFDI aims at ensuring that a stable and secure supply of resources is available to fuel the country‟s energy-intensive growth. There has recently been a surge in resource seeking OFDI by Indian MNCs, especially to acquire energy resources in Australia, Indonesia and Africa. Indian OFDI to the US and Western Europe has taken off since 2000. The major driver of this take off is to get an access to better R&D and skill infrastructure, and available strategic assets. This (technological) asset-seeking strategy reflects an aspiration by Indian MNCs to buy technology, processes, and management know-how. This is particularly important for Indian pharmaceutical MNCs that are looking to expand their R&D base.
Finally, as trade barriers decline, some Indian MNCs are undertaking industrial restructuring with creating regional production networks, which looks like an efficiency-seeking strategy though it is not heavily based on a search for lower unit labour cost9. Indian IT companies like Tata Consultancy Services and Infosys have established major global sourcing bases in China. Similarly, Tata Motors‟ acquisition of Daewoo Heavy Vehicles of South Korea in 2005 has led to a regional production networking strategy whereby small and medium-sized vehicles are manufactured in Indian plants and sold through Daewoo outlets and brands while, simultaneously, heavy trucks built at the Daewoo plant are sold by Tata outlets in India and other countries under Tata brand name.
9 Since a low unit labour cost is a typical home country‟s advantage for Indian MNCs that may trigger OFDI
14
A survey of Indian MNCs revealed that market access was the most significant motive of their OFDI for 51% of the respondents, followed by efficiency-seeking (22%), resource-seeking (13%) and created-asset-seeking (14%) (Nayyar, 2008). More generally, many Indian MNCs are attempting to globalise their businesses and sources of revenues as a means of reducing dependence on the Indian market and domestic business cycle. It may be a first step toward a global strategy as the one sketched in Andreff (2003b).
4.2. Geographical specificities of Brazilian and Indian outward FDI
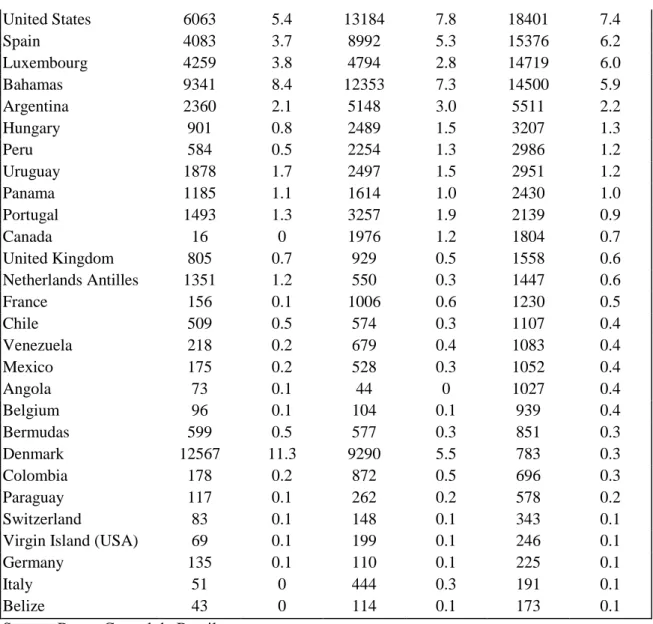
The distribution of Brazil‟s OFDI and its former concentration in the Americas has somewhat changed over time. Data from the Central Bank of Brazil suggest that, between 2001 and 2010, there has been a systematic decrease in the participation of Brazilian OFDI in Latin America and the Caribbean, coupled with an expansion in Europe and the USA (Table 9). However in 2001-2010, on average, the top host countries of Brazilian OFDI were Caribbean tax havens such as Cayman Islands, British Virgin Islands, Bahamas, Panama, Netherlands Antilles, Bermudas and Belize, and also Luxembourg. In 2008, Cayman Islands stood at 43% of Brazil‟s total OFDI stock (and still 16% in 2012) while 91% of the annual cross-border intra-company transfers of Brazilian MNCs were with tax havens. In 2010, these share declined to 79%. FDI outflows to tax havens often flow back to Brazil, mainly in the form of intra-company transfers. However this sort of “round tripping” seems to be less widespread than in the case of Russian and Chinese OFDI (Andreff, 2014). In 2012, the share of tax havens among host countries was 39.4% of total Brazilian OFDI. Fiscal regulation in Brazil seemingly induces investment in tax havens to escape regulatory and tax obligations. This suggests that Brazilian MNCs undertake trans-shipping FDI in tax-haven countries while waiting for good opportunities to make productive investment in third countries. This behaviour is different from that of Chinese MNCs that tend to be involved in round tripping FDI due to favorable conditions offered by Chinese government to foreign investors.
Table 9 about here
A share of Brazilian OFDI concentrates in America (14.4% of total in 2012), in particular neighbouring Latin American countries (6.3%), except tax havens; but a high level of regional concentration, particularly in North America, Latin America and the Caribbean, which
15
together accounted for 79% of all FDI stock from Brazil between 2001 and 2008, now belongs to the past. As MNCs from other BRICs, in the past decade Brazilian MNCs have re-oriented their investment abroad toward Europe (44.7% of total in 2012) which is now the major host area for Brazilian OFDI. Among the first 32 host countries for Brazilian OFDI listed in Table 9 – with a 0.1% share or more – just one developing country shows up that is Angola, a Portuguese-speaking country. Mozambique is further down the list. Overall this means that Brazilian MNCs are not attracted in less developed countries neither by their markets nor their unit labour cost so far; they invest in such countries basically for securing some natural resources.
OFDI of India‟s early MNCs went mostly into developing countries, accounting for 68.6% of overall Indian OFDI flows in 1961-1969. During the 1960s, Indian MNCs were interested in tapping business opportunities open by industrialisation programmes in some African countries that had recently achieved their independence. Indian MNCs also were attracted to Africa because of the historical business link established since British colonial era and the presence of significant size of Indian origin population. Thus, Africa emerged as the largest host developing region for Indian OFDI. The other region that attracted Indian OFDI is Asia-Oceania; the geographical proximity, cultural linkages and similarity of institutions inherited from colonial rule appear to be important factors of location in neighbouring Asian countries. Developing countries in Latin America and the Caribbean and South-East Europe and CIS, largely due to geographical distance, language barriers, and weak trade links, failed to attract any Indian OFDI during this period.
The share of developing countries further increased in the 1970s to attain its highest share ever: 96%. During the 1970s-1980s, Indian OFDI into Africa declined mainly because of growing policy restrictions on inward FDI, political violence and internal strife.The attraction of developing regions to Indian OFDI continued to be very high in the 1980s though reoriented toward Asia as the major host region in 1970-1999. With the liberalisation of Indian OFDI policy regime in the 1990s, Indian MNCs intensified their investment in developing countries across different sub-regional groups. Almost all developing sub-regions experienced rapid growth in Indian OFDI led by a growing number of Indian parent companies. Developed countries started enhancing their position since the 1990s and had overtaken developing countries in 2000-2007 as the most attractive host region; however developing countries continued to be important locations for OFDI by Indian MNCs.
16
The geographical pattern of Indian OFDI in developing countries has shown trends of spatial diversification during 2000-2007, the host Asia-Oceania region received about 39% of Indian OFDI, followed by Africa with 34%, South-East Europe and CIS with 15% and Latin America and Caribbean with 13%. The expansion of outward investing Indian MNCs into South-East Europe and CIS sub-region started in 1979. Until now, Indian state-owned oil MNCs are still building an increased presence in natural-resource-based industries in African countries. Over 1961-2007, a total of 1674 Indian parent companies invested more than $10.9 billion in as many as 92 developing countries.
While in a first pre-1991 wave, Indian OFDI was concentrated in developing countries two next waves in the 1990s and the 2000s shifted toward M&As in developed countries (Kumar, 2007); Indian OFDI in the latter has reached about 60% of total OFDI. The last wave was led by Indian pharmaceutical MNCs that started up locating direct investment in Latin American countries, in particular Brazil, since 1999 (Sweet, 2010). Over a half of India‟s total 2002-2009 OFDI went into developed countries, most of them in the form of M&As. In fact, since 2000, Indian MNCs have used trans-border M&As as the main mode of entry into developed countries, and greenfield investment into developing ones. Indian MNCs continue to invest in developed-country based companies, particularly now that they are more affordable due to the global crisis. The rise of host developed countries is also due to the adoption of overseas acquisitions by a large number of Indian MNCs to access foreign technologies and knowledge mostly concentrated in innovation driven developed region (Pradhan, 2008a). The improved attractiveness of developed countries to Indian OFDI is also rooted in the rise of service firms like software, communication, etc., as global players mostly focused on service-dominated developed countries.
Table 10 about here
Since the 2000s (Table 10), the geographical distribution of Indian OFDI is between neighbouring countries (Singapore, Mauritius, Russia, China), major developed countries (Netherlands, USA, UK, Denmark) and tax havens (Channel Islands, i.e. Jersey, Guernsey, Cyprus, Switzerland, British Virgin Islands). Such a distribution is quite similar to the one observed with Brazil, China and Russia OFDI. The share of round tripping in Indian OFDI must be lower than in the last two cases though the great bulk of OFDI channeled from India to small countries such as Singapore, Mauritius, Cyprus and British Virgin Islands is
17
ultimately geared toward third countries. Singapore is now the largest host to Indian OFDI. This is due to a sudden jump in OFDI after the two countries signed a Comprehensive Economic Cooperation Agreement in 200510.
4.3. Industrial specificities of Brazilian and Indian outward FDI
Brazilian MNCs primarily expand abroad in the tertiary sector – over 88% of all OFDI until 2007 (Table 10), which compares with Chinese OFDI 72% concentration in the services industry in 2007, and 74% in 2010 (Andreff, 2014). Crisis has affected the industrial distribution of Brazilian OFDI since the share of the tertiary sector fell down to 59% while its share in the primary sector grew from 2-3% up to 31%; the above-listed trans-border M&As in 2008-2010 were many in the primary sector for securing natural resource supply in times of crisis. The manufacturing industry still remains a minor sector for Brazilian OFDI which explains that an efficiency-seeking relocation of production in view of lowering unit labour costs has not really emerged so far. A significant share of OFDI in resource-based sectors and quite few manufacturing firms also reveal the comparative advantages of a resource rich country, a characteristic that Brazilian OFDI shares to some extent with Russian OFDI (Andreff, 2014) up to the present times.
Table 11 about here
Tolentino (2000) contended that Brazilian MNCs had the disadvantage of not having global brands (in most cases not even strong national brands) and, most important, had neither attained worldwide technological leadership nor developed significant technological advantage to compete abroad. Nevertheless, some Brazilian MNCs have significantly invested in R&D expenditures abroad, but not yet in very high-tec industries like MNCs from developed countries, and even in less high-tech industries when compared to Indian or Chinese MNCs (Galina & Moura, 2013). Relying on seven case studies11, the authors found that Brazilian MNCs basically internationalise Product Development (not the whole R&D
10
In the 1990s, Russia dominated Indian OFDI, largely due to a rupee-rouble agreement which enabled Indian MNCs to conduct Russian trade and investment in rupees.
18
process) while Research properly speakingremains in the headquarters in Brazil. Adaptation of products to local markets is often observed as a factor that led to internationalise R&D. With regards to technology-driven factors when internationalising R&D a decisive factor is partnership with local suppliers for product or technology development. A second factor is technological asset-seeking that translates into the acquisition of offshore units that already included technology development capabilities. Maehler et al. (2011) have shown with a case study of four Brazilian subsidiaries located in Portugal, in different industries, that there are frequent innovations taking place in Portuguese subsidiaries which are typically incremental in nature and occur in strong interaction with local markets, especially with customers contributing with suggestions and influence on the new products creation in the subsidiaries. At odds with Russian and Chinese MNCs strategy of tapping technological assets abroad, Fleury et al. (2013) contend that Brazilian MNCs derive innovative capabilities from core competences and competence formation at firm level which are influenced by the national environment. Thus Brazilian MNCs which do not exhibit the expected strength in R&D are able to combine their organisational competences and manage to develop innovative capabilities as a springboard for their internationalisation.
Overall, the change in industrial composition of Indian OFDI reflects a change in their strategies from essentially market-seeking to more asset-seeking (Kumar, 2007). Until 1990, Indian OFDI concentrated in manufacturing industry, in particular in pharmaceuticals and chemicals. However there was a first relative shift in OFDI by Indian MNCs from manufacturing in the 1960s-1970s to services in the 1980s. Inefficiencies and low productivity in the Indian manufacturing industry due to inward looking policies led to a slowdown in OFDI from this industry while the relatively faster growing service sector in the national economy increased its share in Indian OFDI. In the pre-1991 period market-seeking OFDI developed on the basis of Indian firms‟ intermediate technology in relatively low technology industries such as light engineering (Lall, 1986). The main technological advantage that Indian MNCs achieved through absorbing, assimilating, adapting and reverse engineering of foreign technologies offered limited scope for exploitation in developed countries. The modified foreign technologies to suit local demand and factor conditions rather provided Indian MNCs certain competitive advantages in other developing countries having similar economic conditions to India‟s.
Since 1991, about 60% of Indian OFDI concentrated in the tertiary sector in IT, communication, software and media, trade, banking and finance. Within the manufacturing
19
sector, industries such as power generation, electronic equipment, chemicals, pharmaceuticals, telecommunications and software development were among the dominant investors abroad. Knowledge based industries - software and IT, depository institutions, professional, technical and scientific services – have heavily invested abroad since 2000. This maturing technological strength of large-sized Indian MNCs is now allowing them to exploit their competitive advantages even in developed countries in the 2000s.
Table 12 about here
Consequently, in the 2000s, manufacturing has displaced services as the principal OFDI industry, and the primary sector‟s share is now growing quickly (Table 12). While pharmaceuticals, consumer electronics and automotives accounted for the bulk of manufacturing OFDI in the first half of the decade, the second half has seen a concentration in metals, energy and natural resource investments, and increasing activity by consumer goods and food and beverage firms. In the aftermath of global economic crisis, Indian OFDI flows12 shifted again toward services since 2010. While IT initially dominated services OFDI, investment in other services industries, such as financial and insurance services, entertainment and broadcasting, construction, and telecommunications, is now mounting.
5. The determinants of Brazilian and Indian OFDI
The determinants of OFDI may be looked for in home country – the so-called push factors – then primarily explaining its industrial distribution abroad, or they may be searched in factors that pull OFDI from a given home country to various host countries, then explaining its geographical distribution (Andreff, 2014). The research of pull factors is predominant in the studies about BRICs‟ OFDI, but in the case of Brazilian OFDI push factors are acknowledged to have had a significant role.
5.1. The determinants of Brazilian OFDI
12
Since Indian data about OFDI are basically published in terms of flows, they are more fluctuating than in other BRICs which publish OFDI stock; consequently, the industrial distribution of OFDI flows (India) appears to be more fluctuating than the industrial distribution of OFDI stock in other BRICs (including Brazil).
20
In line with the theoretical justification provided by the IDP model (Dunning, 1981; Dunning & Naruda, 1998), testing push factors that trigger a trade-off between investing in the domestic economy and abroad should be done properly (Andreff, 2003a). Carvalho (2009) has adopted the most simplified version of IDP model in case of Brazilian OFDI. A quadratic function is supposed to reveal the expected pattern of the relationship between net outward foreign investment (outward direct minus inward direct investment) and the development path of the Brazilian economy (GNI: gross national income):
NOI pc = + 1 GNIpcap + 2 GNIpcap2 +μ (1) and has been tested successfully.
However Ellström & Engblad (2009) have found that though the shape of Brazilian IDP correlates with the conceptual IDP model, the underlying factors causing the shifts in net outward investment are not due to development of the country´s OLI-advantages; it was initially caused by economic reforms and later by global business cycles as in many late outward investor countries such as Brazil. Ellström & Engblad conclude that the IDP theory explains the development of Brazil‟s FDI only to a limited extent. Four important push factors led Brazilian firms to become new MNCs, as it is contended by Fleury & Fleury (2009): the privatization process; the consolidation of the domestic consumer goods industry; the denationalisation of the durable goods industry; and the creation of Mercosur.
Concer et al. (2010)13 have assessed the common wisdom prevailing in Brazil that accounts for a push factor through which local companies go abroad in response to exchange rate movements. Their results stress that although the strong exchange rate in Brazil is often blamed for forcing companies to invest abroad, the evidence found in the aggregate data suggests that there is not a significant relationship between the level of foreign exchange rate and Brazilian OFDI.All in all, more push factors of OFDI from Brazil have been successfully tested or assessed than for Russian and Chinese OFDI (Andreff, 2014). This does not mean that domestic variables do not explain OFDI in the two latter cases – namely think of massive round tripping OFDI – but opens a wide avenue for further research in comparing push factors that trigger (or not) OFDI from all the BRICs.
Amal et al. (2012) have tested the determinants of Brazilian OFDI with explanatory variables that are pull factors attracting Brazilian investment in foreign host countries. Relying on host country data, the authors estimated a model for Brazilian OFDI on a dataset comprising eight
21
years (2002-09) and 22 host countries14. The model tested is as follows (an asterisk means that the coefficient of a variable is statistically significant):
OFDI = f (GDPi*, GDPi/POPi, INFi*, RERi*, TRDi*, CDi*, GDi*, CCi*, GEi*, PSi, RLi*, RQi, VAi*) (2)
with: GDPi the gross domestic country of a host country i; GDPi/POPi: GDP per inhabitant in country i; INFi: inflation rate in country i; RERi: real exchange rate between country i‟s currency and the real; TRDi: trade flows (import, export) between Brazil and country i; CDi: cultural distance between Brazil and country i; GDi: geographical distance between Brazil and country i; CCi: control of corruption in country i; GEi: government effectiveness in country i; PSi: political stability and absence of violence / terrorism in country i; RLi: rule of law (law enforcement) in country i; RQi : quality of regulation in country i; VAi *: voice and accountability in country i.
Brazilian OFDI appears to be positively correlated to host country‟s economic performance, namely the size of its domestic market assessed by GDP, macroeconomic stability (inflation, real exchange rate), and trade openness. Since Brazilian OFDI is positively correlated to the size of the host country, the higher is a host country‟s GDP, the higher Brazilian OFDI to that country. GDP is statistically significant at a 1% threshold, meaning that Brazilian MNCs invest more in large economies. These results give some support to the market-seeking hypothesis, suggesting that Brazilian MNCs are more likely oriented to invest in host markets with a growing demand and a higher level of economic openness, measured by a proxy of trade flows between the host and home countries. A negative correlation between OFDI and the real exchange rate means that the more the real is over evaluated, the higher OFDI. Since GDP per inhabitant is not significant, Brazilian OFDI is not basically attracted to the most developed countries and spreads to less developed countries as well.
The above model includes a cultural distance often suggested to be an explanatory variable of Brazilian firms‟ investment abroad. Cyrino et al. (2010) go further in considering the psychic distance as a major determinant of Brazilian companies‟ OFDI referring to Vahlne and Wiedersheim-Paul (1973). Psychic distance is a broader concept than cultural distance and includes different administrative, economic and legal systems, as well as language and religious differences. The path of Brazilian companies‟ OFDI is coherent with the gradualist
14
Argentina, Austria, Belgium, Canada, Chile, China, Colombia, Denmark, France, Germany, Holland, Italy, Luxembourg, Mexico, Panama, Peru, Portugal, Spain, Switzerland, United Kingdom, United States, and Uruguay.
22
perspective of the behavioural approach to internationalisation which states that companies choose to enter countries in terms of psychic distance in order to accumulate experience in those markets before entering successively more distant countries, in line with the Uppsala school (Johanson & Vahlne, 1992). Amal et al. check a high correlation between cultural and geographical distance on the one hand and, on the other hand, institutional indicators. This suggests that Brazilian MNCs are more involved in host countries exhibiting an improved institutional environment in terms of business climate, political stability, law enforcement, and government effectiveness. This is confirmed by the significance of institutional variables (except RQi) which means that a positive institutional environment in host country affects positively the investment strategy of Brazilian MNCs.
5.2. The determinants of Indian OFDI
The research on the determinants of India‟s OFDI has triggered a greater number of publications than for Brazil, China and Russia so far. Some of the most representative studies are sampled here since an exhaustive survey would have gone beyond the scope of this paper. The determinants that are looked for are pull factors in host countries.
Anwar, Hasse & Rabbi (2008) have tested the following relationship between OFDI and six explanatory variables:
LogYi = β0 + β1 X1 + β2 X2 +β X +β3 X3 +β4 X4 +β5 X5 + β6 X6 + μ (3)
where logYi stands for the log of OFDI volume in year i; X1 for host country‟s real GDP in $ billion; X2 for real GDP per capita; X3 for host country‟s real GDP rate of growth; X4 for the real exchange rate of the host country‟s currency into US dollar; X5 for the geographical distance between New Dehli and the host country‟s capital; X6 for real GDP deflator in host country (% change); and μ is the error term which accounts for all the omitted variables that may affect OFDI.
The results obtained from econometric testing are: the relationship between OFDI by Indian MNCs and host country‟s real GDP is positive and significant at 5% threshold; the real exchange rate of the host country‟s currency is positively but not significantly related to Indian OFDI: it cannot be concluded that Indian MNCs invest in those countries with stronger currencies. The coefficient of the distance to the host country capital is negative and significant: the further a country from New Dehli the lower Indian OFDI, which explains the latter‟s location primarily in neighbouring countries. Since the real GDP deflator in host
23
country is positively related to Indian OFDI, Indian MNCs are attracted in inflationary countries.
In the same vein, Anwar & Mughal (2012) tested whether economic freedom in a host country has a positive impact on attracting Indian OFDI. The relationship between OFDI and economic freedom is found highly significant (at a 1% threshold) for all regions except Europe and the group of OECD countries for which it is significant at 5 %. The relationship for North America, even though with a similar sign, is found statistically non significant. The latter result may be due to the small number of observations for the region. In addition, Indian OFDI to all regions is strongly influenced by a prior experience of Indian investment in the region, indicating that Indian OFDI appears to be driven by prior knowledge of these markets (market-seeking confirmed). The relationship with linguistic affinity is positive. Other results show that government size, tax incentives, ease of trade, credit regulation, access to sound money and business regulations are among the most important determinants of Indian OFDI whereas the security of property rights and inflation are less important drivers.
Using a basic gravity model augmented with a selection of explanatory variables Hattari & Rajan (2008) studied the drivers of bilateral FDI flows among Asian developing countries while Rajan (2009), with a same methodology and a same selection of explanatory variables, introduced a country dummy to test the drivers of Indian OFDI. The basic specification is: Ln (FDIijt) = 0 + 1 ln (GDPit) + 2 ln (GDPjt) + 3 ln (DISTij) +4 Xijt + i + t + ijt (4) where FDIijt stands for the real FDI flow from home country i to host country j in time t; GDPit and GDPjt respectively stand for home and host country‟s real GDP in US dollar in time t; DISTij for the geographical distance between home and host countries; Xijt is a vector of other explanatory variables influencing FDI outflows; i stands for the unobservable type of home country effects; t for unobservable time effects (year dummies); and ijt for a nuisance term. The basic set of explanatory variables encapsulated in Xijt are: bilateral real exchange rate of a home country‟s with host country‟s currency; R&D expenditure as a percentage of host country‟s GDP, energy production in host country, a ratio of market capitalisation to host country‟s GDP, and a ratio of total trade to GDP in host country. Explanatory variables are interacted with an India dummy as the home country to examine whether the motives for India‟s FDI outflows differ from those in the rest of the sampled countries. The sample is based on a panel of annual data on 57 home and 57 host countries between 2000 and 2005.
24
The outcome of econometric testing is that the distance variable is statistically significant. A greater distance between home and host countries lowers OFDI flows. Physical distance may be a proxy for transaction costs, time zone differences and/or information gaps. Larger host countries experience more FDI inflows from India. The result regarding bilateral real exchange rates against the rupee is inconclusive. OFDI flows to host countries with higher R&D spending as a share of GDP and with abundant natural resource endowment and where stock market capitalisation is important. With regards to Indian OFDI (using the India dummy) three findings are noticeable. First, the real exchange rate appears statistically significant – a rise in the host country‟s real exchange rate vis-à-vis the rupee reduces OFDI from India. Second, there is some evidence that Indian OFDI is relatively more market-seeking and somewhat less R&D-market-seeking than OFDI from other Asian countries in the sample. Third, Indian MNCs appear to be as much resource-seeking as their counterparts from other countries.
In a further work, Hattari & Rajan (2010) tested another specification of the gravity model: Ln (FDIijt) = 0 + ln (GDPit) + ln (GDPjt) + 3 LANGijt + 4 COLONYijt + 5 DISTij +
6 Xijt + j + t + ijt (5)
with the same notations as in (4), and where LANGij is a binary variable equal to one if the two economies share a common official language; COLONYij is a binary variable equal to one if the two economies have a past colonial relationship; and j stands for the unobservable type of home country effects.
The set of explanatory variables Xijt used is: the bilateral real exchange rate between the home and host countries‟ currencies; gross secondary school enrollment in host country; R&D expenditure as a percentage of GDP in host country; energy production in host country; the ratio of market capitalisation to GDP in host country; the ratio of total trade to GDP in host country; a binary variable equal to unity if the two economies have a free-trade agreement (FTA); the log of bilateral exports from home to host country; and the level of capital account openness in home country. The India dummy is interacted with explanatory variables to examine whether the motives for India‟s FDI outflows differ from those of the rest of the world on the same data panel as for (4).
Econometric results are basically the same as in (4) as regards the following variables: distance, a common official language, a past colonial relationship, bilateral real exchange rate, R&D spending, natural resource abundance, and stock market capitalisation. A better pool of
25
educated workers is positive and significant, a home country invest more in a host country if the latter has a higher degree of trade openness and has had more intensive bilateral trade relations. However, a bilateral FTA is not statistically significant. With the India dummy, the gravity model variables (size and distance) remain highly robust, suggesting that drivers of OFDI from Indian corporations are not that different from their Asian counterparts. Again, there is evidence that Indian OFDI is more market-seeking, somewhat less R&D-seeking, and much more resource-seeking than OFDI from other countries in the sample.
Nunnenkamp et al. (2012) found that market-related factors, rather than motives to access raw materials or superior technologies, have dominated the location choices of Indian MNCs. India‟s OFDI proves relatively resilient to weak institutions and economic instability in host countries. Variants of the following equation have been tested:
FDIit = + Xit + Xi + t + i + it (6)
where the vector Xit comprises variables that vary by host country and over time: GDP, GDP per capita, GDP growth, inflation, trade openness, the ratio between current FDI stock and GDP, the Heritage index, the existence of a bilateral investment (or tax) treaty, and in some specifications the natural resource endowment and patents relative to population. The vector Xi comprises time-invariant host country characteristics: distance, the size of Indian diaspora in country i, and whether there is a common language. A set of year dummies t is included in all specifications and a set of host country dummies i is included in the fixed effects models. Mauritius and offshore financial centers listed in Eurostat are not taken on board in the sample since these financial centers are assumed to attract FDI mainly for reasons of tax evasion. The impact of independent variables on location choices proves to be weak for the overall sample. Most strikingly, no evidence is found for either horizontal or vertical FDI choices. Horizontal FDI should be reflected in significantly positive coefficients of the size and growth of host country markets, while vertical FDI should be reflected in significantly negative coefficients of the average per-capita income in the host countries and significantly positive coefficients of their openness to trade. All coefficients for these variables are statistically non significant.
Results are ambiguous with respect to the hypothesis that India‟s OFDI should be resilient to political uncertainty, weak institutions and economic instability in host countries. On the one hand, the positive coefficient for inflation, suggesting that economically less stable host countries with higher inflation rates receive more FDI from India, supports this hypothesis. On the other hand, the positive coefficient on Heritage index is in conflict with the hypothesis.
26
Better governance and institutions as reflected in higher values of the Heritage index attract more FDI from India15. Since the index ranges from one to 100, one point improvement in economic freedom lead to an increase in FDI flows by 0.19%. A dummy variable equal to one for English speaking host countries is not significant. However, the presence of an Indian diaspora in host country is significantly positive16. The variables introduced to capture vertical and asset-seeking FDI suggest that both types of OFDI played a minor role during the period under consideration (1996-2009). No evidence is found that India‟s OFDI is strongly motivated by access to raw materials in resource-rich host countries or access to superior technology in advanced host countries, or in host countries with lower per-capita income. Market-related factors appear to have dominated location choices of Indian MNCs in the past. Finally, both Brazilian and Indian OFDI are more market-seeking than asset- and resource-seeking, has developed countries as their first pecking order, then neighbouring countries and tax havens, just like Russian and Chinese OFDI (Andreff, 2014). Push factors are significant for Brazilian MNCs and not tested so far for Indian MNCs. Linguistic (cultural) proximity, sound investment regulations, good governance and institutions play a role in both cases while Indian MNCs are not reluctant to enter inflationary countries, and are attracted by host country‟s economic freedom. Here some differences emerge as compared with Russian and primarily Chinese MNCs.
6. Brazilian and Indian government policy vis-à-vis home-based multinationals
Compared with the huge government interference in the strategy of Chinese MNCs or the Russian government watchword incentive policy addressed to Russian MNCs (Andreff, 2014), Brazilian and Indian MNCs are less supported by the government while they are not used as a tool for home country‟s economic and foreign policy or diplomacy.
6.1. Brazilian economic policies that affect outward foreign direct investment
15 An efficient governance system in host countries is tested as attracting higher Indian OFDI (Garcia-Herrero &
Deorukhkar, 2014). However, when controlling for Indian OFDI located in offshore financial centers, the host country‟s ability to control corruption is not a significant determinant of Indian OFDI.
16
That diaspora plays a crucial role in augmenting Indian OFDI through facilitating acquisition and exchange of technical know-how, market information and physical capital is also tested significant and positive by Anwar & Mughal (2013).