Accurate determination of plutonium by Controlled
Potential Coulometry: uncertainty evaluation by the
Monte Carlo Method approach
Names of the authors: Sébastien Picart, Marielle Crozet, Giacomo Canciani, Ygor Davrain, Louis Faure, Danièle Roudil.
Title: Accurate determination of plutonium by Controlled Potential Coulometry: uncertainty evaluation by the Monte Carlo Method approach
Affiliation(s) and address(es) of the author(s): CEA, DEN, DMRC, Univ Montpellier, Marcoule, France,
E-mail address of the corresponding author: sebastien.picart@cea.fr 1 2 3 4 5 6 7 8 9 10
Accurate determination of plutonium by Controlled
Potential Coulometry: uncertainty evaluation by the
Monte Carlo Method approach
Sébastien Picart, Marielle Crozet, Giacomo Canciani, Ygor Davrain, Louis Faure, Danièle Roudil.
CEA, DEN, DMRC, Univ Montpellier, Marcoule, France
Abstract
The accurate determination of plutonium (Pu) mass fraction in nuclear materials is essential to nuclear matter accountancy and international safeguard programs. Controlled-Potential Coulometry (CPC) is one of the best available analytical methods to perform such measurements. The implementation of CPC at the Nuclear Matter Metrological Laboratory of the French Atomic Energy Commission (CEA) is described as well as the evaluation of measurement uncertainty using two approaches: the Guide to the expression of uncertainty in measurement (GUM), and the Monte Carlo Method (MCM). The uncertainty values determined are compared to the international target values published by the International Atomic Energy Agency (IAEA).
Keywords
coulometry, plutonium, accuracy, uncertainty, Monte Carlo Method 11 12 13 14 15 16 17 18 19 20 21 22 23 24 25 26 27 28 29 30 31
Introduction
The accurate determination of Pu mass fraction, in both nuclear materials and the spent fuel reprocessing cycle, is rendered mandatory due to the high accountability required by the element’s fissile nature. Indeed, nuclear organizations must always demonstrate an effective assessment of criticality and proliferation risks. As such, companies and institutions working with Pu need Certified Reference Materials (CRMs) in order to validate their analytical methods, calibrate equipment, and, above all, perform reliable and accurate content determinations. The production of such CRMs requires highly accurate methods for characterizing and certifying Pu content.
The techniques most commonly used for the determination of Pu with high levels of accuracy are Isotope Dilution Thermo-Ionization Mass Spectrometry (ID-TIMS), redox titrimetry, and Controlled-Potential Coulometry (CPC). Of these three techniques, ID-TIMS uses a spike of enriched Pu to achieve measurements with uncertainties ranging between 0.17 and 0.28% using very low quantities of Pu (10-50 ng per sample) - in compliance with the International Target Values (ITVs-2010) published by the IAEA in 2010 [1]- whilst titrimetry bases itself on redox potentiometry and attains comparable levels of uncertainty (0.21-0.28%, as reported both in literature [2] and in the ITVs-2010) using a larger amount of Pu material (5-60 mg). CPC, however, displays a vastly better performance for Pu determination, with measurement uncertainties not exceeding 0.1% [3–5] for plutonium quantities in the order of 4-15 mg.
The particularly low uncertainties of CPC can be attributed to the primary nature of the analytical method [6]. Unlike ID-TIMS, CPC is not related to chemical standards but only to physical parameters such as time and current, which can be calibrated with higher accuracies [7]. Beyond the low uncertainties, it is also important to note that CPC can be performed on small quantities of analyte [8] (typically, during routine analyses only a few milligrams of matter are used) and that it is a relatively facile technique to implement. These advantages have made CPC a particularly interesting technique for metrology laboratories which provide Pu CRMs such as the CEA’s Commission for the Establishment of Analytical Methods (CETAMA).
32 33 34 35 36 37 38 39 40 41 42 43 44 45 46 47 48 49 50 51 52 53 54 55 56 57 58 59 60
Fundamentally, CPC is based on the measurement of a quantity of electricity, Q, involved in an electrochemical reaction (either oxidation or reduction) and is governed by Faraday’s law, which links the quantity of electricity to the quantity of an element in solution:
m=Q M/(nF)
Where m is the mass of the studied element in g, M is the molar mass of the element (M=239.075 g/mol for the Pu sample of interest), n is the number of electrons exchanged during the electrochemical reaction (n=1 in the case of the Pu(IV)/Pu(III)redox pair), and F is Faraday’s constant (96485.33212 C/mol) [9].
Experimentally, Q is measured by integrating the current flowing during the oxidation of Pu(III) into Pu(IV). In order to obtain a selective reaction, it is necessary to work with a controlled potential applied by a potentiostat in combination with a three electrode electrochemical set-up. The working electrode material and the electrolyte must be carefully chosen in order to minimize interferences. In the case of Pu, a gold electrode, a pure Pu nitrate solution, and a 0.9 mol/L nitric acid electrolyte are recommended [8]. As every step of the procedure, from sample preparation to signal integration, contributes to the overall uncertainty of the final measurement result, these steps must be carefully controlled and optimized when seeking a high degree of accuracy. As such, an appropriate understanding and calculation of the uncertainties involved in the technique is essential if CPC analysis is to be performed at high accuracies.
The present work aims to achieve a deeper understanding of the technique as well as providing a method for the treatment of the uncertainties involved in CPC analysis. The study recalls the key points of the method and discusses the uncertainty budget estimations through the GUM [10] and the Monte Carlo Method (MCM) approaches [11, 12]. The MCM method has the advantage of avoiding assumptions with regards to the distribution law of the measurement result. Through this approach, this work gives an evaluation of the performance (trueness and precision) of CPC analysis for Pu determination at the CETAMA’s metrological laboratory of Nuclear Matter (LAMMAN).
Experimental and Methods
61 62 63 64 65 66 67 68 69 70 71 72 73 74 75 76 77 78 79 80 81 82 83 84 85 86 87 88 89 90
Chemicals
All chemical reagents were of analytical grade, concentrated nitric acid (Merck, 65% Suprapur), concentrated sulfuric acid (Merck, 95-97% for analysis), sulfamic acid (Merck, Emsure, 99.0%), and hydrogen peroxide (Merck, 30%, Suprapur).
All diluted solution were prepared using deionized water (resistivity>18 M cm).
Pu solutions were prepared by diluting an “EQRAIN Pu N°14” standard solution of Pu nitrate provided by the CETAMA’s LAMMAN (vial # S007) and are traceable to the MP2 Pu metal certified reference material (CRM). The reference value of Pu mass fraction in the sample is (5.5326 ± 0.0066) g/kg (uncertainty determined with a coverage factor k=2) on the date of fabrication (March 20th 2017). The “EQRAIN Pu N°14”
solution density is (1144.64 ± 0.12) kg/m3 (k=2) at 20°C. To calculate the molar mass of
Pu at the date of analysis (May 2018), the MP2 isotopy and the Pu isotope’s decay were taken into account. From this, the molar mass was evaluated to be (239.07458±0.00001) g/mol (k=2).
Coulometric set-up
The electrolysis cell used for CPC consisted of a three-electrode system (EG&G Model 377A coulometry cell system) mounted with a gold-gauze working electrode (Au, 99.99% pure, manufactured by Heraeus. Germany) with a very large surface area (diameter 3.5 cm, height 2 cm, four layers of 100 mesh per cm2 grid, total surface
evaluated at (123 ± 5) cm2 by cyclic voltammetry performed on a iron standard solution),
a saturated calomel reference electrode (SCE, EG&G Model K007) and a platinum counter-electrode (CE) made of a mesh welded to a wire (Fig. 1).
91 92 93 94 95 96 97 98 99 100 101 102 103 104 105 106 107 108 109 110 111 112 113
Fig. 1 Coulometric set-up
Each assay was composed of 30 mL of HNO3 (0.9 mol/L) to which a few drops of
sulfamic acid (1.5 mol/L, approximately 100 µL) were added.
In order to avoid the transport of products between the working electrode and the CE, as well as to minimize the poisoning of analyzed solutions by the reference electrode filling solutions, the SCE and CE were placed in electrolytic compartments separate from the analyzed solution. Vycor® membranes were used to establish an electrolytic junction between these secondary compartments and the central compartment as well as to ensure ultra-low leakage rates. The medium of the two separate compartments was the same as the medium of the assay (HNO3, 0.9 mol/L).
During analysis, a homogeneous solution was maintained by constant mixing with a paddle-type stirrer (EG&G Model 377 synchronous stirring motor) made of glass with a morphology optimized to avoid the risk of splashing. Finally, an argon degassing system allowed to remove dissolved oxygen from the solution. A bubbler was installed upstream from the electrochemical cell in order to saturate the gas with water and prevent the medium from drying out.
The electrical component of the CPC set-up consisted of a PAR 263A potentiostat coupled to a high-precision current integrator previously described by Ruas et al [3]. Calibration of the analogical-digital converter was performed using a high accuracy resistance (Vishay, RCK04 model, 20 Ω ± 0.01%) and a high accuracy current generator from AOIP (SN8310 calibrator, from 1 nA to 110 mA with uncertainty of 0.002%) of which the accuracy is periodically verified.
Procedure
The experimental protocol used during experiments was adapted from the ISO 12183 standard [5] as well as from previous literature studies [3, 8, 13]. It can be expressed by six stages:
Sampling and dilution
114 115 116 117 118 119 120 121 122 123 124 125 126 127 128 129 130 131 132 133 134 135 136 137 138 139 140 141
In the case of concentrated Pu solution, it may be necessary to perform a dilution by weight on the sample before analysis in order to weigh a mass greater than 1 g for each aliquot and therefore limit the weighing relative error to less than 0.01% (standard uncertainty, k=1) [5, 13, 14]. Indeed, care must be taken whilst measuring the apparent mass of the solution aliquot to reach the desired uncertainty target of 0.01%.
Weighing was performed on a Metler Toledo XP205 analytical scale with maximum capacity of 200 g and a Maximum Permissible Error (MPE) of 1 mg in the range 0-50 g and 2 mg in the range 50-200 g.
In the present work, a sample with an initial Pu concentration close to 5 g/L was diluted by weight with HNO3 (0.9 mol/L) by a factor of approximately 5 prior to analysis (i.e.
approximately 13 mL of standard solution were diluted in 40 mL of 0.9 mol/L HNO3).
During the experiment, every measurement performed with the analytical scale was corrected for air buoyancy in order to avoid a systematic error. For this study, each solution aliquot had a mass of about 4 g (which is comparable to typical values reported by Holland and co-workers [14]) and, as such, the equivalent mass of Pu in the aliquot was about 6 mg (which corresponds to the range of 5-10 mg Pu usually recommended for Pu analysis [13]).
Fuming
Samples of the Pu diluted reference solution, prepared as described in the previous step, were weighed directly in the coulometric glass cells used for analysis by using an analytical scale. Sulfuric acid (1 ml, 3 mol/L) was added to the coulometric cells in order to stabilize the Pu in the form of Pu(IV) sulfate crystals and to allow elimination of potential chloride, fluoride, nitrogen, and volatile organic compound impurities in the solutions as well as to prevent the formation of insoluble plutonium dioxide [13]. A few drops of hydrogen peroxide solution (30% v/v) were further added to each cell (approximately 100 µL) to reduce any Pu(VI) potentially present in solution and adjust Pu oxidation state to IV. The prepared solutions, left to homogenize and react overnight, were finally fumed to dryness under a nitrogen gas sweep.
142 143 144 145 146 147 148 149 150 151 152 153 154 155 156 157 158 159 160 161 162 163 164 165 166 167 168 169
Furthermore, it is important to note that the conversion of the Pu into Pu(SO4)2 allows to
generate salts which can be redissolved easily in molar nitric acid [15, 16] prior to analysis.
Electrical calibration
A calibration of the analog-to-digital converter used for current integration was performed by a high precision current calibrator and allowed to apply appropriate corrections to the reading of integrated current measured during experiments.
Electrode pre-treatment
The gold working electrode was stored in 8 mol/L nitric acid when not in use.
Prior to analysis, a pre-treatment was applied to the working-electrode in a supporting electrolyte of nitric acid (0.9 mol/L) combined with a small quantity (two drops, approximately 100 µL) of sulfamic acid. This pre-treatment consisted in conducting a series of pulses: oxidation at E1=E°’+320 mV, reduction at E2=E°’-360 mV, and
oxidation back to E1 (where E°’ is the formal potential of the Pu(IV)/Pu(III) redox pair in
HNO3 0.9 mol/L) [5].
Blank measurement
A blank was measured in the same medium which served for pre-treatment. The procedure consisted in a reduction step at E1=E°’-230 mV followed by an oxidation step
at E2=E°’+230 mV. The duration of oxidation (t1), the residual current (ir1), and the raw
quantity of electricity of the blank (Q1) were recorded during the oxidation step. For both
electrochemical steps, the reaction was ended when a stable current of a few µA with a drift inferior to 1 µA over 100 s was recorded. The potentials applied during this phase were the same as those used for the coulometric analysis of Pu [3].
Analysis of plutonium
The dried test sample was dissolved in the supporting electrolyte used for the blank measurements. 170 171 172 173 174 175 176 177 178 179 180 181 182 183 184 185 186 187 188 189 190 191 192 193 194 195
During analysis measurements, the Pu(IV) in the test sample was first reduced to Pu(III) by applying a potential E1 (E1=E°’-230 mV). The generated Pu(III) solution was then
oxidized back to Pu(IV) by applying a potential E2 (E2=E°’+230 mV). During the two
electrochemical processes, the shift in applied potential from E°’ of 230 mV was chosen in order to ensure the almost complete conversion of Pu at equilibrium (close to 99.99%) whilst avoiding the reactions of interfering species. The current measured during the oxidation phase was integrated as a function of time until the same stopping criteria as those used for the measurement of the blank (a stable current of a few µA with a drift inferior to 1 µA over 100 s) were reached. During this second phase, the duration of oxidation (t2), the residual current (ir2), and the raw quantity of electricity (Q2) spent
during the phase, were recorded.
The net quantities of electricity, for the blank and the sample (noted as Qb and Qs,
respectively) were calculated from the raw quantities of electricity Q1 and Q2, by
subtracting of the quantity of electricity due to the residual currents from the raw quantity of electricity (as shown in Eq. (1) and (2) for Qb and Qs, respectively):
Qs=Q2-ir2t2 (1)
Qb=Q1-ir1t1 (2)
By incorporating Qs and Qb in Faraday’s law, the mass of Pu in the studied sample can be
expressed as shown in Eq. (3): mPu=(Qs-Qb)MPu/(nFf) (3)
A correction factor, f, which accounts for the fractions of Pu not electrolyzed during the analysis is also introduced in Eq. (3). f takes into account the amount of Pu(IV) not reduced during first stage of the analyses and that of Pu(III) not oxidized during the second stage of the analyses. It is dependent on potentials applied and calculated by applying Nernst Law (taking the assumption that the system has reached equilibrium). f is expressed as shown in Eq. (4):
196 197 198 199 200 201 202 203 204 205 206 207 208 209 210 211 212 213 214 215 216 217 218 219 220 221
n∙ F ∙
(
E2−E°')
R ∙ T ¿ ¿ n∙ F ∙(
E1−E °')
R ∙ T ¿ ¿ exp¿ exp¿ f =¿ (4)In Eq. (4), E2 and E1 are the potentials applied for the oxidation and reduction phases,
respectively; E°’ is the formal potential of the Pu(IV)/Pu(III) redox pair; n is the number of electrons exchanged (equal to 1 for the studied system); F is Faraday’s constant; R is the molar gas constant (equal to 8.3144598 J mol-1 K-1 [9]); and T is the temperature of
the studied system (in K).
Although the value of f is very close to 1, typically 0.9997, it is indispensable to take into account in order to achieve high accuracy.
Monte Carlo Method simulation
The MCM calculations were run using the JMP ®13.0.0 software developed by SAS Institute Inc. using a random draw of 1,000,000. From the mathematical expressions of Pu mass fraction and f, the probability density function was calculated for those terms using the parameters input of each variable (value, standard uncertainty, and assumed distribution).
Results and Discussion
Sample weighing
The weight measurements performed for sampling and dilution of the concentrated Pu solution (considered hereafter as the stock solution) during this experiment are presented in Table 1. In the table, the mass of the stock and diluted solutions are given both as read 222 223 224 225 226 227 228 229 230 231 232 233 234 235 236 237 238 239 240
and as corrected for air buoyancy. The K factor used for air buoyancy correction is described in Eq. (5): K=
(
1−ρair ρstd)
(
1−ρair ρsol)
with mcorrected=K ×mas read (5)
In Eq. (5), ρair is the air density which is dependent of temperature, relative humidity
and pressure recorded during experiment (in this study, conditions in glove box were: pressure = 100450 Pa, relative humidity = 59,6% and temperature = 19,0°C giving
ρair = 1.1925 kg/m3), ρ
std is the density of the inox standard used for the scale
calibration (8010 kg/m3), ρ
sol is the density of the weighed solution.
A systematic mass measurement error (bias between 0.09% and 0.10%) was observed, which demonstrates that at the level of uncertainty desired, the correction for air buoyancy is not negligible for a solution which density is close to 1000 kg/m3 (and is, in
fact, essential). By contrast, the air buoyancy correction uncertainty will be neglected in the global calculation of mass measurement uncertainty as it was estimated to be 0.0002% and found insignificant by Cordaro and coworkers [13].
EQRAIN solution Diluted EQRAIN solution
m(tare) (g) 133.35252 148.46070 m(tare+solution) (g) 148.46070 189.52380 m(solution) as read (g) 15.10823 56.17128 density (kg/m3) 1144.64 1057,0 m(solution) corrected (g) 15.12173 56.22635
Table 1 Weight measurements of stock and diluted solutions, both the gross data and
that corrected for air buoyancy are reported
Dilution factor calculation
By using the masses of the EQRAIN (mEQRAIN) and diluted EQRAIN (mdil. EQRAIN) solutions
(corrected for air buoyancy), a dilution factor, DF, was evaluated as expressed in Eq. (6). DF=mdil. EQRAIN mEQRAIN (6) 241 242 243 244 245 246 247 248 249 250 251 252 253 254 255 256 257 258 259 260
The relative standard uncertainty on DF, ur(DF), was expressed as shown in Eq. (7),
considering that the standard uncertainty for mass values between 50 and 200 g is equal to MPE (MPE = 2 mg) divided by
√
3 (uniform distribution law).ur( DF )=
√
ur2(
mEQRAIN)
+ur 2(
mdil. EQRAIN)
= 1√
3√
(
MPE mEQRAIN)
2 +(
MPE mdil. EQRAIN)
2 =0.008 % (7) In Eq. (7), ur 2(
mEQRAIN)
and ur 2(
mdil. EQRAIN)
are the relative variance of mEQRAIN andmdil. EQRAIN respectively, mEQRAIN = 15121.73 mg, mdil. EQRAIN = 56226.35 mg and MPE = 2 mg.
From Eq. (6) and (7), DF was determined to be 3.71825±0.00059 (k=2) for this experiment.
Measurement of the Pu(IV)/Pu(III) formal redox potential
The determination of the formal potential (E°’) value in the same conditions as the CPC titration (using a gold electrode and a 0.9 mol/L HNO3 medium) is required in order to
calculate the corrective factor f. E°’ was determined from a series of five coulograms, the results of which are reported in Table 4. Coulograms are plots of the quantity of electricity, Q, necessary to reach equilibrium (i.e. low current) from a completely reduced solution in function of the potential applied to the working electrode, E. The inflexion point of the curve observed in a coulogram corresponds to the studied couple’s E°’, a potential at which there is as much oxidizer Pu(IV) as there is reducer Pu(III). This inflexion point is determined by plotting ln(Q/Qmax-Q) vs. E (where Qmax is the maximum
value of Q) and determining the x-intercept of the linear regression of the plotted curve. An example of the determination of E°’ for a given experiment is presented in Fig. 2.
(a) (b) 261 262 263 264 265 266 267 268 269 270 271 272 273 274 275 276 277 278 279 280 281
Fig. 2 Coulogram of experiment LF06 for a Pu nitrate solution in 0.9 mol/L HNO3
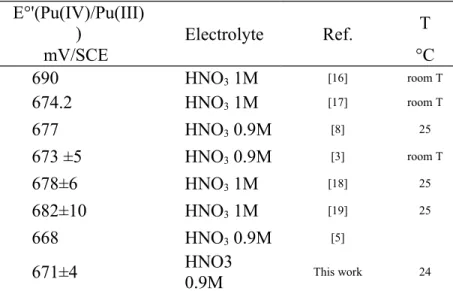
and a small amount of sulfamic acid. In both graphs the experimental values are represented by the crosses whilst the lines show the simulation of the data calculated according to the Nernst law (a) and the linear regression used to determine E°’(b) The mean value of E°’ (671 ± 4) mV/SCE of the Pu(IV)/Pu(III) couple calculated from coulograms during the present study is shown in Table 2 in relation to the values reported in literature for comparable media. It can be seen that the E°’ determined during this series of experiments is consistent with the previously reported values, demonstrating the validity of using coulograms for the determination of E°’ under the chosen experimental conditions. E°'(Pu(IV)/Pu(III) ) Electrolyte Ref. T mV/SCE °C 690 HNO3 1M [16] room T 674.2 HNO3 1M [17] room T 677 HNO3 0.9M [8] 25 673 ±5 HNO3 0.9M [3] room T 678±6 HNO3 1M [18] 25 682±10 HNO3 1M [19] 25 668 HNO3 0.9M [5]
671±4 HNO3 0.9M This work 24
Table 2 Comparison of Pu(IV)/Pu(III) formal potentials in aqueous nitric acid
solutions (with concentrations close to 1 mol/L, in mV/SCE) from literature with the value calculated during the present study
Blank repeatability
As discussed previously, the quantity of electricity of the blank, Qb, needs to be taken
into account as a corrective factor during analysis. In order to establish the precision of Qb in repeatability conditions, a series of 8 consecutive measurements was recorded for a
single experiment (LF01). The mean value of Qb (12.2 mC) and its standard uncertainty
(u(Qb) = 0.7 mC) over the 8 measurements are reported in Table 3 in addition to the
specific details for each measurement. 282 283 284 285 286 287 288 289 290 291 292 293 294 295 296 297 298 299 300 301
replicates 1 2 3 4 5 6 7 8 Meanvalue u(Qb) Q1 (mC) 12.0 13.7 13.2 13.2 13.1 13.1 12.9 12.9 13.01 0.45 ir1 (µA) 3.32 2.11 1.74 1.74 1.40 1.26 1.51 0.96 1.76 0.68 t1 (s) 466 432 436 436 465 393 393 472 437 29 Qb (mC) 10.5 12.8 12.4 12.4 12.5 12.6 12.3 12.4 12.24 0.69
Table 3 Variations in Qb over a series of consecutive measurements
It is important to note, at this point, that the blank determination and the control of its variability are particularly important during analyses. Indeed, a variation of 1 mC, for instance, is representative of 2.5 µg Pu and corresponds to 2.5/6000 = 0.04% of the total signal recorded during an analysis.
Analysis of pure plutonium nitrate solutions
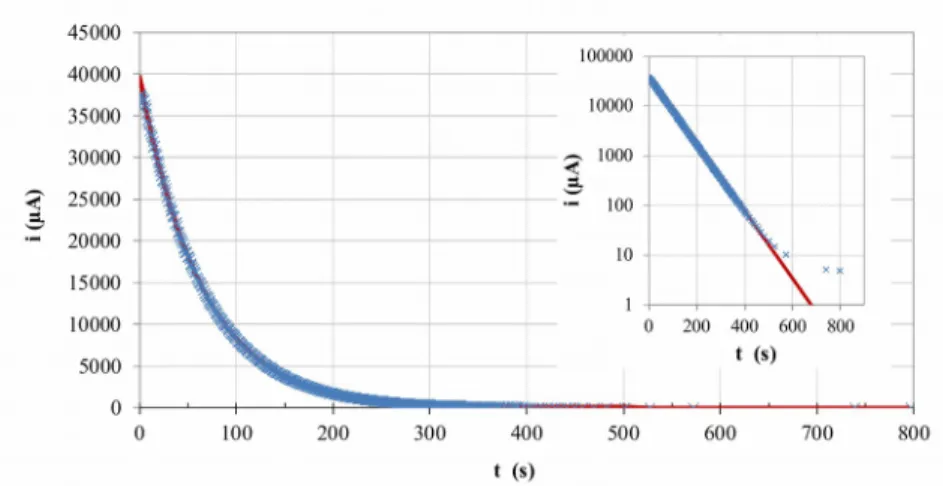
Figure 3 shows the evolution of current in the coulometric cell in relation to time during the second phase of the Pu analysis (the oxidation of Pu(III) to Pu(IV)). The recorded current can be seen to decrease exponentially in relation to time, consistently with the typical current response at a working electrode to a potential pulse for a transport regime limited by convective diffusion [20].
Fig. 3 Plot of the current versus time for the oxidation of a Pu(III) solution at a gold
electrode during Experiment LF06. The Solid line represents the simulated data, whilst the crosses are the experimentally observed values. The insert shows the logarithmic plot
of current versus time for the same data 302 303 304 305 306 307 308 309 310 311 312 313 314 315 316 317
In reactions limited by convective diffusion, the evolution of current can be expressed as shown in Eq. (8) [21]. From this equation, the terms of initial current, i0, and cell
coefficient, p, can be estimated for an experiment’s given analytic conditions (including set-up, stirring mode, and nature of the analyte).
i(t)=i0exp (− pt) (8)
In Eq. (9), the coefficient cell, p, is expressed in s-1 and represents the rate of the reaction.
p is expressed as a function of the surface area of the electrode, A, the volume of solution, V, and the mass transfer coefficient, m. In a convective diffusion regime, m is dependent on the diffusion coefficient of the Pu species, on the viscosity of the medium, and on the stirring speed during experiments.
p=m A
V (9)
The inverse value of p represents the cell constant, (expressed in seconds). For a duration of electrolysis corresponding to 6.9, a proportion of 99.9% of the initial Pu(III) will have been oxidized. This calculation provides a good indication of the time of analysis required by a CPC titration (at least 500 s).
From Eq. (8) and (9), it was possible to determine the terms io, p, and for the
experiments performed in this study. The values for these terms as determined by the mathematical simulations are shown in Table 4 in addition to the io, value measured
experimentally. It can be seen that the terms are reproducible between experiments. The mean value of p (close to 1510-3 s-1) is consistent with values previously reported in
literature [21]. As such, the stirring procedure in the present study can be considered optimized for the specific experimental conditions: sufficient to reach a reasonable rate of reaction without risks of splashing.
Experimen
t i0 exp (µA) i0 sim (µA) 10
3 p (s-1) (s) 6,9 (s) LF04 33788 35025 13.8 72.4 500 LF05 34465 36406 14.4 69.4 479 LF06 36238 39785 15.7 63.9 441 LF07 32448 34814 13.7 72.9 503 LF08 34570 36615 14.5 69.1 477
Table 4 Parameters of the current simulation: cell constant determination for the series of
experiments 318 319 320 321 322 323 324 325 326 327 328 329 330 331 332 333 334 335 336 337 338 339 340 341 342
Having established the suitability and precision in reproducibility conditions of the experimental procedure employed, titrations of five aliquots of the EQRAIN Pu 14 standard (vial S007) was performed at room temperature (24°C). The Pu mass in the studied samples was determined as a function of the quantity of electricity used during the analysis (corrected, as written in Eq. (10), for the responses of the residual and blank currents as well as the fraction of Pu electrolyzed) as previously described in Eq. (3). It is important to note that the molecular mass of Pu in the samples was corrected at the date of analysis in order to account for radioactive decay.
mPu= Q nFf MPu
=(Q2−Q1−ir 2t2+ir 1t1)
nFf MPu
(10)
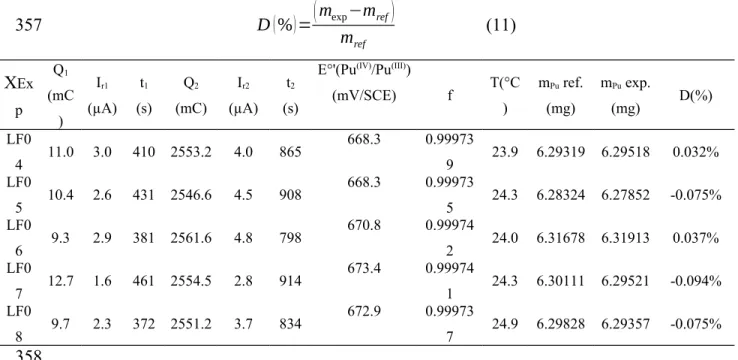
The results of the five analyses are presented in Table 5 and compared to the reference mass of Pu (calculated from an equivalent mass of reference solution). The bias on the measurements (D%) is calculated from the difference between the experimental and reference values, as shown in Eq. (11).
D (%)=
(
mexp−mref)
mref (11) XEx p Q1 (mC ) Ir1 (µA) t1 (s) Q2 (mC) Ir2 (µA) t2 (s)E°'(Pu(IV)/Pu(III))
(mV/SCE) f T(°C ) mPu ref. (mg) mPu exp. (mg) D(%) LF0 4 11.0 3.0 410 2553.2 4.0 865 668.3 0.99973 9 23.9 6.29319 6.29518 0.032% LF0 5 10.4 2.6 431 2546.6 4.5 908 668.3 0.99973 5 24.3 6.28324 6.27852 -0.075% LF0 6 9.3 2.9 381 2561.6 4.8 798 670.8 0.99974 2 24.0 6.31678 6.31913 0.037% LF0 7 12.7 1.6 461 2554.5 2.8 914 673.4 0.99974 1 24.3 6.30111 6.29521 -0.094% LF0 8 9.7 2.3 372 2551.2 3.7 834 672.9 0.99973 7 24.9 6.29828 6.29357 -0.075%
Table 5 Results, experimental parameters, and calculated bias for the experimental
determination of Pu mass for EQRAIN Pu 14 standard samples by CPC
It can be seen in Table 5 that a bias of less than 0.1% was observed for individual results. This low bias is consistent with the expected performances of CPC [4,5].
343 344 345 346 347 348 349 350 351 352 353 354 355 356 357 358 359 360 361 362
Uncertainty calculations according to GUM
The Pu mass fraction [Pu] (in g/kg) in the analyzed samples was determined by the ratio between the experimental mass of Pu, mPu, and the weight of diluted solution
(corresponding to the mass of sample corrected for air buoyancy, msample) divided by the
dilution factor DF. From this, the Pu mass fraction can be expressed as shown in Eq. (12).
[
Pu]
= mPu msample DF = Q nFf MPu msample DF (12)Precision analysis on the Pu mass fraction determination can be carried out by a classical GUM approach [10], which consists in applying the law of propagation of variances to the mathematical expression of the Pu mass fraction reported in Eq. (12). During GUM analysis, only the uncertainties on the parameters Q, msample, and DF are taken into
account as the uncertainties on the MPu, and f parameters can be considered negligible (as
discussed later in this text).
Indeed, uncertainties on MPu, and f, have been estimated according to their probability
distribution and their standard uncertainty (taken from previous experiments, see Table 6). The uncertainty on MPu was taken from the MP2 CRM certificate, considering that the
uncertainty from radioactive decay between the dates of analysis is non-significant. The value of the Faraday constant, F, was taken from the CODATA publication and is considered as a constant since 2019 [9]. Concerning the f factor, its uncertainty range was calculated by experimentally varying the formal potential by ±5mV and measuring its impact on the f value. This gave a measuring span of 0.006% [22] and a relative standard uncertainty of 0.0017% (i.e. 0.006/(2
√
3) ) (considering a uniform distribution).Variable ur (k=1) distribution Ref.
MPu 3.8 10-5 % normal [23]
f 1.7 10-3% uniform [22]
Table 6 Relative uncertainty evaluations for MPu, and f factors.
Eliminating the negligible terms, the expression of the combined relative uncertainty, ur,
could then be simplified as expressed in Eq. (13). It is important to note that each term in 363 364 365 366 367 368 369 370 371 372 373 374 375 376 377 378 379 380 381 382 383 384 385 386 387 388
Eq. (13) is independent (there are no covariance terms) and must thus be evaluated in order to assess the global variance on Pu mass fraction
ur2
([
Pu])
=ur2(Q)+ur2(DF)+ur2(
msample)
(13)The variance of Q terms is difficult to estimate because every Pu coulometric experiment is unique and can not be repeated. Thus, in a first approach, we consider that it is proportional to the variance of the quantity of electricity of the blank, u2(Q
b), which is the
best estimator of the uncertainty for the integration of current. As such ur(Q) can be expressed as shown in Eq. (14):
ur2(Q)=u2r
(
Qs−Qb)
=u 2(
Qs−Qb)
Q2 =2 u2(
Qb)
Q2 (14)Numerically, ur(Q) was calculated to be:
ur(Q)=
√
2u(
Qb)
Q =√
2 ×0.7
2500=0.040 %
Concerning the variance of msample in Eq. (15), it was estimated from the MPE of the scale
in the 0-50 g range (1 mg) and the expected uniform distribution law for weighing: ur 2
(
msample)
=1 3 MPE2 m2sample (15) Which becomes: ur(
msample)
= 1√
3× 1 4250=0.014 %The variance on DF has already been discussed and the numerical value of the relative uncertainty is:
ur( DF )=0.008 %
The relative standard uncertainty on Pu concentrations is then a combination of these three variances (cf. Eq. (13)):
ur
([
Pu]
)
=√
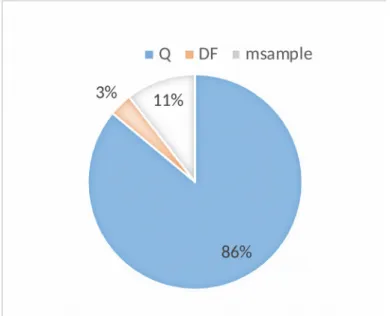
0.0402+0.0142+0.0082=0.043 %From this, it is possible to calculate each element’s contribution to the uncertainty budget. The major contributor to the uncertainty budget is the measurement of the quantity of electricity (86%), followed by the contribution of the weighing of the sample (11%) and that of the dilution factor (3%) (as seen in Fig. 4).
389 390 391 392 393 394 395 396 397 398 399 400 401 402 403 404 405 406 407 408 409 410 411 412 413 414 415
Fig. 4 Uncertainty budget distribution between the measurement of the quantity of
electricity, Q, the dilution factor, DF, and the sample mass, msample
It can be seen from Fig. 4 that the weighing operations, if they are properly conducted, are not detrimental to the accuracy of CPC measurements (14% of the uncertainty budget). However, the quality of the measurement of the quantity of electricity, and, most importantly, the stability of the blank response, are particularly important to the accuracy of the performed analytical measurements.
Uncertainty calculations by the Monte Carlo Method
The Monte Carlo Method (MCM) for the evaluation of measurement uncertainty is based on the propagation of probability distributions[11, 24, 25]. This method is a practical alternative to the GUM classical approach and is of greater advantage when:
- the measurand mathematical model is complicated and introduces errors due to both linearization and difficulty to provide the partial derivatives of the model.
- the uncertainties of the input variables are not of the same magnitude. This approach is
actually more appropriate for the estimation of the uncertainties of f and mPu since their
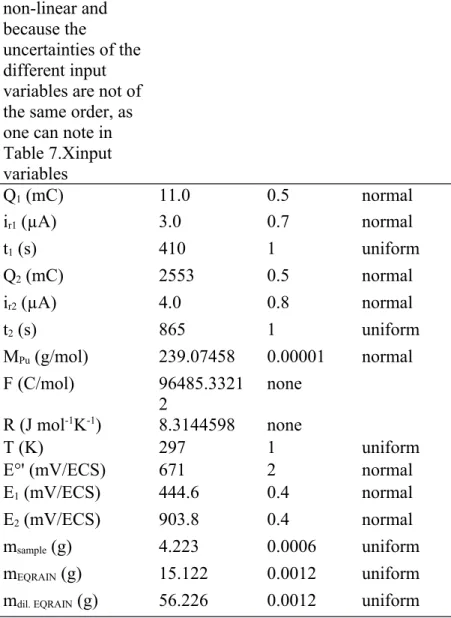
expressions are value standard uncertaint y (k=1) assumed distribution 416 417 418 419 420 421 422 423 424 425 426 427 428 429 430
non-linear and because the uncertainties of the different input variables are not of the same order, as one can note in Table 7.Xinput variables Q1 (mC) 11.0 0.5 normal ir1 (µA) 3.0 0.7 normal t1 (s) 410 1 uniform Q2 (mC) 2553 0.5 normal ir2 (µA) 4.0 0.8 normal t2 (s) 865 1 uniform MPu (g/mol) 239.07458 0.00001 normal F (C/mol) 96485.3321 2 none R (J mol-1K-1) 8.3144598 none T (K) 297 1 uniform
E°' (mV/ECS) 671 2 normal
E1 (mV/ECS) 444.6 0.4 normal
E2 (mV/ECS) 903.8 0.4 normal
msample (g) 4.223 0.0006 uniform
mEQRAIN (g) 15.122 0.0012 uniform
mdil. EQRAIN (g) 56.226 0.0012 uniform
Table 7 Value, standard deviation, and distribution of input variables for the evaluation
of measurement uncertainty by MCM (example data from experiment LF04 except for E°’ taken equal to the formal potential mean value)
For MCM analysis, a great number of parameter values, N, are sampled at random from the distribution of the input quantities. If N is large enough (usually N 106 as
recommended in the supplement 1 of GUM10), a probability density function for the measurement results can be traced. From this probability function, the parameters (expectation and variance) can be estimated. With MCM simulations, the coverage interval (CI) of the distribution comes directly from the probability density function of 431 432 433 434 435 436 437 438 439 440
the measurement result. This is one of the main advantages of MCM when compared to the classical GUM approach, where a normal distribution assumption has to be made. For the MCM simulation studies, the full mathematical expression for the Pu mass fraction is presented in Eq. (16).
[
Pu]
= Q nFf MPu DF msample= (Q2−Q1−ir 2t2+ir 1t1) nFf MPu mdil. EQRAIN mEQRAIN. msample (16) Using the input parameters of Table 7, the probability density function was thus calculated for the [Pu] and f terms using the JMP software and their profiles were plotted as seen in Fig. 5. From these profiles, the coverage intervals are deduced.[Pu] (g/kg) fraction electrolyzed f
Fig. 5 Probability density functions and quartiles (shown in the box plots above each
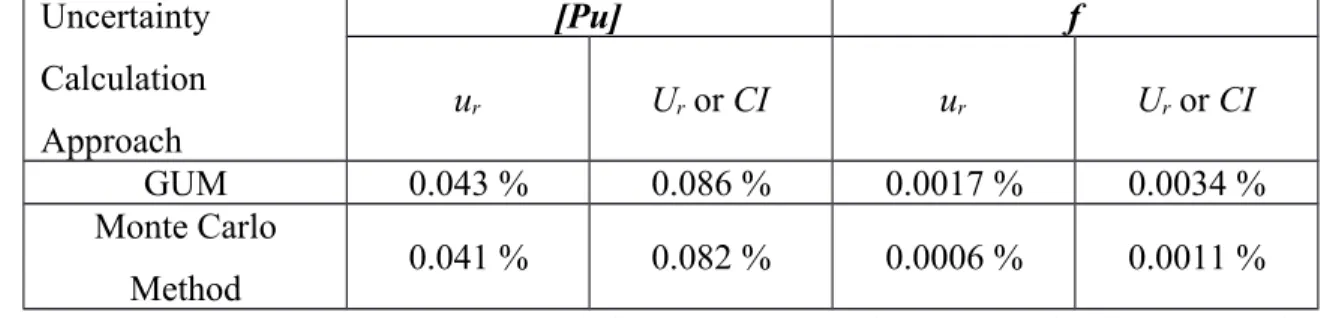
function) for the Pu concentration (left), and the fraction of Pu electrolyzed (right) calculated from Monte Carlo calculations by using the input details presented in Table 7 Uncertainty Calculation Approach [Pu] f ur Ur or CI ur Ur or CI GUM 0.043 % 0.086 % 0.0017 % 0.0034 % Monte Carlo Method 0.041 % 0.082 % 0.0006 % 0.0011 %
Table 8 Comparison of uncertainty evaluations between the GUM and MCM approaches.
The uncertainties calculated through the MCM are shown in Table 8 and compared to those calculated previously with the GUM method. It is possible to see that the values of [Pu] uncertainties are consistent between the two calculations. As the Qs and f terms are
estimated more finely by Monte Carlo Method, the GUM approach tends to overestimate 441 442 443 444 445 446 447 448 449 450 451 452 453 454 455 456 457 458
the Pu uncertainty slightly. From Fig. 5, it can be seen that the probability density functions from the MCM simulations are symmetrical and not significantly different from a Gaussian shape. As such it was possible to express the (relative) standard uncertainty terms by dividing the CI from MCM by 2. It is also important to note from these results that the very low uncertainty of the f term (below 0,001% at k=1) as calculated by the MCM approach, corroborates the hypothesis that its variability could be neglected during the GUM calculations.
Based on these results, it is possible to say that the MCM approach appears to be a powerful tool for the determination of uncertainties on Pu concentration analysis through CPC titration.
Trueness analysis
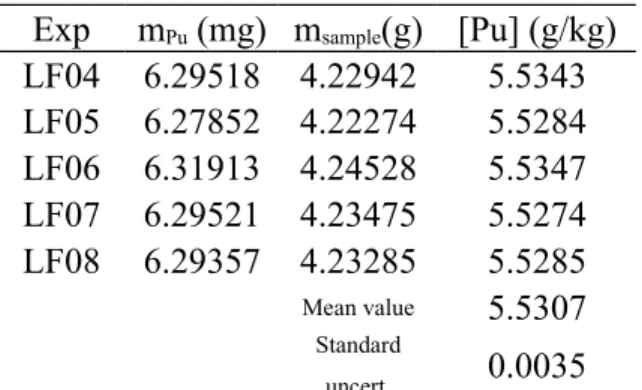
The Pu mass fraction determined by using Eq. (10) for each of the 5 replicates, is reported in Table 9.
Exp mPu (mg) msample(g) [Pu] (g/kg)
LF04 6.29518 4.22942 5.5343 LF05 6.27852 4.22274 5.5284 LF06 6.31913 4.24528 5.5347 LF07 6.29521 4.23475 5.5274 LF08 6.29357 4.23285 5.5285 Mean value 5.5307 Standard uncert. 0.0035
Table 9 Pu mass fraction in g/kg determined from the experimental analyses
performed
The final analysis result was determined from the mean of the 5 replicates and calculated to be [Pu]mean = 5.5307 g/kg. The bias on this value was calculated (from Equ. (17)) as
-0.035%.
bias=[Pu]mean−
[
Pu]
ref[Pu]ref
=5.5307−5.5326
5.5326 =−0.035% (17)
The estimation of the standard uncertainty in condition of repeatability with 5 replicates is equal to 0.0035 g/kg. This is consistent with the standard uncertainty calculated by the 459 460 461 462 463 464 465 466 467 468 469 470 471 472 473 474 475 476 477 478 479 480 481
MCM approach which is 0.0023 g/kg and can be used to estimate the trueness of the method.
The significance of the method’s bias was then analyzed through the normalized deviation term, En , as shown in Eq. (18) (where [Pu]ref = 5.5326 g/kg, uref = 0.0033 g/kg,
and uexp = 0.0023 g/kg). If En is lower than 2 in absolute value, the bias is considered
non-significant.
En=
[
Pu]
mean−[
Pu]
ref√
uexp2+uref2 (18)
In our case, this calculation gives:
|
En|
=|
5.5307−5.5326|
√
0.00232+0.00332=0.5<2As such, no bias is observed for the result corresponding to the mean of 5 replicates. The CPC method can thus be considered a true method for the determination of Pu mass fraction.
Final expression of the result
The results for the determinations of Pu mass fraction in the experiments LF04 – LF08 with their expanded uncertainties are shown in Fig. 6 in relation to the known reference value (and its uncertainty).
482 483 484 485 486 487 488 489 490 491 492 493 494 495 496 497 498 499
Fig. 6 Plot of the results of the CPC tritrations of the EQRAIN Pu 14 solution in terms of
deviation from the reference value (solid line). The confidence intervals of the reference value (band), and the individual measurements (dashes) are also plotted (k=2) It can be seen from Fig. 6 that the results lie within the confidence interval of the reference and on both sides of the reference line, thus demonstrating no significant bias. Furthermore, the uncertainty of the measurements is of the same order of magnitude to that of the reference, indicating that the coulometric method is a suitable technique for the verification of reference values during the certification process of RM.
From these studies, the final expression of the analysis results is taken as the arithmetic mean of the 5 measurements combined with the expanded uncertainty, equivalent to the uncertainty calculated by MCM (in a conservative approach, it was chosen not to divide by the square root of 5 ).
[
Pu]
=(5.5307 ±0.0045 ) g/ kg (k=2)Coulometry performance evaluation at the LAMMAN and comparison to
ITVs
As was reported in Table 10, the relative uncertainty from MCM estimations for the CPC titration method performed at the LAMMAN on pure nitrate solutions was calculated to be 0.082% (k=2). This uncertainty can be compared to the data taken from the IAEA’s ITVs 2010 [1] wherein the ITV = 0.14%. The LAMMAN’s performance in the field of coulometry applied to the metrology of Pu is lower than the corresponding ITV because measurements are done in pure nitrate solutions in ideal laboratory conditions but are nevertheless consistent with the international expectations established by the ITVs 2010. This result confirms the role of such a technique for the highly accurate determination of Pu amounts, which is needed in the case of certification of RMs.
Conclusion
The present study details the state of art in the practice of highly accurate CPC at the CETAMA’s LAMMAN. It provides information about the way in which CPC 500 501 502 503 504 505 506 507 508 509 510 511 512 513 514 515 516 517 518 519 520 521 522 523 524 525 526
experiments are performed as well as how the uncertainty of analytical measurements is estimated. Two methodologies were applied and compared: the classical GUM approach and the Monte Carlo Method. The two approaches gave comparable values. However, the MCM calculations were found to give a finer estimation of the distribution of probability of nonlinear expressions such as the concentration of Pu and the fraction of material electrolyzed without requiring the application of simplifying assumptions.
Considering the promising results, the MCM method will be adopted in the future for our protocol on the evaluation of uncertainty measurements for coulometric measurements. This is also possible due to the availability of commercial software powerful enough to perform the taxing calculations required by the MCM simulations.
Finally, it is important to note that the performances reached by the LAMMAN for the coulometric analysis of pure nitrate solutions are consistent with the IAEA International Target Values. These results confirm the importance of the analytical technique for the production of certified RMs.
As the CETAMA is now in capacity of producing certified RMs of mixed uranium/plutonium pure nitrate solutions (named EQRAIN(U+Pu) ), future research on the technique will focus the applicability of CPC and its implementation for the determination of Pu in presence of large amounts of uranium.
References
1. Zhao K, Penkin M, Norman C, et al (2010) International Target Values 2010 for Measurement Uncertainties in Safeguarding Nuclear Materials - report number IAEA-STR-368. IAEA, International Atomic Energy Agency (IAEA), Vienna (Austria)
2. Macdonald A, Savage DJ (1979) Plutonium accountancy in reprocessing plants by ceric oxidation, ferrous reduction and dichromate titration. - report number IAEA-AM-231/52. IAEA
3. Ruas A, Leguay N, Sueur R, et al (2014) High accuracy plutonium mass
determination by controlled-potential coulometry. Radiochim Acta 102:691–699. https://doi.org/10.1515/ract-2013-2213 527 528 529 530 531 532 533 534 535 536 537 538 539 540 541 542 543 544 545 546 547 548 549 550 551 552 553 554 555
4. Momotov VN, Erin EA (2017) Coulometric methods for uranium and plutonium determination. Radiochemistry 59:1–25.
https://doi.org/10.1134/S1066362217010015
5. Nuclear fuel technology - Controlled-potential coulometric assay of plutonium , ISO 12183:2018
6. Clark DL (2019) Plutonium handbook, 2nd edition. American Nuclear Society, La Grange Park, Illinois, USA
7. Harrar JE (1987) Analytical controlled-potential coulometry. TrAC Trends Anal Chem 6:152–157. https://doi.org/10.1016/0165-9936(87)80010-9
8. Holland MK, Weiss JR, Pietri CE (1981) A reference method for the determination of Plutonium using controlled potential coulometry. Proc 3rd ESARDA Symp Safeguards Nucl Mater Manag Karlsr Ger
9. Newell DB, Cabiati F, Fischer J, et al (2018) The CODATA 2017 values of h , e , k , and N A for the revision of the SI. Metrologia 55:L13–L16.
https://doi.org/10.1088/1681-7575/aa950a
10. (2008) Evaluation of measurement data – Guide to the expression of uncertainty in measurement (GUM), report number JCGM 100:2008. Joint committee for guides in metrology
11. (2008) Evaluation of measurement data – Supplement 1 to the “Guide to the expression of uncertainty in measurement” - Propagation of distributions using a Monte Carlo method, report number JCGM 101. Joint committee for guides in metrology
12. Borges PP, da Silva WB (2014) Metrological evaluation of the certification of primary reference materials characterized by high-precision constant-current coulometry for the reliability of the titration analyses. J Appl Electrochem 44:1411– 1420. https://doi.org/10.1007/s10800-014-0768-x
13. (1999) Standard test method for plutonium by controlled-potential coulometry, ASTMC 1108-99. ASTM International, West Conshohocken,PA.
14. Holland MK, Cordaro JV (2009) Mass measurement uncertainty for plutonium aliquots assayed by controlled-potential coulometry. J Radioanal Nucl Chem 282:555–563. https://doi.org/10.1007/s10967-009-0173-9
15. Milyukova MS, Gusev NI, Sentyurin IS (1967) Analytical Chemistry of Plutonium. Wiener Bindery Ltd, Jerusalem
16. Shults W (1963) Applications of controlled-potential coulometry to the determination of plutonium. Talanta 10:833–849. https://doi.org/10.1016/0039-9140(63)80244-1 556 557 558 559 560 561 562 563 564 565 566 567 568 569 570 571 572 573 574 575 576 577 578 579 580 581 582 583 584 585 586 587 588 589 590
17. Holland MK, Weiss JR, Pietri CE (1978) Controlled-potential coulometric determination of plutonium. Anal Chem 50:236–240.
https://doi.org/10.1021/ac50024a018
18. Georgette S, Picart S, Bouyer C, et al (2014) Study of the plutonium (IV)
electrochemical behavior in nitric acid at a platinum electrode. Application to the cathodic reduction of Pu(IV) in a plate electrolyzer. J Electroanal Chem 727:163– 170. https://doi.org/10.1016/j.jelechem.2014.06.015
19. Fallet A, Larabi-Gruet N, Jakab-Costenoble S, Moisy P (2016) Electrochemical behavior of plutonium in nitric acid media. J Radioanal Nucl Chem 308:587–598. https://doi.org/10.1007/s10967-015-4423-8
20. Bard AJ, Faulkner LR (1980) Electrochemical methods: fundamentals and applications. Wiley, New York
21. Audouin P (1981) Controlled potential coulometry: study of the method and its application, Report number CEA-R-5117. CEA
22. Leguay N (2011) Plutonium titration by controlled potential coulometry, Report number CEA-R-6264. CEA
23. Plutonium metal MP2, Reference Material Certificate. CETAMA
24. Cox M, Harris P, Siebert BR-L (2003) Evaluation of Measurement Uncertainty Based on the Propagation of Distributions Using Monte Carlo Simulation. Meas Tech 46:824–833. https://doi.org/10.1023/B:METE.0000008439.82231.ad
25. Cox MG, Siebert BRL (2006) The use of a Monte Carlo method for evaluating uncertainty and expanded uncertainty. Metrologia 43:S178–S188.
https://doi.org/10.1088/0026-1394/43/4/S03 591 592 593 594 595 596 597 598 599 600 601 602 603 604 605 606 607 608 609 610 611 612 613