HAL Id: hal-03014303
https://hal.archives-ouvertes.fr/hal-03014303
Submitted on 19 Nov 2020
HAL is a multi-disciplinary open access
archive for the deposit and dissemination of
sci-entific research documents, whether they are
pub-lished or not. The documents may come from
teaching and research institutions in France or
abroad, or from public or private research centers.
L’archive ouverte pluridisciplinaire HAL, est
destinée au dépôt et à la diffusion de documents
scientifiques de niveau recherche, publiés ou non,
émanant des établissements d’enseignement et de
recherche français ou étrangers, des laboratoires
publics ou privés.
photoexcited bacteriorhodopsin
Gabriela Nass Kovacs, Jacques-Philippe Colletier, Marie Luise Grünbein,
Yang Yang, Till Stensitzki, Alexander Batyuk, Sergio Carbajo, R. Bruce
Doak, David Ehrenberg, Lutz Foucar, et al.
To cite this version:
Gabriela Nass Kovacs, Jacques-Philippe Colletier, Marie Luise Grünbein, Yang Yang, Till Stensitzki,
et al.. Three-dimensional view of ultrafast dynamics in photoexcited bacteriorhodopsin. Nature
Com-munications, Nature Publishing Group, 2019, 10 (1), �10.1038/s41467-019-10758-0�. �hal-03014303�
Three-dimensional view of ultrafast dynamics
in photoexcited bacteriorhodopsin
Gabriela Nass Kovacs
1
, Jacques-Philippe Colletier
2
, Marie Luise Grünbein
1
, Yang Yang
3
, Till Stensitzki
3
,
Alexander Batyuk
4
, Sergio Carbajo
4
, R. Bruce Doak
1
, David Ehrenberg
3
, Lutz Foucar
1
, Raphael Gasper
5
,
Alexander Gorel
1
, Mario Hilpert
1
, Marco Kloos
1
, Jason E. Koglin
4
, Jochen Reinstein
1
, Christopher M. Roome
1
,
Ramona Schlesinger
3
, Matthew Seaberg
4
, Robert L. Shoeman
1
, Miriam Stricker
1
, Sébastien Boutet
4
,
Stefan Haacke
6
, Joachim Heberle
3
, Karsten Heyne
3
, Tatiana Domratcheva
1
, Thomas R.M. Barends
1
&
Ilme Schlichting
1
Bacteriorhodopsin (bR) is a light-driven proton pump. The primary photochemical event upon
light absorption is isomerization of the retinal chromophore. Here we used time-resolved
crystallography at an X-ray free-electron laser to follow the structural changes in
multiphoton-excited bR from 250 femtoseconds to 10 picoseconds. Quantum chemistry and
ultrafast spectroscopy were used to identify a sequential two-photon absorption process,
leading to excitation of a tryptophan residue
flanking the retinal chromophore, as a first
manifestation of multiphoton effects. We resolve distinct stages in the structural dynamics of
the all-
trans retinal in photoexcited bR to a highly twisted 13-cis conformation. Other active
site sub-picosecond rearrangements include correlated vibrational motions of the
electro-nically excited retinal chromophore, the surrounding amino acids and water molecules as well
as their hydrogen bonding network. These results show that this extended photo-active
network forms an electronically and vibrationally coupled system in bR, and most likely in all
retinal proteins.
https://doi.org/10.1038/s41467-019-10758-0
OPEN
1Max-Planck-Institut für Medizinische Forschung, Jahnstraße 29, 69120 Heidelberg, Germany.2Univ. Grenoble Alpes, CNRS, CEA, Institut de Biologie Structurale, 71 Avenue des Martyrs, 38000 Grenoble, France.3Freie Universität Berlin, Department of Physics, Arnimallee 14, 14195 Berlin, Germany.4Linac Coherent Light Source (LCLS), SLAC National Accelerator Laboratory, 2575 Sand Hill Road, Menlo Park, CA 94025, USA.5Max-Planck-Institut für Molekulare Physiologie, Otto-Hahn-Str. 11, 44227 Dortmund, Germany.6Université de Strasbourg-CNRS, UMR 7504, IPCMS, 23 Rue du Loess, 67034 Strasbourg, France. Correspondence and requests for materials should be addressed to I.S. (email:Ilme.Schlichting@mpimf-heidelberg.mpg.de) or to T.D. (email:Tatjana.Domratcheva@mpimf-heidelberg.mpg.de)
123456789
R
hodopsins are retinal chromophore-containing
photo-receptors that form a class of membrane proteins with a
wide range of functionalities, including visual signalling
and ion channelling. The primary photochemical event upon
light absorption is the isomerization of retinal. This double-bond
isomerization is one of the most studied processes in
photo-biology. The quantum yield, regio-specificity and timescale of
photoisomerization differ between retinal in solution and retinal
bound to microbial and animal rhodopsins, respectively.
There-fore, interactions between the chromophore and the protein
matrix are expected to play a central role in controlling the
evolution of the excited state through steric constraints and
dynamic effects
1. In view of the extremely short timescale of the
reaction, it was hypothesized that coherent vibrational dynamics
play a critical role in directing isomerization
2. Although a great
deal is known about the excited-state dynamics of photoexcited
rhodopsins from ultrafast spectroscopy and computation,
knowledge of the ultrafast structural dynamics of the protein and
their role in the isomerization remains scarce. The best
char-acterized system is bacteriorhodopsin (bR), a light-driven proton
pump
3, due to its biochemical robustness. The retinal
chromo-phore of bR (Halobacterium salinarum) is linked to the side chain
of Lys216 via a protonated Schiff base (PSB, Fig.
1
a). Photon
absorption by all-trans retinal triggers a functional photocycle
consisting of a series of distinct spectroscopic intermediates
(I→J→K→L→M→N→O) with sub-ps (I), ps (J), µs (K, L) and
ms (M, N, O) lifetimes. Deprotonation of the Schiff base of
photoisomerized 13-cis retinal and protonation of Asp85 during
the L→M transition ultimately results in proton translocation to
the extracellular side of the membrane
4. The all-trans→13-cis
photoisomerization reaction (Fig.
1
a) has been mapped out
initially by ultrafast spectroscopy
5–7and calculations
8. These
studies indicate that the Franck–Condon (FC) region of
photo-excited all-trans retinal depopulates by relaxation along high
frequency stretching modes to form the excited (S
1) electronic
state I intermediate with a time constant
τ of ~0.2 ps. It decays
with
τ ~ 0.5 ps
9through a conical intersection to the vibrationally
hot 13-cis J-intermediate, before the K intermediate forms in 3 ps.
Back-reaction to a hot all-trans ground-state occurs on the
timescale of 1–2 ps
6. We here present a detailed study of these
events, in the limit of multiphoton excitation by time-resolved
serial femtosecond crystallography (TR-SFX). The latter is
com-plemented by ultrafast ultraviolet/visible (UV/VIS) and
mid-infrared (mid-IR) spectroscopy on bR in microcrystals and
solution, as a function of excitation intensity. Transient
absorp-tion (TA) spectroscopy and quantum chemical calculaabsorp-tions were
used to characterize both single and multiphoton effects, which
are expected to dominate in the TR-SFX experiments. The latter
show distinct phases in the evolution of the twisting C13=C14
retinal bond and long-range correlated dynamics preceding
ret-inal isomerization. We compare our comprehensive study with a
recently published related investigation
10.
Results
Spectroscopic characterization. When studying reactions by
spectroscopy and crystallography, one has to bear in mind that
reactions in solutions and crystals can differ due to effects of
crystal packing and/or differences in composition of the buffer
and crystallization mother liquor. Moreover, while spectroscopic
signatures are often highly specific for a certain molecular species,
allowing detection of even low concentration by difference
spectroscopy, this is not the case for crystallography. Therefore,
one tries to maximize intermediate state occupancy by adjusting
experimental parameters. In case of light-triggered reactions, one
typically aims at 1 photon per chromophore. Owing to the
sig-nificantly higher protein concentrations in crystals than in
solu-tions, this translates into use of much higher pump laser
intensities for time-resolved crystallographic experiments than for
spectroscopic ones. In particular, the use of intense ultrafast
optical pump pulses can entail a number of undesired
multi-photon effects. For these reasons, we performed ultrafast TA
spectroscopy
11on both bR in purple membranes (PMs) and
microcrystals (Fig.
1
b, c). In both cases, we observe the sub-ps
decay of the S
1state (visible by the loss of stimulated emission
and excited-state absorption (ESA)) that gives rise to the
photo-product. Additional relaxation dynamics occur on the picosecond
timescale. Global exponential
fitting results in time constants of
a
b
c
All-trans retinal 13-cis retinal
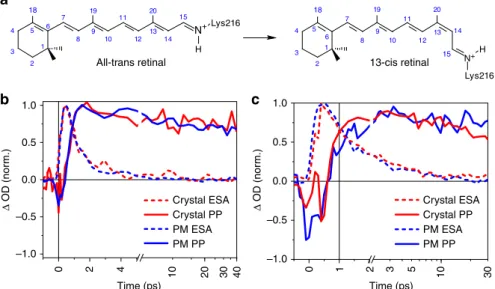
Time (ps) Time (ps) Δ OD (nor m.) Δ OD (nor m.) 1.0 0.5 0.0 –0.5 –1.0 0 6 1 5 2 4 3 7 8 9 10 11 12 13 14 15 19 20 N+ H Lys216 18 6 1 5 2 4 3 7 8 9 10 11 12 13 14 19 20 15 N+ Lys216 H 18 1.0 0.5 0.0 –0.5 –1.0 0 2 4 10 20 30 40 Crystal ESA Crystal PP PM ESA PM PP Crystal ESA Crystal PP PM ESA PM PP 10 1 2 3 5 30
Fig. 1 Retinal isomerization kinetics in purple membrane and bacteriorhodopsin (bR) microcrystals. a Schematic all-trans and 13-cis retinal covalently bound to Lys216 as a protonated Schiff base.b, c Direct comparison of kinetic traces in the ultraviolet/visible region for purple membrane (PM, blue) in H2O, pH = 5.6, and the bR microcrystals in lipidic cubic phase (red) as a function of peak intensities, 35 and 88 GW cm−2, respectively. Within the present signal-to-noise ratio, the dynamics of 13-cis isomer formation (PP, probe wavelength 670 ± 5nm, solid lines) and excited-state decay (excited-state
absorption (ESA), 480 ± 5 nm, dashed) are identical. See Supplementary Fig. 5 for a complete comparison as a function of excitation density. Source data are provided for Fig.1b, c as a Source Datafile
0.5–0.8 and 2.9 ps for PMs and of 0.6–0.8 and 2.8 ps for the
microcrystals, respectively, with increased S
1lifetimes observed
for intensities >35 GW cm
−2(Fig.
1
c). We conclude that bR
reacts similarly on the ultrafast timescale in PMs and in crystals.
High excitation power density is known to influence the
ultrafast dynamics and spectra of bR
12–15. At low excitation
density (0.3 photon per retinal), the time courses of
fluorescence
emission spectra of bR exhibit a biphasic behaviour (τ < 0.15 ps, τ
~ 0.45 ps)
12. At high excitation density (40 photons per retinal),
the amplitude of the fast component increases strongly and the
time constant of the slower component increases from ~0.45 to
~0.7 ps
12. Moreover, a red shift of the visible product absorption
spectrum of bR was identified upon increasing the pump intensity
beyond the linear regime of <100 GW cm
−213,15. Therefore, we
performed a power titration, varying intensities from 12 to 180
GW cm
−2(max. available laser power) and compared bR
transient dynamics in microcrystals and PMs in the VIS and in
the mid-IR range (Fig.
2
). Our
findings match qualitatively the
published non-linear spectral and temporal features
(Supplemen-tary Figs. 1–5). In the entire intensity range, we observe
photoproduct formation upon retinal isomerization tracked by
the product absorption around 630–680 nm (see Fig.
2
a). As
expected
12, the isomerization time increases for the highest
excitation intensities to 0.7 ± 0.1 ps, and a transient red-shift of
the induced absorption band up to 670 nm is observed at 15 ps
(Fig.
2
a), which decays on a
≈15 ps timescale and leaves this band
maximum at 650 nm (Supplementary Fig. 4d), forming the
quasi-static 13-cis/all-trans difference spectrum. The spectral position of
the 0.5–0.7 ps ESA in the visible range does not change, but an
additional ESA band at 465 nm is observed (Fig.
2
a). All these
features are also observed in the time-resolved absorption spectra
of microcrystals, though with significantly reduced
signal-to-noise ratio (SNR) due to increased pump laser scattering
(Supplementary Fig. 2). These high excitation-induced spectral
features have a 15–20 ps lifetime (Fig.
2
b), which is in line with
the previously reported lifetime of tryptophan emission under
multiphoton conditions
16. In addition, their spectral positions,
465 and 670 nm, are consistent with ESA bands observed for
tryptophan in water
17yet red-shifted due to the different polarity
of the protein environment.
The changes in vibrational absorption spectra in the linear power
range are depicted in Fig.
2
c. The mid-IR range shows, for t
≤ 0.5
ps, bleaching of the retinal C=C stretching vibration at 1527 cm
−1,
excited-state vibrations at 1480–1500 cm
−1and Trp bleaching
a
b
c
d
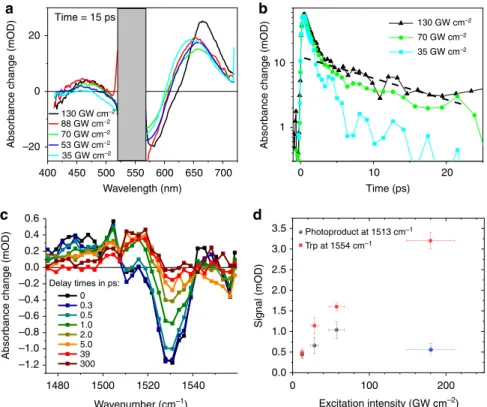
1480 Wavenumber (cm–1) Delay times in ps: 0 0.3 0.5 1.0 2.0 5.0 39 300Absorbance change (mOD)
0.6 0.4 0.2 0.0 –0.2 –0.4 –0.6 –0.8 –1.0 –1.2 Excitation intensity (GW cm–2) Signal (mOD) Photoproduct at 1513 cm–1 Trp at 1554 cm–1 3.5 3.0 2.5 2.0 1.5 1.0 0.5 0.0 130 GW cm–2 70 GW cm–2 35 GW cm–2 Time (ps) 0
Absorbance change (mOD)
10
1
Absorbance change (mOD)
400 Wavelength (nm) 20 0 –20 Time = 15 ps 1500 1520 1540 0 100 200 20 10 650 450 500 550 600 700 35 GW cm–2 130 GW cm–2 88 GW cm–2 70 GW cm–2 53 GW cm–2
Fig. 2 Power dependence of the photoreaction probed by transient absorption (TA) spectroscopy. a Ultraviolet/Visible TA spectra at 15 ps delay time in purple membranes. The 520–570 nm range (grey) is dominated by very strong pump light scatter. With increasing pump intensities, the photoproduct absorption band shifts to longer wavelengths (650–680 nm), and a long-lived weak absorption band appears peaking at ~460 nm. b Semi-log plot of kinetic traces at 463 nm, highlighting two decay components. For higher pump intensities, the dominant sub-picosecond excited-state absorption of the retinal protonated Schiff base increases slightly in duration, and a second smaller ~20 ps component appears (dashed line).c Isomerization dynamics tracked in the spectral range of the retinal C=C stretching vibration for different delay times. Excitation at 535 nm with 20 GW cm−2(or 0.5µJ). The retinal bleaching signal at 1527 and the excited state around 1480 cm−1are formed instantaneously. The rise of the J and K product signal is reflected by the signal increase around 1505 and 1513 cm−1, respectively.d Maximal signal of the isomerization product (red dots) tracked at 1513 cm−1as a function of excitation intensity (delay time 10–20 ps, see Supplementary Fig. 1) at 535 nm in the picosecond range; transients are shown in Supplementary Fig. 1a–e. At 180 GW cm−2, other signals overlap with the product band at 1513 cm−1, decreasing its intensity (blue dot), thus preventing its use to quantify photoproduct yield. The maximal negative signal of the picosecond tryptophan bleaching band (black squares) is also presented (delay time 2–5 ps, see Supplementary Fig. 1). All four measurements were performed under the same experimental conditions without changing the laser set-up, keeping the non-systematic errors small. The samples were taken from the same batch with nearly identical concentration (~1 optical density at 535 nm and 25µm thickness). Deviation from linearity occurs at about 30 GW cm−2. The errors of the absorption signals (y axis) were determined by the noise on the transients around the time point used to read out the signal strength. The intensity errors (x axis) are given by error propagation of the focal radius (strongest contribution), pulse length and pulse energy. Source data are provided for Fig.2a–d as a Source Data file
signal at 1554 cm
−1. For t
≥ 0.5 ps, photoproduct formation of J
from 1490 to 1510 cm
−1and K around 1515 cm
−1induces positive
signals. The photoproduct signal and Trp bleaching increase
linearly with excitation intensity up to ~30–60 GW cm
−2. For
higher intensities, the Trp signal shows a sub-linear dependence
(Fig.
2
d), while the photoproduct signal exhibits a strong decrease
due to newly emerging overlapping vibrational bands
(Supplemen-tary Fig. 1f). Notably, the Trp signal decays with a time constant of
~20 ps (Supplementary Fig. 1a–e), much like the Trp-related ESA
features identified in the UV/VIS range, and in agreement with the
fluorescence decay of Trps in bR upon sequential two-photon
excitation at 527 nm
16. At 180 GW cm
−2, an additional sub-ps
decay of the retinal C=C stretching vibration in the excited state at
1500 cm
−1is observed, indicating the onset of additional ultrafast
multiphoton effects (Supplementary Fig. 1f).
Most importantly, within the present SNR of the mid-IR data,
the decay of the Trp band does not seem to increase the
photoproduct
signal
around
1513 cm
−1(Supplementary
Fig. 1a–e), i.e. this sequential two-photon process appears to be
non-productive for photo-isomerization.
The Trp dynamics is slower in microcrystals compared to PMs
(Supplementary Fig. 2), but like in PMs, the mid-IR Trp
bleaching signal is observed for all excitation intensities,
indicating that the excited Trp and retinal are strongly coupled,
as shown previously
16. In contrast to the instantaneous retinal
bleaching signal at 1527 cm
−1, a significant part of the Trp
bleaching signal rises with a time constant of ~2 ps, indicating
Trp excited state cooling after a sequential two-photon absorption
process. The intensity range with negligible influence of the Trp
pathway is <~30 GW cm
−2corresponding to an average of less
than one photon per bR trimer (Supplementary Methods).
Nevertheless, even at 180 GW cm
−2, UV/VIS and mid-IR data
display the characteristic sub-ps isomerization time and
quasi-static K–bR difference spectra, attesting for isomerization even in
the multiphoton limit. Finally, no broad spectral signatures of
ionized water were observed between 1490 and 1570 cm
−1(Supplementary Fig. 6). Nonetheless, we cannot rule out
multi-photon ionization at higher pump intensities.
Quantum chemistry analysis of retinal interactions with the
protein. To investigate the electronic coupling between retinal
and protein in the excited state, we prepared a quantum
mechanical (QM) model of the active site consisting of the
lysine-bound retinal protonated Schiff base (RPSB), the aromatic triad
(Trp86, Trp182 and Tyr185) together with other six residues and
four water molecules, comprising the water cluster interacting
with the PSB (Fig.
3
a). The coupling of Tyr185 and Trp86 and the
RPSB in bR has been characterized previously by computational
studies revealing that charge transfer (CT) from these residues to
the retinal significantly compensates the blue shift of the retinal
absorption maximum, caused by the counterions
18, 19. Despite
this insight, the roles of Tyr185 and Trp86 in the excited-state
dynamics have not yet been addressed computationally.
Single-photon absorption populates the retinal S
1state (computed
energy 2.3 eV, Supplementary Table 1). Geometry relaxation of
the S
1retinal is dominated by bond-length alternation
(Supple-mentary Fig. 7), in agreement with previous reports
20. Moreover,
a decrease of the positive charge on the PSB drives relaxation of
hydrogen bonds, causing water W402 to shift. In contrast to
previous studies, we included the molecular orbitals of the donor
residues Tyr185 and Trp86 in the complete-active space wave
function expansion (Supplementary Fig. 8). This enabled us to
compute electronic states contributed by excitations from the
highest occupied molecular orbital (HOMO) of each donor to the
retinal lowest unoccupied molecular orbital (LUMO)—termed
here CT states CT(W86) and CT(Y185). The excited-state
minima corresponding to the two CT states were found on the
first excited-state potential energy surface (Supplementary Fig. 9).
Transfer of a complete negative charge from Tyr185 or Trp86 to
the retinal introduces a stronger CT character
20of the CT states
compared to the retinal S
1state (Fig.
3
b–d, Supplementary
Table 1). In line with this, geometry relaxation in the CT states
shows much larger changes in hydrogen bonds and the relative
orientation of the donors and retinal than in the S
1state
(Sup-plementary Fig. 7). The energies of the relaxed CT states are lower
than the retinal excitation energy but the energy gap to the
ground state is rather large, suggesting that the CT states
depopulate the FC region but do not provide de-excitation
pathways competing with retinal isomerization. Importantly, the
significant electronic coupling between the states (Supplementary
Fig. 9c) indicates that interconversion of the S
1and CT states
could influence the initial ultrafast excited-state dynamics. This
interconversion could correspond to the structurally observed
low-frequency oscillations of the relative positions of the retinal
and its neighbouring residues (i.e. the respective modes
corre-spond to the differences in the S
1and CT excited-state
geome-tries, Supplementary Fig. 7).
These newly identified excited states corresponding to
protein–retinal electron transfer can contribute to the observed
multiphoton-excitation dynamics. In particular, the sequential
two-photon process yielding excited Trp is a characteristic feature
of the strongly coupled retinal and Trp86 and can be associated
with photon absorption by either the retinal S
1state or the CT
(W86) radical pair (Fig.
4
, Supplementary Tables 2 and 3).
Indeed, the excited retinal S
3state (Fig.
4
b) and the excited
Trp86-radical D
2state of the CT(W86) manifold (Fig.
4
c) are
close in energy to the S
1state of Trp86. The Trp86 S
1state is
coupled more strongly to the CT states than to the excited states
of retinal (Supplementary Table 3), ruling out possible energy
transfer back to retinal. In line with this, our spectroscopic data
indicate that the excited-state relaxation of the Trp86 S
1state
occurs on the 10-ps timescale and does not increase the yield of
the 13-cis retinal. Further work is needed to characterize possible
conversion schemes after two-photon absorption.
Importantly, the identification and characterization of the CT
states extends the previous experimental work describing ultrafast
changes in Trp absorption by clarifying the origin of the
absorption features ascribed to Trp86
7, 21. In particular, the
observed GSB in the UV
7is consistent with the Trp86 S
1energy
of 4.24 eV in the ground-state model (Fig.
4
a), and the positive
signal
7can be attributed to the absorption of the polarized Trp86
at 3.25 eV (Fig.
4
b) or of the Trp86 radical cation at 3.75 eV
(Fig.
4
c). Furthermore, the computed D
0–D
2transition of the
Trp86 radical (Fig.
4
c) is in line with the experimental Trp radical
absorption >500 nm
22–24. Finally, the calculated Trp86 S
1–S
3transition may correspond to the transient two-photon induced
660–680 nm ESA band described above. Structurally, the
two-photon Trp pathway is related to the same degrees of freedom as
the relaxation pathways induced by single-photon excitation.
Ultrafast serial femtosecond crystallography. Dark-adapted bR
exists as a ~50:50 mixture of all-trans and 13-cis retinal. Since
only all-trans retinal enters a functional photocycle related to
proton pumping, it is important to maximize its fraction.
Light-adapted bR contains up to 100% all-trans retinal. This
enrich-ment can be achieved by continuous illumination for several
seconds, followed by a brief incubation in darkness. We decided
against performing the light adaptation of bR microcrystals
off-line, i.e. prior to injector loading as described previously
25, since
section. Instead, we developed a protocol for on-line
pre-illumi-nation of the microcrystalline bR stream as it
flowed through our
high viscosity extrusion (HVE) injector
26. A fully defined “dark
zone” near the HVE exit allowed the crystals to return to the bR
ground state prior to being photoexcited with the optical pump
laser pulse. Pre-illumination increased the all-trans retinal
con-tent considerably, with compositions ranging from 65% to 80%
all-trans and from 35% to 20% 13-cis retinal, respectively,
com-pared to 45% all-trans and 55% 13-cis retinal in the
dark-adapted state.
TR-SFX data were collected at the coherent X-ray imaging
(CXI) instrument
27at the Linac Coherent Light Source (LCLS).
bR microcrystals embedded in a high viscosity stream were
injected in random orientations into the FEL beam. We employed
b
d
–0.1 aua
c
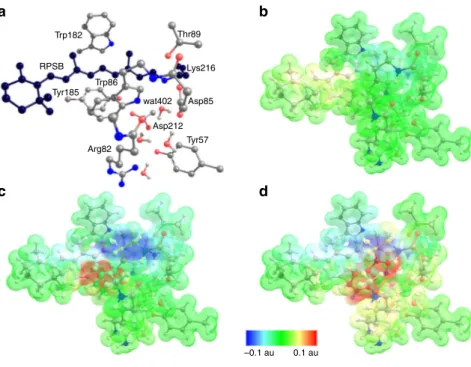
wat402 Trp182 RPSB Tyr185 Tyr57 Thr89 Lys216 Asp85 Arg82 Asp212 Trp86 0.1 auFig. 3 Electrostatic potential changes illustrate the charge-transfer (CT) character. The transitions S0–S1, S0–CT(Y185) and S0–CT(W86) are characterized. a Bacteriorhodopsin active-site cluster model (consisting of the 208 atoms in total). The carbon atoms of the retinal protonated Schiff base (RPSB)-Lys216 fragment are shown in black. Hydrogen atoms, except for the water molecules, are not shown.b The S0–S1transition corresponds to the excited retinal; c The S0–CT(Y185) and S0–CT(W86) (d) transitions correspond to CT involving Tyr185 and Trp86 as electron donors to RPSB. In the S0state, the protonated Schiff base is positively charged. All electronic transitions decrease this positive charge as apparent from the light blue patch of the electrostatic potential surface inb and dark blue patches in c, d. The positive charge moves to the ionone ring of retinal as shown by the yellow patch in b or to the electron donor (Trp86, Tyr185) as shown by a red patch inc, d. The charge separation in the active site is much larger for the S0–CT transitions than for the S0–S1transition (CS)S0 (Ret)S1 CT (W)S1 (CS)S0 (Ret)S1 (W)S1 (Ret)S1(W)S1 (Ret)S2 (Ret)S3 (CS)S0 CT (W)S1 (W)D2 (W)D1 (W)D3 (W)S2 (W)S3
a
b
c
2.24 4.24 1.02 2.03 3.25 2.00 2.56 1.22 2.29 3.75 2.35 (W)S2 (W)S3 0.00 0.00 0.00 4.06 2.73 –2.04 –1.31 2.19 2.96Fig. 4 Computed energies characterizing electronic coupling between retinal and Trp86. Solid arrows indicate retinal and Trp86 absorption; dashed arrows indicate absorption and emission of excited Trp86 populated by a sequential two-photon process. All computed energies and transition dipole moments (tdm) are presented in Supplementary Tables 2 and 3, respectively.a Transitions of the retinal and Trp86 corresponding to the light-adapted state of bacteriorhodopsin.b Transitions from the relaxed retinal S1state. Absorption of a second photon may populate the retinal S3state at 2.03 eV (tdm= 5.37 au) coupled to the excited Trp86 (W)S1state at 2.0 eV (tdm= 0.15 au). c Transitions from the relaxed CT state. Photon absorption populates the excited Trp86 radical state (W)D2at 2.29 eV (tdm= 1.00 au) coupled to the excited Trp86 (W)S1state at 2.35 eV (tdm= 0.45 au)
a pump–probe SFX data collection scheme. The stream velocity
was adjusted (and controlled regularly) to ensure clearing of any
illuminated material out of the FEL interaction zone before the
next pump–probe cycle started. To help with this, the optical laser
beam (99 µm 1/e
2) was moved 25 ± 5 µm downstream of the
X-ray focus. Photoexcitation was performed in a multiphoton
regime. The time delays between the optical laser
flash (145 fs,
532 nm, 5.9 µJ, ~500 GW cm
−2in the interaction region, see
“Methods” section) and the probing XFEL pulse were nominally
0.5, 1, 3 and 10 ps and 33 ms. Data from the nominally 0.5-ps
delay were binned into 12 groups according to their actual time
delay covering 0.24–0.74 ps (Supplementary Methods). For
comparison, we also collected data of the dark state. The 33-ms
time-delay data set, corresponding to an M-like intermediate, was
collected to check whether the short-lived intermediates can
advance along the bR photocycle.
Data quality and analysis. Diffraction and optical experiments
have opposing demands on sample thickness. While large bR
crystals diffract to significantly higher resolution than smaller
ones, they cannot be photoexcited efficiently (1/e penetration
depth at 532 nm is ~3.5 µm). As a compromise, we used bR
microcrystals of 20–30 × 20–30 × 2–3 µm
3. This corresponds to
an average path length of ~5.9 µm through the crystals
(Supple-mentary Methods). The crystals yielded 1.8 Å resolution SFX data
(Supplementary Table 4). Analysis of electron density maps
cal-culated from extrapolated structure factors with varying
occu-pancy of the pumped state yielded an occuoccu-pancy of ~15% for the
sub-ps and 1 ps data (10% for 3, 10 ps) (Supplementary
Meth-ods). For the sub-ps and 1 ps data sets, we observe differences
with respect to the dark-state structure after refinement against
extrapolated structure factors. For the 3- and 10-ps data sets,
changes of the torsion of the C13=C14 bond in the chromophore
are apparent in both structure factor amplitude difference Fourier
maps and extrapolated maps (Fig.
5
a–f). Crystallographic
statis-tics are shown in Supplementary Table 4. To estimate the
uncertainties in the torsion angles and atom–atom distances, we
used a jackknife-type method as described in Supplementary
Methods. For the uncertainty in the time delays, we used the
standard deviation of the time delays present in each data set. The
temporal binning of the diffraction images into a series of data
sets with distinct average time delays results in electron densities
that correspond to the weighted average of the individual
con-formations present at the actual time delays being binned. Thus
the amplitudes of the structural displacements are weighted with
a binning function. In case of a known temporal dependence of
the structural changes (oscillatory), the effect of binning can be
addressed computationally (see Supplementary Methods). This
results in changes of the magnitude of the measured
displace-ments in particular of the early and late sub-ps time points.
To assess the information content of the extrapolated electron
density maps and to obtain information on the time course of
events, we performed singular value decomposition
28,29on the
extrapolated maps for the 12 sub-ps time points as described in
detail in Supplementary Methods. The
first and strongest
contribution corresponds to the average of the 12 maps. The
other contributions, 2–12, are far smaller, with contributions 2–5
probably containing signal and number 6–12 probably mainly
containing noise (Supplementary Fig. 10a). As expected, the time
evolution of the
first contribution, the average, is virtually
constant with time. The time course of the second contribution is
reminescent of a step function, centred at ~0.5 ps, and that of the
third is Gaussian-like, centred also at ~0.5 ps (Supplementary
Fig. 10b). The second contribution shows the distortion at the
C13-C14 bond described below, and the third displays
“bending”
of the retinal. While these contributions by themselves should on
no account be interpreted as separate species, modes or events,
these results do establish that a major change occurs in the retinal
structure at around 0.5 ps.
Changes in the retinal. In the dark state (Figs.
1
a and
6
a), the
polyene chain of all-trans retinal is largely planar (C6-C13) with a
slightly pre-twisted C13=C14 double bond when no planarity for
the atoms around this bond is enforced during refinement
(tor-sion angle
−150°, “dark-unrestrained” structure), in line with
computational work (−160°)
20. Within the
first time point of
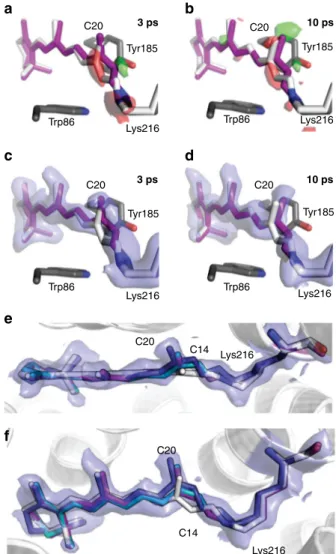
C20 C20 C20 C20 Tyr185 Tyr185 Tyr185 Tyr185 3 ps Trp86 Trp86 Trp86 Trp86 Lys216 Lys216 Lys216 Lys216 3 ps 10 ps 10 ps C20 C20 C14 C14 Lys216 Lys216
a
b
e
c
d
f
Fig. 5 Structure of the retinal in bacteriorhodopsin on the ps timescale. a View along retinal at time delays of 3 ps (a, c) and 10 ps (b, d); the retinal is shown in purple and the dark-state structure as white sticks. Extrapolated electron difference maps (green,+3σ and red, −3σ) show clear deviations from the dark-state structure at the C20 methyl group as well as around the C13=C14 bond. Both the C20 methyl group and the C14 atom shift towards residue Tyr185 (shown as grey sticks). The 10-ps structure was refined using geometric parameters from a quantum mechanical (QM)-optimized model resulting in a−68˚ torsion angle, corresponding to a twisted 13-cis conformation of retinal. e, f Overlay of the unrefined QM model of the 10-ps time point with the electron density, the top view (e) and side view (f) of the retinal binding pocket are shown. Retinal dark state, 10 ps structure refined with the QM model, unrefined QM model and 10 ps structure from Nogly et al.10are shown as white, purple, teal and deep blue sticks, respectively. Extrapolated electron density of the 10-ps time point is contoured at 1σ
0.24 ps, the C9=C10 bond also distorts and undulates on the
sub-ps timescale, while the C13=C14 bond torsion mostly progresses.
The largest displacements, in opposite directions, are at atoms
C14 and C10, while C8 undergoes minor distortion in the same
direction as C10. Like all other features describing the
photoexcited retinal, the torsion angles are apparent values that
describe the average conformation of any process contributing to
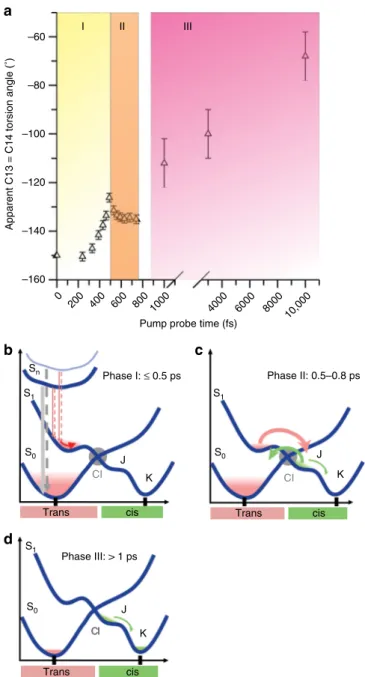
retinal isomerization. The temporal evolution of the apparent
C13=C14 dihedral angle can be separated in three distinct
pha-ses: 0–~500 fs (I), ~500–750 fs (II), 1–10 ps (III) (Fig.
7
). In the
single-photon regime, the excited state relaxes on the potential
energy surface (the I state) followed by appearance of the J state
with a vibrationally excited 13-cis conformation delayed by
∼150
fs relative to time zero and a subsequent rise time of 450 fs
6,30. In
parallel with the ps rise of K state, the all-trans ground state is
repopulated (see Fig.
2
c and Supplementary Fig. 1b). The J to K
transition induces geometric changes, such as torsional
relaxa-tion, reduction of conformational heterogeneity and vibrational
cooling
30.
In the present multiphoton regime, i.e. beyond the two-photon
regime characterized by the spectroscopic data (≤180 GW cm
−2),
the situation most likely involves population of several all-trans
excited states S
nfollowed by ultrafast multi-path electronic
relaxation (≤0.5 ps, phase I, Fig.
7
a, b) leading to hot populations
in S
0and S
1, with distorted retinal conformations and longer
vibrational relaxation times on the electronic excited potential
energy surface, compared to the single-photon regime. In phase II
(Fig.
7
a, c), the excited-state decays and transitions to the 13-cis J
state and hot all-trans ground state take place. However, in this
multiphoton regime, the hot all-trans ground state may be
accessed through additional internal conversion pathways from
the hot excited state or hot J state. Indeed, such additional
non-reactive channels would be consistent with the low occupancy of
isomerized retinal and the reported reduction of the
isomeriza-tion quantum yield in the high excitaisomeriza-tion regime
14. The existence
of structurally non-characterized multiphoton ionized species
cannot be excluded and would equally contribute to a reduced
quantum yield. Nevertheless, the majority population relaxes into
the all-trans ground state with large vibrational excess energy,
with an average dihedral angle close to the geometry of
unpumped all-trans retinal. Hence, in phase II (0.5–0.75 ps,
Fig.
7
a, c), the small reduction of the dihedral angle is interpreted
as a combination of hot 13-cis J state formation and effective
back-reaction to the hot all-trans ground state. This is followed by
a slower phase (ps, III, exponential, Fig.
7
a, d) reflecting J to K
transition and K state relaxation, accompanied by reduction of
conformational heterogeneity and cooling of the 13-cis product.
Vibrational relaxation is significantly longer for multiphoton
excitation due to increased excess energy.
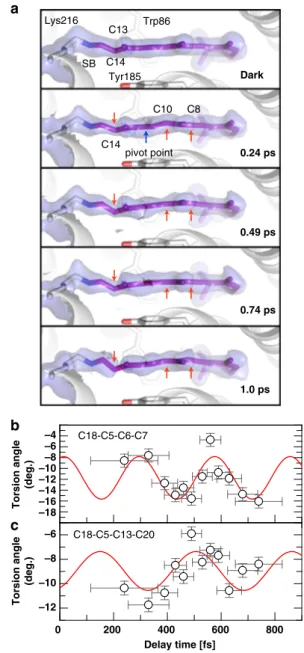
Local distortion between the
β-ionone ring and the polyene
chain is manifested by the oscillation of the torsion angle
C18-C5=C6-C7 at a frequency of ~120 cm
−1(Fig.
6
b). Globally,
skeletal torsion is apparent from e.g. oscillations of the torsion
angle between terminal methyl groups (C18 and C20; angle
C18-C5-C13-C20) of ~90 cm
−1(Fig.
6
c). The C12-C13=C14-C15
torsion angle changes from
−150° to −135° during 0.24–0.74 ps
and refined to −112° at 1 ps and −100° at 3 ps (Supplementary
Table 5). The 10 ps data are too weak to be refined based solely on
the electron density. Therefore, we started the refinement using
geometric parameters provided by our QM-optimized model (10
ps, torsion angle
−41°) which resulted in an angle of −68°.
However, the density can also very well accommodate the
unrefined QM model (Fig.
5
e, f).
Calculations have revealed that the isomerization mechanism
in bR comprises an aborted double bicycle–pedal motion,
involving a concurrent twisting conformation of three adjacent
double bonds C11=C12, C13=C14 and C15=N in alternate
directions (counter clockwise, clockwise, and counter clockwise,
respectively)
20. This proposal agrees qualitatively with our
observations in the multiphoton regime; however, we also note
differences. In our structures, the C11=C12 bond undergoes
C14 Dark 0.24 ps 0.49 ps 0.74 ps 1.0 ps C13 C10 Tyr185 Trp86 Lys216 SB Torsion angle (deg.) Delay time [fs] 0 200 400 600 800 Torsion angle (deg.) pivot pointa
C18-C5-C13-C20 C18-C5-C6-C7 –18 –16 –14 –12 –10 –8 –6 –4 –12 –10 –8 –6 C8 C14b
c
Fig. 6 Sub-ps effects of photon absorption on retinal. a Close-up of the retinal (purple sticks) in the dark-unrestrained state, as well as at 0.24, 0.49, 0.74 and 1 ps. Distortions from the initial planarity of the retinal occur within 0.24 ps and evolve further in time, especially at the Schiff base bond, at the C13=C14 bond and at the C10-C11 bond, while the C10 and C14 atoms move in opposite directions (red arrows, a blue arrow marks the pivot point) away and towards Tyr185 (shown as sticks), respectively. Minor torsion occurs also at C8. The electron density maps around the retinal (refined for the dark state, 15% extrapolated for the other panels) are contoured at 1.0σ. At 1 ps, the density for the C13=C14 bond is only visible at lower contour levels.b, c, The torsion angles between the β-ionone ring and the beginning (C18-C5=C6-C7 torsion angle, b) and end (C18-C5-C13-C20 torsion angle,c) of the polyene chain are plotted in time. The oscillatory modulation of the angles with frequencies of 119 ± -9 cm−1 (b) and 93 ± 14 cm−1(c) further visualize the twisting of the entire retinal. The error bars were derived as described in the Supplementary Methods. Source data are provided for Fig.6b, c as a Source Datafile
hardly any twisting, whereas the twisting of the C15=N double
bond is much more pronounced compared to the calculated
structures
20. This may be explained by the limited model used in
the QM calculations
20, which included—in addition to the retinal
PSB—only the terminal ε-carbon atom of Lys216. Therefore, all
torsional changes required for the isomerization can occur only in
this fragment. However, in our complete system, we see
substantial distortions in the lysine side chain, which has more
degrees of freedom to twist around its single bonds,
accom-modating the twisted retinal much more easily. We also see tilting
of the methyl group C20 towards Tyr185 during the
isomeriza-tion reacisomeriza-tion, with the distance between C20 and the hydroxyl
group of Tyr185 decreasing by ~0.5 Å at 10 ps (Fig.
5
c, d). Further
motion is likely limited sterically. Restricting the C20 motion
could be a means of the protein to stabilize the all-trans
configuration and restrain isomerization to only the C13=C14
double bond. Indeed, experiments on bR reconstituted with
13-demethylretinal showed that the protein contains predominantly
the 13-cis isomer and undergoes neither light–dark adaptation
nor a functional photocycle
31.
Ultrafast changes in the protein. The data also allow us to study
the sub-ps temporal evolution of the conformation of residues
surrounding the retinal (see Fig.
8
a). In the dark state, PSB forms
a hydrogen bond with Wat402 (2.8 Å). Upon photoexcitation of
the retinal, the PSB–Wat402 distance increases within 0.4 ps to
3.2 Å and oscillates in time with a frequency of ~80 cm
−1(Fig.
8
b), similar to the oscillation of the retinal skeletal torsions
and the Lys216
χ
4torsion angle (both ~90 cm
−1, Figs.
6
c and
8
c).
To accommodate the shifted Wat402, the carboxylate group of
Asp85 reorients within 0.24 ps; the Asp212
χ
2torsion angle as
well as distances between the carboxylate oxygen atoms of
Asp212 and Wat402 show an oscillatory behaviour (~80 cm
−1,
Fig.
8
d, e, Supplementary Fig. 11a). These displacements likely
cause the rearrangements of Wat401 and Wat406, propagating
the motion to Arg82 (Supplementary Fig. 11b) and to Glu194 and
Glu204: the distances between their carboxylate groups and
Wat403/Wat404, which are part of the proton release group on
the extracellular side
4, are modulated with frequencies of
~80–100 cm
−1(Fig.
8
f, Supplementary Fig. 11c–g).
In addition to the above oscillations of residues and waters
directly involved in the later proton translocation, we clearly
observe oscillations in the positions of residues lining the retinal
(Fig.
8
g–i and Supplementary Fig. 11h–j). These include Trp86
(χ
1and
χ
2oscillation period ~150 and ~125 cm
−1, respectively)
and Tyr185 (χ
1oscillation period about 80 cm
−1) as well as
Met118 and Met145 lying within 4 Å of the retinal. Met118
χ
2and
χ
3and Met145
χ
2oscillate with ~100, ~100 and ~90 cm
−1,
respectively. We also performed singular value decomposition
(SVD) on the maps using only a region within 5 Å around the
retinal. Here, too, the SVD analysis revealed oscillations with
frequencies of about 83 and 113 cm
−1, further supporting the
observed oscillations in the coordinates (Supplementary Table 6).
The magnitude of the damping time constants of the observed
oscillations can be estimated to several 100 fs by correcting the
amplitudes of the oscillations for the effects of binning as
described in
“Methods”. We then fitted an exponentially decaying
harmonic oscillation corrected for binning to the data. The
accuracy of this approach is limited by: (i) correcting the refined
amplitudes by effect of temporal binning will result in the lower
bound of the real amplitude (see
“Methods”), which affects the
initial estimate of the decay constant, and (ii) owing to limited
beamtime, we could only collect data for binned time points 0.24
ps
≤ Δt ≥ 0.74 ps covering not more than 1.5 oscillation cycles.
Nevertheless,
fitting a binning-corrected exponential decay to the
observed amplitudes, there is an indication that in most cases the
resulting damping constant is on the order of 0.2–0.3 ps
(Supplementary Fig. 12). However, owing to the limited data,
this value has to be considered with caution (see
“Methods”).
Whether or not these changes also occur in the single-photon
Pump probe time (fs)0 200 400 600 800 1000 –160 –140 –120 –100 –80 –60 4000 6000 8000 10,000 I II III
Apparent C13 = C14 torsion angle (˚)
a
Sn S1 S0 CI J K cis CI J K J K CI S1 S0 S1 S0b
d
Phase I: ≤ 0.5 ps Phase II: 0.5–0.8 ps
Trans cis Trans cis Trans Phase III: > 1 ps
c
Fig. 7 Temporal evolution of the apparent C13=C14 retinal torsion angle. The structural dynamics of the twisting bond can be divided into three distinct phases (a). b Thefirst (I, 0–~500 fs, yellow) reflects the initial torsional motion in S1after relaxation from multiphoton excited high energy states Snand internal conversion into S0.c During the second phase (II, ~500–750 fs, beige), the torsion angle decreases, indicating transition not only to the hot J state but also to a hot all-trans ground state. The small reduction of the dihedral angle is due to an average over the populated vibrationally hot distorted S1, the 13-cis J state and the all-trans ground state. The 0.5–0.8 ps timescale is consistent with the decay of the excited state (cf.“spectroscopic characterization”). This is followed by phase III (1–10 ps, pink,d) displaying the increase of the torsion angle, as expected for J and K state relaxation, ultimately yielding the relaxed 13-cis isomer of retinal. The error bars were derived as described in Supplementary Methods. Source data are provided for Fig.7a as a Source Datafile
excitation regime and are thus of functional relevance needs to be
tested by future experiments.
In any case, our data show torsional oscillations not only in
the retinal PSB (Fig.
6
) but also in the surrounding residues
and in their relative distances (Fig.
8
, Supplementary Fig. 11).
This suggests that the photoexcited retinal and its
neighbour-ing residues form a vibrationally coupled network. The
extent and direction of the conformational changes occurring
in the retinal and its surroundings are visualized and
summarized in Fig.
9
.
Comparison with published spectroscopic data. Retinal
iso-merization in bR in the high-intensity regime was studied by
Florean et al.
13who reported that photoproduct yield increases
approximately linearly well beyond the saturation of the initial
one-photon transition. This was disputed by Prokhorenko et al.
14who showed a monotonic decrease of the isomerization yield >80
GW cm
−2, which was attributed to nonradiative loss of the
excitation through re-excitation of the excited-state S
1to higher
excited states in the multiphoton regime. Such a re-excitation
is identified spectroscopically here in its simplest form in the
g
b
i
e
h
f
d
c
a
A Lys216 Met118 Tyr185 Trp86 Retinal PSB Asp212 sp85 Wat406 Wat401 Wat407 Glu204 Glu194 Wat404 Wat403 Arg82 Wat402Torsion ang. (deg.)
Torsion ang. (deg.)
Delay time [fs] Delay time [fs]
0 200 400 600 800
Torsion ang. (deg.)
0 200 400 600 800
Torsion ang. (deg.)
Lys216 χ4 Lys216/NZ-Wat402 Asp212 χ2 Asp212/OD2-Wat402 Glu194/OE2-Glu204/OE2 Trp86 χ2 Tyr185 χ1 Met118 χ2 3 3.1 3.2 3.3 56 58 60 62 64 –10 –8 –6 –4 –2 0 2.9 3 3.1 2.4 2.6 2.8 2.7 2.5 159 161 157 –178 –176 –174 –172 –78 –76 –74 –77 –75 Met145 Distance (Å) Distance (Å) Distance (Å)
regime of sequential two-photon excitation and by the onset of
sub-ps excited-state reduction for the highest pump intensities
(180 GW cm
−2).
Although our SFX data were obtained in the multiphoton
excitation regime, it is interesting to compare them to
spectro-scopic data obtained in the single-photon regime. As inferred
from vibrational spectroscopy
5,6,30,32,33and computations
8, the
photoinduced structural changes of retinal in bR involve ultrafast
intramolecular bond length alterations, launching C=C and C-C
stretching modes and out-of-plane and torsional degrees of
freedom. In line with these
findings, we experimentally observe
and computationally predict immediate changes along the entire
retinal PSB. The strongly bent retinal conformation observed on
the sub-ps timescale reflects torsional relaxation, expected in the
single-photon regime during the transition from the I to J
intermediate. It has been predicted that collective torsional
motions drive the population on the S
1potential energy surface
towards the conical intersection and thus induce isomerization
20.
Excited-state processes are accompanied by low-frequency
vibrational
coherences
(80–177 cm
−1)
detected
in
both
optical
34,35and impulsive vibrational spectroscopy
33,36,37. Most
importantly, and highlighting the role of the protein, they differ
between free and protein-bound retinal
35,37.
Discussion
Ultrafast time-resolved spectroscopic experiments have provided
unprecedented insight into the early events following photon
absorption of light-sensitive systems. Analogous SFX experiments
are only emerging, and while conceptually similar, there are
crucial differences between spectroscopic experiments on protein
solutions and SFX experiments on microcrystals. Typically, the
Trp189 Glu194 Trp138 Met145 Trp182 Thr178 Leu96 Lys216 Trp86 Arg82 wat5 wat3 wat1 D85 RET wat2 Tyr185 Tyr57 Asp85 Asp212 wat3 wat1 wat2 Trp86 Met145 Met118 Trp138 RET wat1 Trp138 Trp189 Glu194 Glu204 wat4 Tyr57 Asp212 Tyr185 Lys216 Leu96 Met118 Met145 Trp182 wat3 Arg82 wat5 ~ 90˚ ~ 90˚
Fig. 9 Ultrafast changes of residues and waters in the immediate vicinity of retinal. Selected residues from the dark“unpumped” structure are shown as sticks, with the retinal pigment coloured in dark blue; carbon atoms of surrounding residues coloured in shades of cyan and blue (N-terminal to C-terminal); and nitrogen, oxygen and sulfur atoms coloured in marine blue, red and yellow, respectively. Arrows indicate the movement of atoms on the fs timescale, with the magnitude of motions illustrated by the length of arrows (multipliedfive times). Arrows of different colours correspond to different pump–probe delays, with increasingly red-shaded arrows corresponding to longer pump–probe delays, in the 240–740-fs range
Fig. 8 Motions of the water network and surrounding residues on the sub-ps timescale. a View along the retinal chain towards the extracellular site. The dark-unrestrained state and 0.46 ps structures of retinal (purple and dark-salmon sticks, respectively), of selected side chains (white and dark grey sticks, resp.) and of water molecules (red and dark-salmon spheres, respectively) are superimposed. In the all-trans dark state, the protonated Schiff base (PSB) forms a hydrogen bond (HB) with Wat402 (2.8 Å), which is wedged between counter ions Asp85 (2.5 Å) and Asp212 (3.0 Å). These are part of an extensive network of HB extending to the extracellular side (EC) of the membrane. Upon photoexcitation, displacements of waters (Wat402, Wat401, Wat406, Wat403, Wat407 and Wat404) and HB-connected residues (Asp85, Asp212, Arg82, Glu194, Glu204) and nearby residues (Trp86, Tyr185, Met118) are observed.b–f Within the HB network, these displacements likely propagate from the PSB region towards the EC as coupled motions, as observed in the oscillatory modulations of torsion angles and distances within the network.b Upon photoexcitation of the retinal, the PSB–Wat402 distance initially increases within thefirst 0.4 ps to 3.2 Å and then seems to oscillate with time with a frequency of 80 ± 5 cm−1.c Oscillation of the Lys216 χ4torsion angle with a frequency (87 ± 6 cm−1) similar to the retinal skeletal oscillations (Fig.6c).d, e Asp212χ2angle and Asp212/OD2–Wat402 distance oscillation of 82 ± 6 and 80 ± 9 cm−1, respectively.f The distance of Glu194/OE2 and Glu204/OE2 undulates with a frequency of 104 ± 17 cm−1. g–i Residues lining the retinal cavity also show oscillatory modulation of their torsion angles with the following frequencies: Trp86 χ2(125 ± 9 cm−1,g), Tyr185χ1(81 ± 9 cm−1,h), Met118χ2(105 ± 12 cm−1,i). The error bars were derived as described in Supplementary Methods. Source data are provided for Fig.8b–i as a Source Data file
latter aim to maximize the occupancy of intermediate states. To
this end, a power titration should be performed to establish the
linear range of pump intensity increase on intermediate
occu-pancy. This, however, has not been done for the published
experiments due to paucity of XFEL beamtime. To date, all sub-ps
time-resolved optical pump X-ray probe SFX experiments
have used laser power densities of 360–500 GW cm
−210,29,38,39,
which results in far >1 photon per chromophore even if a safety
margin for potential pump laser drifts or scattering effects is
considered.
During the review of our manuscript, another study describing
a time-resolved SFX experiment on the ultrafast steps in retinal
isomerization in bR was published by Nogly et al.
10. In contrast to
our experiment, Nogly et al.
10performed light adaption offline,
photoexcited the sample at 30 Hz and collected the diffraction
data at 120 Hz (i.e. four X-ray pulses after each pump laser pulse,
see Supplementary Fig. 1A in Nogly et al., Supplementary
Table 7). Importantly, the same pump laser
flash was used for two
data sets: crystals illuminated at position x
0were probed by the
first XFEL pulse after (sub)-ps time delays; crystals illuminated at
position x
1further upstream in the lipidic cubic phase (LCP)
stream and reaching the interaction zone 8.3 ms after the
first
X-ray pulse were probed by the second XFEL pulse (Supplementary
Fig. 13). The second data set corresponds to an M-like
inter-mediate with 10% occupancy, compared to 16% for the 10 ps
time-delay intermediate
10. Assuming single-photon excitation, as
stated by the authors, this implies that the photon intensity at
position x
1is ~60% of that at position x
0.However, this high
intensity is very difficult to reconcile with the reported
illumi-nation geometry (see Supplementary Fig. 13, Supplementary
Table 7). The power of the pump laser is 11% of the peak power
at x
0but negligible at x
1. Since this is incompatible with any
photoexcitation at x
1, it is very difficult to assess the experimental
description including the pump laser power density used in the
Nogly et al. experiment
10. Similarly, a reduction of the incident
laser light by 80% due to scattering at the LCP jet was stated, but
no experimental details or data were provided
10. This value does
not agree with our
findings (20% of light is scattered by the LCP
jet itself and the embedded crystals, Supplementary Note 1) and is
most likely a lensing effect due to the cylindric jet. Despite these
many experimental inconsistencies, if one assumes a 50-µm
dis-placement of the pump laser
10, the two studies used a comparable
pump power density of ~500–600 GW cm
−2, resulting in
multi-photon excitation (Supplementary Table 7). This contradicts the
assessment of Nogly et al.
10of being in the single-photon
exci-tation regime.
Nogly et al.
10collected significantly more data at higher spatial
resolution (1.5–2.0 Å) that allowed binning with much shorter
temporal (~120 fs) spacing. Interestingly, as in our case, negative
difference densities are much stronger than the corresponding
positive densities, indicating significant disorder of the developing
states compared to the initial state. This effect is expected in
multiphoton processes in which there will be a distribution of
potential energy surfaces explored in the relaxation process.
Moreover, multiphoton ionization may result in electrons being
trapped at polar sites, resulting in further disordering. Peak
heights of 18 difference electron densities were listed as a function
of time, however, without describing and depositing the
corre-sponding structures and data, respectively. While difficult to
compare, some of temporal changes in peak height are
reminis-cent of the structural oscillations we describe here, with periods of
300–400 fs (e.g. torsion angle C20-C13-C5-C18 Fig.
6
c versus
Supplementary Fig. 20
10). Qualitatively, the structural changes of
retinal and the surrounding water network seem to be similar to
what we observe. In general, the changes reported by Nogly
et al.
10are larger than the ones that we observe (see Fig.
10
for the
counter-ion H-bonding network). In particular, we do not
observe a protein quake
10. It is unclear whether this is due to the
lower resolution and SNR of our data, differences in refinement
protocols or photoexcitation or a combination thereof. In this
context, it is interesting to note that increasing the pump laser
power above a value where complete photolysis was attained
resulted in larger displacements in photolysed carbonmonoxy
myoglobin
38. A quake-like motion of the protein occurring
within ps after multiphoton excitation (800 photons per
chro-mophore) was described for the photosynthetic reaction centre
40.
Protein quakes have been proposed as a means to quickly
dis-sipate energy. However, other relaxations channels exist, such as
intramolecular vibrational energy redistribution and vibrational
cooling.
Since it is known that high photoexcitation intensity influences
the excited-state spectra and dynamics of bR
12–15, we investigated
the impact of high photoexcitation power on the bR photocycle
and dynamics in PMs and bR microcrystals by a spectroscopic
power titration. Ultrafast TA spectroscopy in the UV/VIS and
mid-IR reveals red-shifted absorption signals due to transitions to
higher excited states above ~30 GW cm
−2or above one photon
per bR trimer. Our quantum chemical calculations indicate that a
sequential two-photon absorption process populating the Trp
excited-state manifold (Fig.
4
) could be the cause for the observed
and previously reported
12–14red-shifts in the visible spectral
range and the bleaching of Trp vibrational bands (Fig.
2
). On this
basis, we ascribe the intensity-dependent changes of the
photo-product region around 630–650 nm and the long-lived 460 nm
ESA at least partially to the sequential two-photon absorption
process populating the excited state most probably of Trp86. The
relaxation dynamics in the Trp excited-state manifold takes place
on a timescale of tens of ps, without producing additional 13-cis
photoproduct (Supplementary Fig. 1a–e). Other multiphoton
processes on the sub-ps timescale alter the retinal excited-state
dynamics (Supplementary Fig. 1f) without significant influence
on the 13-cis isomer formation time.
The insight gained from the spectroscopic experiments cannot
be applied directly to the SFX experiments, since the latter were
performed at much higher pump laser intensity. There we
observe three distinct phases in the evolution of the apparent
C13=C14 torsion angle following multiphoton excitation of
ret-inal, likely reflecting the fast decay of different highly excited
species with a distribution of rate constants to very hot S
1and S
0states (I and II, respectively, in Fig.
7
), with only the former
contributing to formation of the 13-cis isomer (III, Fig.
7
). Again,
multiphoton-induced ionization cannot be excluded. Under these
conditions, we not only observe sub-ps and ps structural changes
in the retinal but also in surrounding protein residues and water
molecules. These include damped oscillations of torsional angles
in retinal and surrounding amino acids as well as oscillations in
interaction distances. While we can only give a tentative
first
interpretation of the effects of multiphoton excitation on retinal
isomerization and thus on the oscillations, their presence and
similarity with those observed for retinal in one-photon excited
transient spectroscopy is remarkable. Most important is the
previously undescribed observation of oscillations of nearby
amino acids under multiphoton excitation, which require an
impulsive triggering most likely due to the sub-50 fs dipole
polarization of excited-state retinal
7. These rapidly damped but
coherent oscillations at these low-energy eigenfrequencies are a
manifestation of a robust and strong vibrational coupling of
retinal and its environment. It is conceivable that these
eigen-frequencies are also activated in the single-photon regime. Finally,
the similarity of the structures of the M-like intermediate
deter-mined from data collected at 33 ms and the M-like intermediate
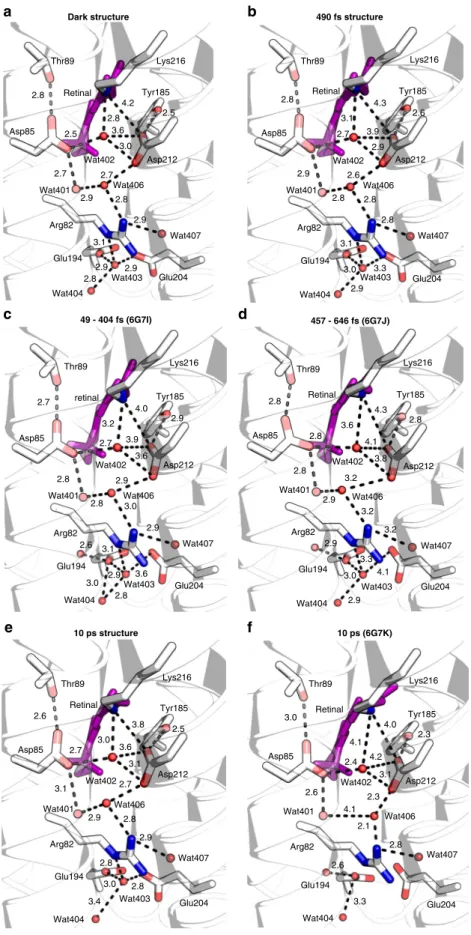
2.9 3.1 2.9 2.8 Wat404 Glu194 Glu204 Arg82 Wat401 Wat406 Wat407 2.9 2.8 Asp85 2.5 2.7 2.9 Asp212 2.5 Tyr185 3.6 2.7 2.8 Wat402 Retinal Lys216 2.8 Thr89 3.0 3.1 3.3 2.9 Wat404 Glu194 Glu204 Arg82 Wat401 Wat406 Wat407 2.8 2.8 Asp85 2.7 2.9 2.8 Asp212 2.6 Tyr185 3.9 2.6 3.1 2.9 Wat402 Wat403 4.3 Retinal Lys216 2.8 Thr89 3.6 2.9 2.6 2.8 3.0 3.1 Wat403 Wat404 Glu194 Glu204 Arg82 Wat406 Wat407 2.9 Asp85 2.7 2.8 3.0 Asp212 2.9 Tyr185 3.9 2.9 3.2 4.0 Wat402 3.6 2.8 retinal Lys216 2.7 Thr89 4.1 3.0 2.9 2.9 3.3 Wat403 Wat404 Glu194 Glu204 Arg82 Wat406 Wat407 3.2 Asp85 2.8 2.8 3.2 Asp212 2.8 Tyr185 4.1 3.2 3.6 4.3 Wat402 3.8 2.9 Retinal Lys216 2.8 Thr89 2.8 3.0 2.8 3.4 Wat404 Glu194 Glu204 Arg82 Wat401 Wat406 Wat407 2.9 2.8 Asp85 2.7 3.1 2.9 Asp212 2.5 Tyr185 3.6 2.7 3.0 3.8 Wat402 3.1 Retinal Lys216 2.6 Thr89 2.6 3.3 Wat404 Glu194 Glu204 Arg82 Wat401 Wat406 Wat407 2.8 Asp85 2.4 2.6 2.1 Asp212 2.3 Tyr185 4.2 2.3 4.1 4.0 Wat402 3.1 4.1 Retinal Lys216 3.0 Thr89 Wat403 Wat403 4.2 3.0 Wat401 Wat401
a
b
c
d
e
f
Dark structure 490 fs structure
49 - 404 fs (6G7I) 457 - 646 fs (6G7J)
10 ps structure 10 ps (6G7K)
Fig. 10 Evolution of distances between residues and waters along the proton pathway in time. Retinal is shown in pink and waters as red spheres. Distances are given in Å.a Dark-unrestrained structure. b The 490 fs structure. c The 49–404 fs structure from Nogly et al.10(6G7I).d The 457–646 fs structure from Nogly et al.10(6G7J).e The 10 ps structure. f The 10 ps structure from Nogly et al.10(6G7K). While similar changes in the H-bonding network occur in both studies, the elongation of the retinal protonated Schiff base and water 402 distance is much more pronounced in the Nogly et al.10work, as well as a disorder of water 401 and 406