HAL Id: insu-00558975
https://hal-insu.archives-ouvertes.fr/insu-00558975
Submitted on 15 Aug 2011
HAL is a multi-disciplinary open access
archive for the deposit and dissemination of
sci-entific research documents, whether they are
pub-lished or not. The documents may come from
teaching and research institutions in France or
abroad, or from public or private research centers.
L’archive ouverte pluridisciplinaire HAL, est
destinée au dépôt et à la diffusion de documents
scientifiques de niveau recherche, publiés ou non,
émanant des établissements d’enseignement et de
recherche français ou étrangers, des laboratoires
publics ou privés.
of Aden, Republic of Djibouti
Mohamed Daoud, Bernard Le Gall, René Maury, Joël Rolet, Philippe Huchon,
Hervé Guillou
To cite this version:
Mohamed Daoud, Bernard Le Gall, René Maury, Joël Rolet, Philippe Huchon, et al.. Young rift
kinematics in the Tadjoura rift, western Gulf of Aden, Republic of Djibouti. Tectonics, American
Geophysical Union (AGU), 2011, 30, pp.TC1002. �10.1029/2009TC002614�. �insu-00558975�
Young rift kinematics in the Tadjoura rift, western Gulf of Aden,
Republic of Djibouti
Mohamed A. Daoud,
1,2Bernard Le Gall,
2René C. Maury,
2Joël Rolet,
2Philippe Huchon,
3and Hervé Guillou
4Received 23 September 2009; revised 30 June 2010; accepted 14 September 2010; published 11 January 2011. [1]
The Tadjoura rift forms the westernmost edge of the
westerly propagating Sheba ridge, between Arabia and
Somalia, as it enters into the Afar depression. From
struc-tural and remote sensing data sets, the Tadjoura rift is
interpreted as an asymmetrical south facing half
‐graben,
about 40 km wide, dominated by a large boundary fault
zone to the north. It is partially filled up by the 1–3 Myr
old Gulf Basalts which onlapped the older Somali
Basalts along its shallower southern flexural margin.
The major and trace element analysis of 78 young
onshore lavas allows us to distinguish and map four
dis-tinct basaltic types, namely the Gulf, Somali, Goumarre,
and Hayyabley Basalts. These results, together with
radiometric age data, lead us to propose a revised
volca-no
‐stratigraphic sketch of the two exposed Tadjoura rift
margins and to discriminate and date several distinct fault
networks of this oblique rift. Morphological and
statisti-cal analyses of onshore extensional fault populations
show marked changes in structural styles along
‐strike,
in a direction parallel to the rift axis. These major fault
disturbances are assigned to the arrest of axial fault tip
propagation against preexisting discontinuities in the
NS‐oriented Arta transverse zone. According to our
model, the sinistral jump of rifting into the Asal
‐Ghoubbet
rift segment results from structural inheritance, in contrast
with the en échelon or transform mechanism of
propaga-tion that prevailed along the entire length of the Gulf
of Aden extensional system.
Citation: Daoud, M. A.,B. Le Gall, R. C. Maury, J. Rolet, P. Huchon, and H. Guillou (2011), Young rift kinematics in the Tadjoura rift, western Gulf of Aden, Republic of Djibouti, Tectonics, 30, TC1002,
doi:10.1029/2009TC002614.
1. Introduction
[2] The overall architecture of rift/ridge systems is
con-trolled by several physical parameters which interact at
various scales of times and space, and usually lead to intricate geometrical configurations. The large‐scale spatial architecture of a propagating rift is known to depend merely on the absolute motions of the bounding plates, and on major lateral discontinuities in the strength of either the upper crust (e.g., inherited structures), or the lower crust (e.g., partial melt zones) [Ziegler and Cloetingh, 2004; Wijns et al., 2005]. At a smaller scale, the segmentation of the spreading axis within the rifted zone itself is commonly assigned to (1) its obliquity to the extension direction and (2) the angle between the axis of individual rift segments and the general trend of the rifted zone [Abelson and Agnon, 1997]. The resulting complex multiscale rift architecture is typically expressed along the Sheba westerly propagating rift‐drift system (Eastern Afar) by two nearly orthogonal first‐order arms that, in turn, display specific segmented axial patterns (Figures 1a and 1b). Along most of its EW trending path, the Sheba oceanic ridge is sys-tematically offset to the southwest. This offset occurs through either a left stepping ridge‐transform network (up to the Shukra El Sheikh discontinuity [e.g., Manighetti et al., 1997]) or oblique transfer zones with onlapping fault networks, up to the Tadjoura rift (TR) to the west (Figure 1b) [Cochran, 1981; Tamsett and Searle, 1988; Manighetti et al., 1997; Dauteuil et al., 2001]. There, the nearly EW trending axis veers abruptly counterclockwise into the N120°E‐oriented Ghoubbet rift, which is part of a submeridian, and partly emerged, rifted zone encompassing to the north the Asal and Manda Inakir en échelon subrifts (Figure 1b) [Manighetti et al., 1998]. The structural link between the two suborthogonal rift arms in the TR has been variously interpreted, and assigned to either a large‐ scale dextral fault zone, in the prolongation of the NE‐SW Maskali transform fault (Figure 1b) [Ruegg et al., 1980; Arthaud et al., 1980; Gaulier and Huchon, 1991], or to an overlapping fault zone enclosing a network of en échelon structures (Figure 1d) [Manighetti et al., 1997].
[3] The main goal of the present work is to address the
mechanism of strain transfer between the Tadjoura and Ghoubbet rifts, with emphasis on the structure of the TR. Our study integrates (1) available seismic and bathymetric offshore data; (2) sampling, geochemical analysis and K/Ar dating of young basalts from the Djibouti Plain, which lead us to propose a new geological map of the southern part of the TR; and (3) structural analyses based on field studies and remote sensing interpretation. These new data allow us to demonstrate that the TR typically displays a half‐graben structure, which recorded a progressive shift of strain toward its inner part during the last 3 Myr. In addition, we propose
1
Institut des Sciences de la Terre, Centre d’Études et de Recherches de Djibouti, Djibouti Ville, Djibouti.
2
Université Européenne de Bretagne, Université de Brest, CNRS, UMR 6538 Domaines Océaniques, IUEM, Plouzané, France.
3UPMC Université de Paris 6, CNRS, UMR 7193, ISTeP, Paris, France. 4
UMR 1572, LSCE/CEA‐CNRS, Domaine du CNRS, Gif‐sur‐Yvette, France.
Copyright 2011 by the American Geophysical Union. 0278‐7407/11/2009TC002614
Figure 1. Various types of rift segmentation along the Gulf of Aden plate boundar y between Arabia and Somalia. The activ e E W trend ing Gulf of Aden (She ba) rift ‐drif t syst em evolv es wes tward into the subor thogon al Ghou bbet ‐Asal and Man da In aki r rif ts. (a ) P la te ki ne mat ic se tti ng of th e A fa r T ri p le Ju n ctio n. Th ick ar row s re p re se n t pla te mot io n v ec tors , and the box indi cates the study area . (b) Main phy siogr aphic featu res of the wes tern Gulf of Aden rift syst em, modi fied from Manighetti et al. [1997]. The revised spatial extent of onshore Gulf Basalts, as well as the Arta transverse zone (shown as the white NS domain centered on the Arta locality), are shown. (c) Aeromagnetic map of the Tadjoura Gulf, from Manighetti et al. [1997], with modified onshore parts. Dashed lines (D 1– 8 ) represent transform faults offsetting magnetic segments. Numbers refer to specific magnetic anomalies. (d) “Overlapping subrift ” model developed by Manighetti et al. [1997] to account for the relationships between the Tadjoura and Ghoubbet rifts. The inner floors of the rifts are shaded.
that submeridian structural discontinuities, emplaced at an early stage of rifting in the Arta transverse zone (Figure 1b) may have locked the westerly propagation of extension in the TR, hence causing the jump of rift axis southwestward into the Ghoubbet subrift.
2. Methodology
[4] The 3‐D structure of the TR was first investigated in
map view, and along selected cross sections, by merging onshore geology with existing offshore data, which include bathymetric maps [Audin, 1999; Dauteuil et al., 2001] and analog, single channel seismic reflection profiles acquired during the TADJOURADEN cruise in 1995. The offshore fault pattern extracted from the bathymetric contour maps has a relatively low horizontal resolution (150 m) which does not permit quantitative comparisons with onshore fault parameters. Therefore, it was only used here to get an overview of the entire TR. The deep geometry of a number of offshore faults has been determined using the TAD-JOURADEN seismic reflection profiles. Onshore field studies have been focused on poorly investigated areas from the southern margin of the TR, e.g., the Djibouti Plain, and
the Arta transverse zone, where >3 Myr old volcanics are widely exposed (Figure 1b). Quantitative analysis of fault parameters (length, azimuth, spacing) was conducted on fault populations extracted from ASTER satellite images (lateral resolution 15 m) and corresponding digital elevation models (vertical resolution 7 m). Estimates of vertical dis-placement along each fault were derived from fault scarp geometry. Seriated topographic profiles across each indi-vidual fault scarp gave the maximum value of displacement at the surface. When the top surface of the footwall uplifted block was degraded by erosion, the summit‐level envelope was used as a surface marker to restore the initial footwall geometry. In any case, vertical throws represent minimum estimates which do not account for possible fault displace-ment at depth. Markers for sense of displacedisplace-ment (striations) are generally not observed along exposed fault surfaces within basalts, hence precluding any accurate stress recon-structions to be performed. The age pattern of faulting within the TR was established from crosscutting relation-ships of faults with dated volcanic and sedimentary sequences. The structure of the adjoining Ghoubbet rift is Table 1. Chemical Compositions of Representative Whole Rock Samples of Gulf, Goumarre, Somali, and Hayyabley Basaltsa
Gulf Basalts (Northern margin)
Gulf Basalts
(Southern margin) Goumarre Basalts Somali Basalts
Hayyabley Basalts dj18/06 dj03/06 dj18/06 dj45/04 dj38/05 dj60/05 dj43/04b dj07/04aI dj30/04aI dj04/04as dj03/04 dj39/05 dj14/04c dj09/04b dj54/04b
Major Element Oxides (wt %)
SiO2 46.30 46.20 45.90 46.10 47.40 47.60 46.50 47.00 48.00 48.00 49.20 48.20 49.86 50.10 47.15 TiO2 2.92 2.71 1.98 2.46 2.65 2.78 2.96 3.72 3.62 3.84 3.32 3.42 2.88 2.88 0.93 Al2O3 14.35 15.35 15.35 14.55 13.87 14.15 14.20 13.34 13.48 13.25 13.00 13.36 13.85 13.50 16.53 Fe2O3* 15.40 14.50 14.20 14.62 16.10 15.95 16.68 15.00 15.25 15.50 15.10 16.15 14.50 14.50 10.35 MnO 0.22 0.21 0.21 0.21 0.23 0.24 0.24 0.22 0.23 0.24 0.22 0.25 0.22 0.22 0.17 MgO 8.20 7.65 6.75 8.50 6.05 6.10 6.24 5.77 5.17 4.95 4.74 4.89 4.82 4.92 9.45 CaO 10.00 10.45 11.00 10.45 10.05 9.80 9.74 10.45 10.00 9.60 9.30 9.50 9.24 9.15 12.9 Na2O 2.66 2.67 2.35 2.53 2.71 2.77 2.71 2.86 3.03 3.13 2.90 3.04 3.14 3.22 1.99 K2O 0.47 0.34 0.23 0.34 0.53 0.54 0.44 0.71 0.81 0.75 0.86 0.72 0.76 0.67 0.08 P2O5 0.42 0.30 0.23 0.34 0.38 0.34 0.38 0.54 0.59 0.53 0.62 0.56 0.41 0.40 0.07 LOI −0.83 −0.42 1.54 −0.28 −0.50 −0.46 −0.73 −0.38 −0.31 −0.48 0.41 −0.25 0.05 −0.12 0.46 Total 100.11 99.96 99.74 99.82 99.47 99.81 99.36 99.23 99.87 99.31 99.61 99.84 99.72 99.44 100.08 Trace Elements (ppm) Rb 6.90 5.20 2.70 5.00 10.20 6.80 8.30 13.80 16.00 14.90 18.00 11.80 10.30 17.30 1.05 Sr 320.00 393.00 317.00 315.00 262.00 264.00 266.00 378.00 378.00 810.00 318.00 330.00 320.00 317.00 154.00 Ba 168.00 138.00 119.00 130.00 208.00 158.00 155.00 210.00 223.00 305.00 270.00 290.00 220.00 212.00 34.00 Sc 35.00 31.50 37.50 35.00 39.00 38.00 39.00 38.00 33.00 32.00 34.00 35.5 34.5 36.00 45.00 V 380.00 350.00 337.00 365.00 405.00 395.00 425.00 460.00 400.00 465.00 405.00 398.00 388.00 395.00 285.00 Cr 287.00 207.00 311.00 320.00 94.00 89.00 69.00 130.00 44.00 28.00 28.00 22.00 29.00 29.00 380.00 Co 56.00 53.00 57.00 58.00 56.00 51.00 54.00 44.00 43.00 43.00 44.00 43.00 44.00 43.00 51.00 Ni 150.00 135.00 153.00 175.00 79.00 71.00 78.00 76.00 48.00 35.00 38.00 24.50 42.00 41.00 198.00 Y 34.50 29.50 26.50 33.00 42.00 42.0 42.50 42.50 45.00 44.00 48.50 45.00 42.00 41.50 20.50 Zr 190.00 153.00 122.00 160.00 200.00 204.00 195.00 275.00 280.00 293.00 280.00 253.00 256.00 264.00 48.00 Nb 25.00 20.20 13.00 18.00 23.00 25.00 22.50 39.50 41.00 45.00 36.50 32.00 31.00 32.00 2.70 La 19.50 16.30 13.00 15.40 20.00 21.50 20.00 30.50 34.00 33.50 30.00 28.00 27.50 27.50 2.60 Ce 44.00 39.00 31.00 36.00 46.00 49.00 46.00 68.00 76.00 74.00 69.00 63.00 61.00 62.00 7.1 Nd 28.00 24.50 20.00 22.50 27.50 29.00 28.00 41.00 45.00 44.00 41.5 37.50 36.00 35.50 5.3 Sm 6.70 5.85 4.40 5.70 6.90 6.80 7.10 9.10 9.70 9.50 9.60 8.50 8.10 8.25 2.00 Eu 2.2 2.01 1.68 1.96 2.25 2.22 2.3 2.87 3.12 3.01 3.02 2.87 2.56 2.54 0.8 Gd 6.7 5.9 5.00 6.10 7.15 7.6 8.00 8.9 10.00 9.50 10.00 9.40 8.60 8.20 2.30 Dy 6.35 5.10 4.50 6.00 7.25 7.40 7.40 8.00 8.50 8.30 9.00 7.90 8.00 7.85 3.30 Er 3.30 2.70 2.50 3.10 4.00 4.00 4.10 4.00 4.40 4.10 4.70 4.20 4.00 4.00 2.10 Yb 3.05 2.55 2.29 2.85 3.73 3.80 3.80 3.47 3.80 3.62 4.00 3.90 3.68 3.66 2.18 Th 1.50 0.80 0.80 1.02 2.55 2.55 1.85 3.00 3.40 3.40 3.00 2.75 3.20 3.45 0.10
only briefly discussed here, with reference to published works [Audin et al., 2001].
[5] Geochemical analyses (major and trace elements) and
radiometric dating (K/Ar method) have been focused on poorly known mafic volcanics from the Djibouti Plain, with the aim of identifying several basaltic units and mapping them. Major and trace element data on bulk rocks (Table 1) were obtained by Inductively Coupled Plasma–Atomic Emission Spectrometry (ICP‐AES) at IUEM (Institut Uni-versitaire Européen de la Mer), Plouzané. International standards were used for calibration tests (ACE, BEN, JB‐2, PM‐S and WS‐E). Rb was measured by flame emission spectroscopy. Relative standard deviations are ±1% for SiO2,
and ±2% for other major elements except P2O5 and MnO
(±0.01%), and approximately 5% for trace elements. The analytical techniques are described by Cotten et al. [1995]. Ar isotopic compositions and K contents of two samples (Table 2) were measured at LSCE, Gif‐sur‐Yvette and IUEM, respectively. Ar analyses were performed using the unspiked technique procedures detailed by Yurtmen et al. [2002] and Guillou et al. [2004]. Ages were calculated using the constants recommended by Steiger and Jäger [1977].
3. Spatial and Temporal Distribution
of Synrift Volcanism in the Tadjoura Rift
3.1. General Rift Setting[6] The Sheba accretionary ridge within the Gulf of Aden
forms, together with the Red Sea and the Ethiopian rift, one of the three diverging branches of the Afar Triple Junction (Figure 1a). According to magnetic anomaly data, mid-oceanic ridge segments and fracture zones initiated along its eastern part at 17–18 Myr [Leroy et al., 2004; d’Acremont et al., 2006], or possibly at 20 Myr [Fournier et al., 2010], and then propagated westward, obliquely to the N40°E direction of Arabia‐Somalia plate separation [Cochran, 1981] (Figure 1a). Emplacement of incipient oceanic crust at the western tip of the Sheba ridge is recorded along the∼EW trending Obock‐Tadjoura Gulf by <2 Myr old paired magnetic anomalies (Figure 1c). The anomalies partly coincide with the 3–1 Myr Gulf basaltic series which floor the Tadjoura Gulf, and outcrop onshore in its northern (Tadjoura) and southern (Djibouti Plain) margins [Manighetti et al., 1997] (Figure 1b). The EW‐ oriented TR‐related structures intersect at high‐angle older tectono‐magmatic fabrics displaying a submeridian orien-tation in the Mabla (15–11 Myr), Somali (7.2–3.6 Myr), and Ribta (3.6 Myr) substratum series, emplaced at an earlier stage of rifting.
[7] The Gulf Basalts are a potentially accurate structural
marker of the rift history recorded by the TR in the last 3 Myr, and it is therefore important to determine their spatial and temporal distribution for a better definition of the TR. That has been attempted by using new geochemical and age data set obtained on basaltic units in the Djibouti Plain, i.e., on the southern margin of the TR. Combined with previ-ously published K‐Ar ages, this data set allows us to dis-criminate four recent basaltic units, i.e., the Gulf, Somali, Goumarre, and Hayyabley Basalts, hence allowing signifi-cant revision of the 2‐D map structure of the TR (Figure 2a and Figure S1 in the auxiliary material).1The two first units were already identified by previous authors [Richard, 1979; Gasse et al., 1983, 1985, 1986] from volcano‐stratigraphic criteria. The various geographical subunits of the Gulf Basalts distinguished by these authors have, however, been grouped into a single volcanic unit because of their identical geo-chemical signatures. Gasse et al. [1983] also noted important chemical differences between the Hayyabley and Gulf Basalts. Finally, although they are younger than the Gulf and Somali Basalts which they crosscut, the Goumarre basalts were not recognized as a distinct type prior to this study.
3.2. Geochemical Characteristics of the Tadjoura Rift Basalts
3.2.1. Sampling and Classification
[8] Seventy eight mafic lavas have been analyzed for
major and trace elements (see Table 1 for representative analyses). They include 21 samples from the Gulf Basalts in the Djibouti Plain, 10 from the same unit north of the Tadjoura Gulf, 22 from the Somali Basalts, 16 from the young volcanic cones and intrusions of the Goumarre Basalts, and finally 9 from the Hayyabley volcano. The locations of these samples are shown in the auxiliary material, except those of the Hayyabley Basalts which are given by Daoud et al. [2010]. In addition to this sample set, we have shown, as envelopes in Figures 3a–3d, the fields of previously published analyses of (1) the Gulf Basalts (Initial Gulf Basalts) [Richard, 1979; Joron et al., 1980a; Vidal et al., 1991; Deniel et al., 1994], (2) the Asal Basalts [Richard, 1979; Joron et al., 1980b; Vidal et al., 1991; Deniel et al., 1994], and (3) offshore basalts dredged along the gulf axis [Barrat et al., 1990, 1993].
[9] All the collected samples are basalts, according to the
total alkalies‐silica (TAS) classification scheme of Le Bas Table 2. New K‐Ar Datings of Two Gulf Basalt Samples From the Wea Paleo‐Valleya
Experiment
Split Weighted Mean
K (wt%) ±1s Mass molten (g) 40Ar* (%)
40Ar* 10−13 (mol/g) ±1s 40Ar* 10−13 (mol/g) ±1s Age (Myr) ±2s dj43/04b 7454 0.371 ± 0.004 1.07191 2.434 7.003 ± 0.106 7470 «… … … … .. » 1.00241 3.093 7.020 ± 0.105 7.012 ± 0.008 1.09 ± 0.03 dj38/05 7257 0.332 ± 0.003 1.09347 2.153 6.949 ± 0.109 7273 «… … … … .. » 1.02438 3.088 6.796 ± 0.122 6.882 ± 0.081 1.19 ± 0.04
aSample locations are shown in Figure 2a, and analytical methods are discussed in the text.
1Auxiliary materials are available in the HTML. doi:10.1029/
et al. [1986]. In the TAS plot of Figure 3a, they lie on both sides of, but close to, the line separating the fields of sub-alkalic and sub-alkalic basalts [Irvine and Baragar, 1971], with the exception of Hayyabley Basalts which are clearly sub-alkalic. The Gulf, Goumarre and Somali Basalts can there-fore be considered as transitional basalts with a dominant tholeiitic tendency [Richard, 1979; Bizouard and Richard, 1980; Joron et al., 1980a, 1980b; Vidal et al., 1991; Deniel et al., 1994]. The various groups may be quite readily dis-tinguished using the TAS plot (Figure 3a), which has been used, together with other major and trace element data (Figures 3b–3d) to draw the boundaries between them in the new geological sketch map (Figure 2a). Indeed, the Somali Basalts are more silica‐rich than the others (SiO2: 48–52 wt.
%), while Hayyabley Basalts are consistently depleted in al-kalies (Na2O + K2O∼ 2 wt.%), and the Goumarre Basalts are,
at equivalent SiO2contents, richer in alkalies than the Gulf
Basalts. Among the latter, the compositions of samples col-lected on both sides of the Tadjoura Gulf systematically overlap, as already noted by Richard [1979], Bizouard and Richard [1980], and Gasse et al. [1983].
[10] The studied transitional basalts contain 3 to 15 modal
% phenocrysts of calcic plagioclase and magnesian olivine in a ∼2:1 ratio. These phenocrysts are set in microlitic to subdoleritic groundmass, with microcrysts of plagioclase, olivine, augite, titanomagnetite and hemoilmenite. Their crystallization order involves successively (1) magnesio-chromite, usually found as inclusions within olivine phe-nocrysts; (2) olivine; (3) calcic plagioclase; (4) augite; and finally (5) iron‐titanium oxides. It is typical of transitional and tholeiitic series, as well as the strong Fe enrichment documented in olivines and augites [Richard, 1979; Bizouard and Richard, 1980].
3.2.2. Major and Trace Element Features
[11] Selected plots of major and transition elements
against total iron as FeO versus MgO ratios (FeO*/MgO) are shown in Figure 3b. Once again, the Hayyabley Basalts [Daoud et al., 2010] differ from all the other groups by their more primitive character (lower FeO*/MgO ratios, higher Ni concentrations), and their much lower TiO2and P2O5
con-tents. Gulf Basalts tend to display lower FeO*/MgO ratios (1.5 to 2.5) than the Goumarre and Somali Basalts (2 to 3), as well as lower SiO2(45–48 wt. %), TiO2, P2O5and K2O
contents. Regarding the transition element Ni and others not shown (Co, Cr), they are intermediate between the relatively primitive Hayyabley Basalts and the evolved Goumarre and Somali Basalts.
[12] The envelopes of the incompatible multielement
pat-terns of the studied basalts, normalized to the Primitive Mantle [Sun and McDonough, 1989] are shown in Figure 3c. While Hayyabley Basalts have flat to slightly depleted patterns, the Gulf, Goumarre and Somali Basalts display
moderately enriched patterns, typical of Afar transitional basalts [Barrat et al., 1990, 1993; Vidal et al., 1991; Deniel et al., 1994; Rogers, 2006; Furman et al., 2006]. They plot close to the enriched component of the “Red Sea mixing line” (Figure 3c) which connects the depleted (MORB mantle) and enriched (plume‐type) components of the sources of the Red Sea basalts [Barrat et al., 1990]. How-ever, several significant differences between the patterns of Gulf, Goumarre and Somali Basalts can be noticed on these plots, and they have been used to refine the new geological map (Figure 2a). For instance, the Gulf Basalts are generally less enriched in incompatible elements (especially in the most incompatible ones, from Rb to Ce) than the Goumarre and Somali Basalts which show strong positive Th spikes. Furthermore, Somali Basalts display a larger range of heavy rare earth element (REE; e.g., Dy and Yb) contents than the other types, including higher concentrations close to ten times the Primitive Mantle. Consequently, the RRE patterns (not shown) of the Goumarre Basalts are more fractionated than those of the Somali Basalts, and the two types can easily be distinguished by their different La/Yb ratios (8–10 and 6–8, respectively).
[13] Other efficient ways to distinguish the Gulf Basalts
from the Goumarre and Somali Basalts are provided by the rectangular diagrams of Figure 3d, which involve incom-patible element ratios showing little or moderate overlap between these three groups. Basically, all ratios using an element plotting to the left or the middle of the multielement plot (e.g., Th, Ba, Nb, La, Zr or others not shown like Rb, K, Ce, Sr, P) versus an element plotting to the right (Y, Yb) may be used to distinguish the moderately enriched Gulf Basalts from the more enriched Goumarre and Somali Basalts. These geochemical plots, together with geomor-phological, structural and age data, led us to shift the map limit between the Gulf and Somali Basalts in the Djibouti Plain 10 km further north than drawn on previous maps [Gasse et al., 1983, 1986]. In addition, the abrupt chemical change observed at a depth of 220 m in basalts drilled in the PK20 borehole (Figure 2a) is consistent with the transition from the upper Gulf Basalts to the underlying Somali Basalts. However, the top of the Somali pile in this borehole has been abnormally enriched in Y and heavy REE (e.g., Yb), and the corresponding point has thus not been shown in Figure 3d plots. Such abnormal enrichments are the conse-quence of the crystallization of low‐temperature REE‐ bearing phosphate (rhabdophane) during pedogenetic alter-ation processes [Cotten et al., 1995], prior to the emplace-ment of the Gulf basaltic pile.
[14] Some of the differences observed between the Gulf
Basalts, on one hand, and the Goumarre and Somali Basalts, on the other hand, may be attributed to olivine fractionation. Indeed, the latter basalts display higher FeO*/MgO ratios,
Figure 2. Revised geological sketch map of the onshore parts of the Tadjoura rift. (a) Revised map showing the distri-bution of the various basalt types and the location of dated basaltic rocks. Ages in megayears (numbers inside the squares) from published [Richard, 1979; Gasse et al., 1983; Zumbo et al., 1995] and new data (this study, see Table 2). Tectonic features are not shown on this simplified map. Abbreviations on the map are: A, Arta; CW, Chabelley wadi; DD, Dey Dey wadi; HV, Hayyabley volcano; G, Goumarre; Gb, Goubbetto; and PK20,“Point kilométrique” 20. (b) Longitude versus age plot for the southern and northern coastal strips of Gulf Basalts. A linear age progression is not clearly observed.
Figure 3. Chemical features of young mafic volcanics from the Tadjoura rift. (a) Total alkalies ‐silica (TAS) diagram for the Gulf, Goumarre, Somali, and Hayyabley Basalts. (b) Plots of SiO 2 , TiO 2 ,K 2 O, Al 2 O3 ,P 2 O5 , and Ni against FeO*/MgO ratios of the studied basalts. (c) Multielement patterns of the studied basalts. (d) Plots of Th/Nb, Th/Ba, Th/Yb, and Zr/Y ratios against La/Yb ratios. Symbols refer to our sample set, whereas the solid, dashed, and dotted lines correspond to fields of Initial Gulf, Asal, and Gulf axis basalts, respectively, from the literature (see text for corresponding references).
lower Ni and other compatible transition element contents, and higher SiO2, TiO2, P2O5and K2O contents than the Gulf
Basalts (Figure 3b). Olivine fractionation might also account for their higher incompatible element contents compared to the Gulf Basalts (Figure 3c). However, as this process does not fractionate appreciably ratios between highly incom-patible elements (e.g., Th/Nb and Th/Ba, Figure 3d), nor strongly modifies the shapes of REE patterns (and conse-quently the La/Yb ratios [Allègre et al., 1977]), it cannot account for the differences shown in Figure 3d plots. These differences might result from variations affecting partial melting degrees, mantle source heterogeneity, crustal con-tamination, or more likely a combination of these processes [Joron et al., 1980a, 1980b; Barrat et al., 1990, 1993; Vidal et al., 1991; Deniel et al., 1994]. In addition, the different La/Yb ratios of the Goumarre and Somali Basalts, which display nearly equivalent enrichments in most incompatible elements, might indicate that the former derive from a deeper (i.e., garnet‐bearing) mantle source than the latter, as garnet incorporates selectively heavy REE.
3.3. Spatial Distribution and Volcano Stratigraphy of Tadjoura Rift Volcanics
[15] The geochemical criteria discussed above, together
with field mapping, allows us to propose a revised 2‐D map arrangement of the Gulf Basalts, and consequently of the TR (Figures 2a and 4b). When superimposed on the morpho-logical map of Figure 4a, the map extent of the TR corre-sponds to an approximately 60 × 40 km EW trending topographically subdued domain. The onshore part of the TR forms the Northern and Southern Coastal Fault Belts (NCFB and SCFB) in the Tadjoura‐Obock and Djibouti Plain areas, respectively. The presence of Gulf Basalts in the floor of the Tadjoura Gulf is argued by dredged samples [Barrat et al., 1990, 1993], and to a lesser extent by the seismic records discussed below.
3.3.1. Gulf Basalts in the Northern Onshore Margin [16] In the Tadjoura‐Obock area, the Gulf Basalts occur
in a 15 × 8 km faulted coastal plateau, less than 300 m high (NCFB, Figure 4b). The main cartographic unit of the Gulf Basalts (the Roueli unit of Gasse et al. [1983, 1985]) extends to the north as a 10 × 5 km faulted belt oriented N100°E, which swings to the northeast into a narrower N50°E strip. The Gulf Basalts lie further south as discrete inliers beneath locally faulted Quaternary alluvial fans, possibly as young as Holocene [Manighetti et al., 1997]. Their rapid disappearance west of longitude 42° 50′E might result from a nearly NS trending paleo‐high, in the northern prolongation of the Arta zone (see section 4.3) (Figure 4a).
[17] The total thickness of the Gulf Basalts volcanic pile is
estimated to 350 m [Gasse et al., 1985]. Its exposed part is mostly made up of superimposed columnar‐jointed sub-aerial lava flows, the individual thickness of which reaches up to 10 m. A few submarine lava flows have been de-scribed at the mouth of the Sadaï‐Tagarré wadi [Gasse et al., 1983]. The presence of vertical mafic dykes, associated sills and plug‐type feeder magmatic structures intruding tilted lava successions NE of Tadjoura confirms the fissural origin
of the entire Gulf Basalts series, but it also rules out its exclusive origin from offshore vents along the TR axis [Richard, 1979]. The N110°E trend of the onshore feeder dykes further indicates, in first approximation, a N20°E direction of opening, slightly oblique with respect to the inferred N40°E regional tectonic extension [Gaulier and Huchon, 1991].
3.3.2. Southern Flank of the TR in the Djibouti Plain [18] According to the geochemical criteria presented above,
the map distribution of Gulf Basalts in the Djibouti Plain (Figure 2a) is more restricted than previously assessed by Gasse et al. [1983, 1985]. They are confined to a 10 × 20 km coastal faulted plateau which uprises southward, via the EW trending Ambouli topographic flexure (Figure 4e), to a northerly tilted surface in the 7.2–3.6 Myr Somali Basalts. To the east, the Gulf Basalts are overlain by lavas of the∼1 Myr old Hayyabbley shield volcano [Gasse et al., 1983; Daoud et al., 2010], the main axis of which follows a major N140°E fault scarp bounding the eastern coastal plain to the south-east. The western limit of the Gulf Basalts abuts against the NS‐oriented eastern edge of the Arta reliefs, although they locally fill up the Wea paleo‐valley (Figure 2a).
[19] The Gulf Basalts pile consists of a succession of
subaerial fluid lava flows of fissural origin. Individual flows are generally less than 10 m thick, and their surfaces show typical pahoehoe features; their central part often displays columnar jointing patterns. Field emplacement criteria (e.g., deformation of pahoehoe“ropy” surfaces and flow patterns at their base) indicate that they mostly flowed southward over the Djibouti Plain. Their original vents have not been recognized onshore, and therefore are presumably located in the presently submerged part of the TR. The Gulf Basalt pile reaches a maximum thickness of 220 m in boreholes drilled in the PK20 area to the west (Figures 2a and 4e), where they overlie the top of the Somali Basalt pile. The upper-most sequence of Gulf Basalts is exposed in the Ambouli‐ Chabelley area to the south (Figure 4e). It includes a succession of thin (<1 m thick) subaerial lava flows, inter-digitated with conglomeratic alluvial horizons (basaltic boulder‐rich facies). The latter probably derived from uplifted reliefs in the Arta and Somali surrounding domains. The young and flat lying Gulf Basalts flows onlap previously tilted Somali Basalts along the Ambouli flexural zone (Figure 4e). [20] Available K‐Ar and Ar‐Ar ages of Gulf Basalts from
the Djibouti Plain range from 2.8 to 1.5 Myr (Figure 2a) [Richard, 1979; Gasse et al., 1983; Zumbo et al., 1995]. This range can be extended to 1.19 Myr and 1.09 Myr (Table 2) taking into account our new results on Gulf Basalts flows from the Wea paleo‐valley (Figure 2a). In the Warabor wadi cross section, the Gulf Basalts pile is overlain by the Hayyabley volcano lava flows which yielded ages of 1.06 ± 0.09 Myr and 0.93 ± 0.06 Myr [Daoud et al., 2010]. The 3.3 Myr old basaltic rocks located to the southeast of the Ambouli wadi were previously assigned by Richard [1979] to the Gulf Basalts. Their geochemical features al-low us to consider them as part of the Somali series. Therefore, the revised longitude versus age plots drawn for the southern and northern Gulf Basalts (Figure 2b) can no longer be used to support the idea of an age decrease toward
the west [Richard, 1979; Manighetti et al., 2001; Audin et al., 2004].
[21] The approximately 7.2–3.0 Myr old Somali Basalts
[Chessex et al., 1975], which cover most of the Djibouti
Plain south of the Ambouli regional‐scale flexure, form a monotonous and weakly incised plateau (Figures 4a, 4b, and 4e). They likely represent a trap‐like pile, similar to the nearly contemporaneous (8.6–3.8 Myr) Dalha basaltic series
located northwest of the Djibouti Plain [Marinelli and Varet, 1973; Barberi et al., 1975]. In the Holhol area (Figure 2a), the Somali Basalts rest unconformably over tilted, and partially eroded, rhyolitic sequences of the 15–11 Myr old Mabla series [Black et al., 1975; Zumbo et al., 1995]. Because of restricted exposures and difficult access condi-tions, their total thickness and their internal organization are poorly known. The 30–40 m high sections exposed along the Dey Dey wadi (Figure 2a) show up to ten superimposed subaerial basaltic flows, either columnar‐jointed or showing lava tubes. They range in thickness from 1 to 10 m, and are often separated by autoclastic breccia levels and/or by strombolian lapilli horizons up to 1 m thick. A 30 m high cross section near Goumarre volcano (Figure 2a) exposes seven superimposed subaerial basaltic flows, each of them 2 to 8 m thick, emplaced toward the north (i.e., in an opposite direction to that of the Gulf Basalts), according to local field criterions. Mafic dykes crosscutting Somali lavas in the Goubetto area to the west (Figure 2a) consist of∼1 m thick vertical intrusions, oriented N80–90°E, i.e., slightly oblique to the N110°E Gulf Basalts feeder dykes.
[22] With respect to the intricate swarm of young
volca-noes which punctuate the Djibouti Plain (Figure 2a), special attention has been paid to three N80°E parallel arrays of basaltic vents crosscutting the Somali lavas, and referred here as to the Goumarre Basalts (from their type locality, i.e., the Goumarre strombolian lapilli/ash cone, dated at 1.75 Myr by Gasse et al. [1983]). These volcanic corridors, each of them a few km wide, are sharply cut to the east by the N140°E coastal scarp. To the west, their tips remain within the So-mali Basalts and do not reach the older substratum series of the Ali Sabieh range. In addition to numerous small strombolian or maar‐type volcanoes, with maximum height of approximately 100 m, the Goumarre Basalt series includes various types of intrusions (dykes, sills, plugs), often spatially connected with these volcanoes. The genetic relationships between Goumarre‐type lavas and their in-ferred magmatic feeders can be observed on aerial photo-graphs of the Dey Dey central corridor in the Goumbourta Atar strombolian cone area (Figure 2a). There, lava flows seem to either radiate from small‐scale vents, or diverge on both sides of N80°E trending fault/fissure structures which correlate in the field with narrow (1–2 m thick) dykes and thicker (15 m) sills crosscutting the Somali Basalts. Most of
the Goumarre Basalts are therefore likely to have been emitted from transverse fault/dyke corridors, nearly parallel to the present‐day Gulf axis. Published radiometric ages from the Goumarre (2.46, 1.84, 1.80, 1.75 Myr) and Nagad (1.69 Myr) cones [Richard, 1979; Gasse et al., 1983] are younger than those obtained from the Somali Basalts (3.40, 3.30, 2.93 Myr) [Richard, 1979; Zumbo et al., 1995] (Figure 2a). It is therefore suggested that the Goumarre Basalts were emplaced during a relatively short time interval, concomi-tantly with the Gulf Basalts, but in a more southern, i.e., external, position with respect to the TR framework.
4. Half
‐Graben Structure of the Tadjoura
Rift
[23] The overall 3‐D architecture of the TR is discussed
below, both in terms of map fault arrangement, and cross‐ sectional structure, from exposed geology and offshore bathymetric and seismic data set (Figure 4). A quantitative analysis of onshore fault populations in the NCFB and SCFB was also performed from ASTER imagery measure-ments. Emphasis is then put on two specific structural fea-tures in the western extremity of the TR, i.e., the Arta sumeridian zone and a network of NW‐SE faults, which are both regarded as key elements for a better understanding of the mechanism of strain transfer in the Tadjoura‐Ghoubbet transition rift zone.
4.1. Two‐Dimensional Map Structure
[24] The TR is an approximately 60 × 40 km EW trending
topographically subdued domain, partly exposed onshore in the NCFB and SCFB, on both sides of the Tadjoura Gulf (Figures 4a and 4b). Its inner offshore part is dominated to the north by the N120°E‐oriented Tadjoura rhomb‐shaped trough which is sinistrally offset from the Obock depression by approximately 30 km along the right‐lateral Maskali transform fault system [Arthaud and Choukroune, 1976]. The TR is surrounded by highlands involving older rift‐ related volcanics of the Mabla (18–11 Myr, in Gasse et al. [1985]), Dalha (8.6–3.8 Myr), Somali (7.2–3.6 Myr), and Ribta (3.6 Myr) series. It is dissected by an inhomogen-eously distributed fault pattern, comprising Gulf‐parallel, NW‐SE and NE‐SW structures. The map‐scale sigmoid trace of the entire fault pattern typically evokes an oblique
Figure 4. Overall structure of the Tadjoura rift. (a) Topography of the TR drawn from a bathymetric contour map (from Audin [1999], modified) and a SRTM digital elevation model. Dashed lines represent the Maskali transform (MT) and Bour Ougoul transverse fault systems. Note the strong NS‐oriented structural grain in the Arta zone. The traces of the structural cross section in Figure 4e and the two interpreted seismic profiles in Figures 4c and 4d are shown. HV represents Hayyabley volcano. (b) Structural map of the TR obtained (1) by merging onshore geology with offshore bathymetric data set and (2) by using the Gulf Basalts as a rift marker (only drawn onland). Abbreviations on the map are: ATZ, Arta transverse zone; HV, Hayyabley volcano; NCFB, Northern Coastal Fault Belt; and SCFB, Southern Coastal Fault Belt. (c and d) Raw (top) and interpreted (bottom) TADJOURADEN offshore seismic profiles (time sections) perpendicular to the NW‐SE‐oriented fault‐controlled Tadjoura inner trough (see traces in Figure 4a). (e) Interpretative structural cross section showing the Tadjoura rift as a south facing half‐graben, partly filled up by Gulf Basalts. The elements of the deep structure of the Tadjoura rift are conjectural. The geometrical relationships between the underlying Somali and Dalha basalts are extrapo-lated from patterns observed onshore along the Bour Ougoul lineament on the NW flank of the Ali Sabieh antiform (see Figure 4a for location).
rift setting. Two high‐density fault zones occur on the eastern parts of the conjugate margins, in the Tadjoura trough and the NCFB to the north, and in the SCFB to the south. In the intermediate and less deformed zone, the pre-ferred N60°E alignment of shield‐like volcanoes might be controlled at depth by Maskali‐type transverse structures (Figure 4b). To the west, the TR narrows markedly, north of the Arta transverse zone, where its floor shallows abruptly, up to 100–200 m below sea level, through a submeridian scarp disrupted by an array of isolated NW‐SE faults. The TR fault system does not extend beyond the Gulf Basalts, e.g., into the substratum series which instead show evi-dence for earlier deformation (see sections 4.2–4.4). 4.2. Half‐Graben Cross‐Sectional Structure
[25] The composite structural cross section in Figure 4e,
drawn at high angle with respect to the dominant N110– 120°E fault strike in the TR, is calibrated by TADJOUR-ADEN bathymetric and seismic reflection data which have been merged with onshore geology. It shows a 35–40 km wide half‐graben structure, facing the SSW. Its inner and deeper part is occupied by the Tadjoura trough, which is bounded to the north by a prominent fault system, in-cluding the Tadjoura master fault, and its highly faulted footwall block, partly exposed in the NCFB. To the south, an approximately 20 km long typical flexural margin shallows gradually southward, up to the Djibouti Plain, where Gulf Basalts are locally dissected by a high‐density antithetic fault system in the SCFB. The flexure is locally punctuated by shield volcanoes.
[26] The deep structure of the Tadjoura inner trough is
constrained down to about 2 s (two‐way travel time), or depth of 4–5 km, by selected single‐channel seismic reflection profiles striking NE‐SW, orthogonal to the prominent bathymetric scarps (Figures 4c and 4d). To the north, the steep bathymetric scarp, >500 m high and facing the SSW on the seismic line of Figure 4c, is interpreted as the upper part of the master fault. High‐amplitude reflectors lying, with an apparent gentle dip, in its immediate hanging wall are reliably correlated with Gulf Basalts dredged from the Tadjoura gulf [Barrat et al., 1990, 1993]. Similar seis-mic facies present, with a reduced thickness, in the elevated footwall block correlate laterally with onshore Gulf Basalts in the NCFB (Figure 4b), hence confirming our seismo‐ stratigraphic interpretation. The volcanic infill sequence thickens markedly toward the boundary fault, just like syn‐ faulting deposits, up to a maximum thickness of 7–800 m. This value is obtained by converting the 0.3 s (two‐way travel time) measurement, assuming an average seismic velocity for basalts of 4.5–5.0 km s−1.
4.3. Footwall Block Structures in the NCFB
[27] The deep structure of the footwall block comprises a
network of closely spaced and dominantly synthetic extensional faults. These structures bound narrow blocks stepping down gradually toward the trough (Figure 4c). The footwall fault system continues onshore into the NCFB, with a marked swing of the dominant fault trend into a N100°E direction (Figures 4b and 5a) and additional
N20°E and N50°E (Maskali trend) faults. Two submeridian E facing extensional faults (F21and F22in Figure 5a), with
vertical displacements of 60 m and 50 m, respectively, were also identified. Their crosscutting relationships with the N100°E fault pattern (either interrupted or not, and with or without apparent offset) suggest their synchronous development.
[28] Fault patterns are well exposed in the Roueli northern
unit, a feature which permits an accurate geometrical and statistical analysis of the corresponding fault population. There, Gulf‐parallel faults are partially blanketed to the west by 1.4–0.8 Myr old Quaternary alluvium [Gasse, 1991]. Similarly trending faults occur further south through both inliers of Gulf Basalts and overlying Holocene alluvial deposits. Two of these faults extend westward across Mabla acidic volcanics, with minor extensional displace-ment [Manighetti et al., 1997].
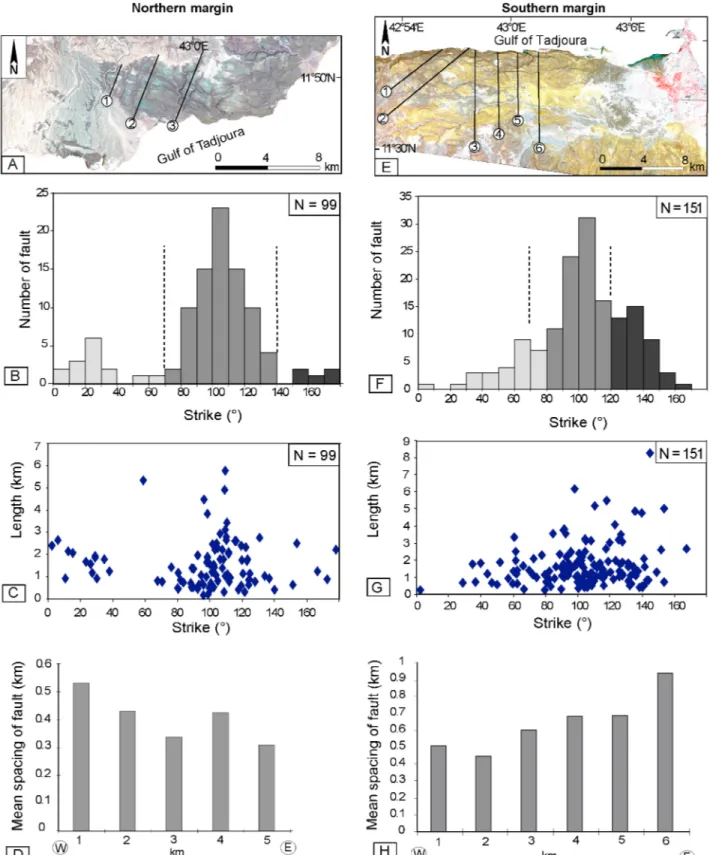
[29] The dominant N100°E fault set is composed of
iso-lated and highly segmented structures showing curved map traces (Figure 5a). The measured tip‐to‐tip length of the total fault data set (99 data) ranges from 0.4 to 6.0 km, with a peak at 1.2 km, and 90% of length values less than 2.8 km (Figures 6b and 6c). Fault population is homogeneously distributed, but with a marked increase of fault spacing westward (Figure 6d). Individual faults are clustered into 4 to 5 major faults facing the south, and causing the downwarping of the Gulf Basalts toward the gulf axis. Very few antithetic structures, with minor associated displace-ment, do occur (e.g., F80 in Figure 5b). Along‐strike
var-iations of individual fault profiles are observed on the three orthogonal cross sections shown in Figure 5b. The hori-zontal surface of most individual footwall blocks suggests nonrotational structures. The largest throw values (>50 m) systematically occur along the oldest (prealluvium) faults to the north. However, estimates of throws along the youngest (postalluvium) faults to the south might be underestimated because of syn‐faulting alluvial screes at the foot of some fault scarps. Vertical throw in the oldest fault network to the north increases markedly southward from 65 m (F6), 100 m
(F4) to >130 m (F8). A comparison of the three topographic
sections shows that the total fault‐induced elevation slightly decreases westward from 310 m (section 1) to 280 m (section 2), and to 200 m (section 3). These along‐strike variations of cumulate fault displacement are illustrated by the distribution of throw along some individual structures, such as faults labeled F1–7–19or F4–16, the tip of which lies
close to the substratum contact to the west.
[30] The cumulative bulk extension along three regularly
spaced sections across the fault system (Figure 6a) has been calculated with a mean fault dip of 60°–70°, similar to those reported elsewhere in the Afar depression [de Chabalier and Avouac, 1994]. The bulk extension decreases regularly from 3.4% to 1.6% westward. Special attention has been paid to the displacement‐length ratio (D/L), which may supply information about fault growth processes [Cowie and Scholz, 1992a, 1992b; Dawers et al., 1993; Manighetti et al., 2001], as a function of either the restricted versus unrestricted nature of the faults [Watterson, 1986; Gillespie et al., 1992], or the mechanical heterogeneity of the stressed medium [Trudgill and Cartwright, 1994; Wojtal, 1994]. D refers to
maximum displacement and L to fault trace length in map view. Classical fault growth models predict that displace-ment is maximal at or near the center of the fault and decreases toward its tips [Cowie and Scholz, 1992a, 1992b]. It is also generally accepted that the scaling relationship between L and D is:
D ¼ cLn
where c is a constant and n is a scaling exponent, ranging from 0.5 [Fossen and Hesthammer, 1997] to 1.5 [Walsh and Watterson, 1988; Gillespie et al., 1992; Dawers et al., 1993; Schlische et al., 1996]. When n = 1, as com-monly accepted [Cowie and Scholz, 1992a, 1992b; Dawers et al., 1993], the above equation corresponds to a linear scaling law. The value of c is an expression of fault displacement per length unit. For a linear scaling law (i.e.,
n = 1), c is simply the D/L ratio which characterizes the fault population. In the log‐log plot of maximum fault displacement versus length, Schlische et al. [1996] have defined a best fit linear curve with D = 0.03L.
[31] Manighetti et al. [2001] showed that the cumulative
slip distribution along fault systems in the Afar region is related to their time‐space growth and propagation history, and they proposed a best fit linear curve with D = 0.04L. These authors indicated that the maximum D/L values are characteristic of restricted faults which plot above the D = 0.04L line, while unrestricted faults plot below this line. In the present work, the D/L ratios calculated for N100°E faults (29 data) are in the range 0.0062–0.15, and thus plot below or along the line D = 0.04L (excepted one biased value due to measurement error) (Figure 7a). In agreement with the model of Manighetti et al. [2001], this feature indicates that Figure 5. Map distribution and morphological expression of extensional structures in the North Coastal
Fault Belt. (a) Structural map showing fault traces extracted from ASTER satellite images (vertical res-olution 15 m). Numbers refer to major individual structures. White lines indicate the trace of cross sec-tions in Figure 5b. (b) Three topographic cross secsec-tions illustrating changes in fault geometry both along‐ strike and perpendicular to the N100°E rift axis. Note the progressive increase of fault scarp size toward the south within each cross section and toward the west from profiles 1 to 3.
Figure 6. Geometrical and statistical characteristics of extensional fault networks in the (left) North and (right) South Coastal Fault Belts. (a and e). General 2‐D fault patterns on ASTER images. The traces of cross sections used for calculating cumulate extension are shown. (b and f). Histograms illustrating the frequency versus strike of faults. (c and g). Plots of faults length versus strike. (d and h). Average spacing of faults along regularly spaced (1 km apart) profiles through the North and South Coastal Fault Belts. (Traces of the profiles are not drawn).
the N100°E extensional fault network in the NCFB might be unrestricted.
4.4. Faulted Marginal Flexure in the SCFB
[32] Faulting throughout the half‐graben flexural margin
is mainly restricted to the 10 km wide belt of onshore Gulf Basalts in the SCFB (Figure 8a). However, a number of N140°E transverse faults appear to continue offshore throughout a less deformed area, north and west of the Arta zone (see section 4.5).
[33] The SCFB fault network displays a much more
in-tricate organization than that described above for the NCFB conjugate margin (Figure 8a). It includes three distinct sets of faults at N100–110°E, N130–140°E, and to a lesser extent N60–70°E (Figure 6f). The dominant N100°E anti-thetic fault pattern (with respect to the Tadjoura master fault) veers clockwise westward into a∼5 km wide swarm of probably coeval N140°E faults. The map curvature of Gulf‐ parallel structures is accompanied by an increasing density of faults (Figures 6h and 8a), which, accordingly, decrease in length. The majority of fault lengths (80%) are in the range 0.8–2.6 km, with a peak at 1.2 km (Figure 6g), i.e., quite similar to the values obtained for the northern struc-tures. Most Gulf‐parallel faults are sigmoid or curved in map view, and the en échelon arrangement of some of them (Figure 8a) might indicate a significant component of sinistral shearing. However, their dominantly extensional nature is evidenced on the cross sections of Figure 8b by typical north dipping morphological scarps which bound a network of weakly rotated fault blocks. The entire fault system is organized into 2 to 3 first‐order fault blocks with an increasing structural complexity westward, evidenced on profiles 1 to 4 by (1) a larger number of north dipping faults of reduced length, and (2) additional minor south dipping faults, which together delineate second‐order horst‐graben patterns (Figure 8b). On each structural section, maximum fault displacement is recorded along the coastal (innermost)
structures, in a way symmetrical to that observed in the NCFB. Cumulate vertical fault displacement perpendicular to fault system increases regularly westward, from 100 m (profile 1) to 250 m (profile 4), and 450 m (profile 5), together with the structural complexity mentioned above. The cumulative extension calculated along six cross sections (Figure 6e) provides low values, in the range 1.4% to 3.8%, with a significant increase westward, such as in the NCFB. The D/L ratios for the Gulf‐parallel structures (93 data) vary from 0.0044 to 0.16, and most of them plot below the line D = 0.04L, as typical unrestricted faults. Higher D/L ratios (>0.04) occur in the westernmost network of extensional faults which extend close to the Arta zone. These faults, labeled 1, 2, 4, 6, 7, 21, 29, 40, 95, 116 and 134 on Figure 8a, are likely to correspond to restricted and overdisplaced structures (Figure 7b).
4.5. Southwestern Edge of the TR and the Arta Zone [34] Near the western termination of the TR, the width of
the rifted domain decreases from 40 to less than 10 km, together with the abrupt shallowing of the seafloor west-ward, from 500 m up to 100–200 m below sea level. These structural changes occur through a 2–3 km wide sub-meridian morphological scarp (Figure 9a), in the northern prolongation of the NS trending Arta zone. This offshore scarp is dissected by a series of parallel N120–140°E faults (Figure 8a), with very little bathymetric expression in the seismic line shown on Figure 4d. These faults contribute to the downthrowing of the seafloor toward the Tadjoura trough to the east. The seismic activity recorded in the western extremity of the TR since the 1970s corresponds to relatively shallow earthquakes (<5–6 km deep) with moderate magnitudes (<3.2) [Doubre, 2004]. These earth-quakes are distributed along NW‐SE‐oriented seismic zones, and the corresponding fault plane solutions indicate dominantly left‐lateral slip along N140° trending structures (Figure 9a) [Lépine et al., 1980; Lépine and Hirn, 1992]. Figure 7. Log‐log plot of maximum fault displacement versus fault length for structures in the (a)
North and (b) South Coastal Fault Belts. The straight line corresponds to the best fit correlation (D = 0.04L). Open and solid symbols denote unrestricted and restricted (overdisplaced) faults, respectively. In Figure 7b, 10 out of 12 overdisplaced faults are located close to the Arta zone. Corresponding fault numbers are identical to those shown in Figure 8a.
Several NW‐SE transverse faults extend further to the SE, onshore, through the Gulf Basalts which cap the SCFB (Figure 9a). There, they form isolated and segmented structures, locally outlined by a dense swarm of small vol-canic vents,∼1 Myr old [Gasse et al., 1983]. They show a longer and more linear map trace than the Gulf‐parallel faults, with which they usually merge. Transverse faults dip consistently toward the NE, and their cumulate extensional displacement increases regularly toward the Arta zone, in association with the approximately 300 m elevation of the topography (Figure 9b). Extensional scarp heights measured along the major NE facing faults gradually increase west-ward from 20 m and 50 m (profile 7), to 70 m and 80 m (profile 6), and lastly 70 m, 30 m and 90 m (profile 5). The D/L ratios calculated for transverse faults (21 data) are in the range 0.0056–0.022, i.e., lower than those of the Gulf‐
parallel faults. The low D/L ratios indicate a deficit of ver-tical displacement with respect to fault length, as typically documented during fault growth processes dominated by linkage where fault length increases without increasing height [Cartwright et al., 1995]. This feature is consistent with the isolated, linear and linked characteristics of the transverse faults cited above.
[35] The sketch structural map in Figure 9a shows that very
few transverse and Gulf‐parallel TR‐related faults crosscut the >3 Myr old volcanic terranes forming the Arta zone. In this area, the 8.6–3.8 Myr old Dalha Basalts and the overlying Ribta felsic lavas (3.6 Myr) are involved into a broad, 10 km wide, upright arched structure, oriented N‐S, i.e., nearly orthogonal to the E‐W axis of the TR. This Arta anticline is in turn dissected by a dense network of NS‐N20°E fault/ fractures, parallel to the anticline axis and locally intruded by Figure 8. Map distribution and morphological expression of the extensional fault pattern in the South
Coastal Fault Belt. (a) Structural map from ASTER remote sensing data interpretation. White lines are the traces of the seven topographic cross sections shown in Figures 8b (profiles 1 to 4) and 9b (profiles 5 to 7). (b). Morpho‐structural NS trending cross sections showing increasing structural complexity toward the Arta zone to the west.
felsic bodies of the Ribta Fm. Most of these submeridian fractures were later reactivated as strike‐slip faults [Arthaud et al., 1980]. From these structural relationships, the Arta anticline is inferred to have formed as a magma‐driven structure overlying a felsic intrusion emplaced during the 3.6 Myr Ribta event.
4.6. Timing of Faulting in the Tadjoura Rift
[36] The combination of published and new age
determi-nations on both sedimentary and volcanic rift sequences exposed on the onshore margins of the TR supplies temporal constraints on the sequential development of the Tadjoura half‐graben during the last 3 Myr. The Gulf‐parallel exten-sional fault network in the two coastal belts shows a relatively clear age progression depicted on the NS cross‐sectional diagram in Figure 10a. As already argued by Manighetti et al. [1997], two successive extensional fault sets are evidenced on the northern flank of the TR, i.e., in the NCFB. The most external faults are postdated by 1.4–0.8 Myr old alluvial fans [Gasse, 1991], while younger similarly trending faults
crosscut Holocene conglomerates further south. A quite symmetrical age polarity is documented in the southern margin of the TR, i.e., in the Djibouti Plain, where the oldest tectonic structures are the∼1.7 Myr old Goumarre tectono‐ magmatic lineaments transecting the Somali Basalts. Assuming that these linear structures resulted from extrados tensile stress on top of a regional flexure related to the Tadjoura half‐graben development suggests a similar age (1.7 Myr) for the onset of faulting along the Tadjoura master fault to the north. The Somali flexure is postdated by onlap-ping Gulf Basalts (Ambouli section) which are in turn dissected by Gulf‐parallel faults, necessarily younger than 1.7 Myr, and older than the∼1 Myr old Hayyabley volcano which seals them to the west (Figure 10b). However, younger Gulf‐parallel faults (<1 Myr), in an inner position, crosscut the northern edge of the Hayyabley volcano. Some of these faults likely extend westward into the Ambaddo area, where they might have caused the north dipping tilt of 140–120 ka old reef limestones [Gasse et al., 1983]. From the cross‐ sectional timing framework in the TR (Figure 10a), it thus appears that the age of faulting increases symmetrically away Figure 9. Onshore and offshore structural features in the transfer zone between the Tadjoura and the
Ghoubbet rifts. (a) Structural sketch map showing the nearly underformed nature of the Arta transverse zone during recent (<3 Myr) rift stages. Note that most earthquakes and faults cutting through the Stratoid and Gulf basalts avoid the Arta NS trending zone. The earthquake epicenters are from Doubre [2004], and the focal mechanisms of the 21 December 1978 and 11 August 1978 earthquakes in the Tadjoura Gulf and Ghoubbet trough, respectively, are from Lépine and Hirn [1992]. (b) Morpho‐structural sections crossing the South Coastal Fault Belt, perpendicular to the N140°E transverse fault network (see location in Figure 8a). Numbers refer to faults drawn in the structural map in Figure 8a.
Figure 10. Kinematics of rift propagation throughout the Tadjoura‐Ghoubbet connection zone. (a) Timing of faulting along a synthetic cross section of the Tadjoura Rift. Despite age uncertainties, a pat-tern of younging of strain is observed from the margins to the inner part of the Tadjoura Rift, indicating progressive axial focusing of extension. Abbreviations are: NCFB, Northern Coastal Fault Belt; TMF, Tadjoura master fault; and SCFB, Southern Coastal Fault Belt. (b) Rift kinematic model in the Tadjoura‐ Ghoubbet linkage zone, emphasizing the role of inherited submeridian structures in pinning the propaga-tion of the Tadjoura and Ghoubbet rifts. (c) Sketch rift pattern showing a major submeridian discontinuity at the transition zone between two variously trending rift arms of the Aden plate boundary. The shaded area corresponds to the eastern edge of the Afar magmatic province (the initial 30 Myr old flood basalts of Yemen are not considered). Abbreviations are: A., Arta zone; AS., Ali Sabieh range; GAR, Ghoubbet‐ Asal rift; MIR, Manda‐Inakir rift; OR, Obock rift; and TR., Tadjoura rift.
from the inner rifted zone. The current seismic activity in the offshore part of the TR [Lépine et al., 1980; Hofstetter and Beyth, 2003] fits our proposed age progression of faulting.
5. Proposed Kinematic Model for the <3 Myr
Rift Evolution of the TR
[37] In response to the regional N40°E extension [Jestin
et al., 1994; de Chabalier and Avouac, 1994; Vigny et al., 2007], the TR developed as a 60 × 40 km south facing half‐graben, filled up by a thick pile of syntectonic fissural Gulf Basalts. In map view, the TR rhomb‐shaped structure involves a composite network of dominantly extensional faults, striking EW (Gulf parallel) and NW‐SE. The latter trend occurs in the western termination of the TR at the longitude of approximately 42°45′, i.e., in the northern offshore prolongation of the Arta zone. The TR‐related faults which exclusively involve the Gulf Basalt–filled half‐ graben recorded a complex history within an overall west-erly migration of tectonic activity [Manighetti et al., 1997]. The dating of fault‐controlled volcanic activity (Goumarre) across the flexural margin of the TR half‐graben suggests that the onset of faulting along the master boundary fault to the north occurred at 1.7 Myr, concomitantly with active extension in the Tadjoura inner trough. At this stage, the master fault might have developed a number of splays into the footwall uplifted block (NCFB), probably coeval with localized antithetic faulting along part of the flexure to the south (SCFB). The long‐lived development of the Tadjoura half‐graben was accompanied by the temporal migration from old structures, in an external position, toward younger ones, closer to the Gulf axis. A similar evolution is reported from the Kenya rift, where a temporally progressive focus of strain into a narrow and inner trough has been documented [Baker and Wohlenberg, 1971; Cerling and Powers, 1977; Vétel and Le Gall, 2006]. In addition to cross‐rift migration of faulting, along‐strike fault propagation also occurred, and resulted in contrasted fault patterns in the NCFB and SCFB. In the NCFB, the amount of displacement decreased regu-larly westward along Gulf‐parallel faults, toward a tip line located within the Gulf Basalts. Very few faults extended beyond the Gulf Basalts/substratum boundary, across the Mabla felsic series (Figure 10b). Small‐scale (a few hundreds meters wide) jumping rift segments were assumed to occur in the NCFB [Manighetti et al., 1997], where they turned into a network of en echelon fault swarms which connected the TR and the Ghoubbet rifted trough to the SW These small‐scale rift structures are here regarded as sub-sidiary structures on the northern flank of the TR half‐ graben documented in this work.
[38] A more intricate fault pattern is present in the western
part of the SCFB. There, the Gulf‐parallel extensional faults deviate clockwise, from N90°E to N140°E, when approaching the Arta transverse zone. This fault map cur-vature is accompanied by a marked increase of fault density westward, together with a decrease of individual fault length, hence resulting in the above mentioned over-displaced fault pattern.
[39] Several factors are known to control D/L, such as
(1) strain regime [Gupta and Scholz, 2000], (2)
segmenta-tion and linkage [Cartwright et al., 1995], (3) material properties [Bai and Pollard, 2000] and (4) layer thickness [Soliva et al., 2005]. Manighetti et al. [2001] specifically stated that finite slip‐length profiles of faults in the Afar region are strongly influenced by the fault propagation history. They also argued that restricted faults (D/L > 0.04), resulting from length restriction, formed in response to fault propagation arrest by a “barrier.” This barrier might be related to the earlier history of the region. According to this model, the high D/L values (>0.04) obtained here for the westernmost faults in the SCFB likely indicate that their horizontal growth was limited, or even stopped to the west by a mechanical barrier, while these faults continued to accumulate vertical displacement.
[40] Structural data suggest that strong submeridian
ter-ranes, including the Arta zone, transect orthogonally the western end of the TR (Figure 10b). To the south, these terranes extend toward the Ali Sabieh anticline [Le Gall et al., 2010]. They are bounded to the east by the so‐called Arta‐Asamo discontinuity, the >60 km long map trace of which is outlined by a variety of structures that indicate its long‐lived history. To the north, the decrease of vertical motion along the NW offshore course of the N140°E trans-verse fault network (see Figure 4d) suggests the occurrence of a stronger substratum offshore the Arta zone. The strong mechanical behavior of the Arta transverse zone during recent rifting is also confirmed by (1) the restricted location of earthquakes and aftershocks linked to the 1978 seismic crisis in the Tadjoura gulf [Lépine et al., 1980; Lépine and Hirn, 1992; Doubre, 2004] (Figure 9a), and (2) the abrupt arrest of the EW trending Ghoubbet rift fault network against its NS trending western edge (Figure 10b).
[41] Further south, the continuation of the Arta‐Asamo
discontinuity along the eastern flank of the Ali Sabieh anti-cline is deduced from the restricted distribution of the N80°E Goumarre fault‐dyke corridors which do not penetrate westward into the Ali Sabieh substratum series (Figure 10b). The inherited and deep‐seated origin of the Arta‐Asamo discontinuity is suggested by the NS alignment of Somali (7.2–3.6 Myr) volcanic vents along its inferred map trace (Figure 10b). This discontinuity might have been guided at depth by a large‐scale Proterozoic fracture zone belonging to the Marda system [Boccaletti et al., 1991].
[42] During the recent SE Afar rift history, the Arta
pre-existing submeridian structures are therefore assumed to have provoked the frontal pinning of axial fault growth in the TR, and then the lateral jump of rifting in the Ghoubbet area, in response to inferred higher strength contrast, together with their orthogonal orientation to rift propagation. This abrupt change in rift kinematics probably occurred at circa 900 ka, when diffuse volcanism and associated faulting started in the Asal‐Ghoubbet rift [Manighetti et al., 1998; Audin et al., 2001].
6. Conclusions
[43] The major and trace element analysis of young
basalts collected from onland Tadjoura Rift units (especially from the Djibouti Plain) allows us to distinguish four distinct types, namely the Gulf, Somali, Goumarre and