HAL Id: halshs-01316913
https://halshs.archives-ouvertes.fr/halshs-01316913
Submitted on 17 May 2016
HAL is a multi-disciplinary open access
archive for the deposit and dissemination of
sci-entific research documents, whether they are
pub-lished or not. The documents may come from
teaching and research institutions in France or
abroad, or from public or private research centers.
L’archive ouverte pluridisciplinaire HAL, est
destinée au dépôt et à la diffusion de documents
scientifiques de niveau recherche, publiés ou non,
émanant des établissements d’enseignement et de
recherche français ou étrangers, des laboratoires
publics ou privés.
Mapping public support for further European
unification: a multilevel analysis
Kristel Jacquier
To cite this version:
Kristel Jacquier. Mapping public support for further European unification: a multilevel analysis.
2016. �halshs-01316913�
Documents de Travail du
Centre d’Economie de la Sorbonne
Mapping public support for further European
unification: a multilevel analysis
Kristel J
ACQUIERMapping public support for further European
unification: a multilevel analysis
Kristel JACQUIER
1Abstract:
Using individual-level data from the European Social Survey, a multilevel analysis involving 21 countries was conducted to identify contextual preference formation. We show that individual predictors such as education work differently in different institutional contexts. Contrary to previous finding in the literature we find that the higher the percentage of tertiary education, the smaller the education gap in public support for the EU.
JEL codes: F02, F55
1 Paris School of Economics, Université of Paris I (Panthéon Sorbonne), Paris, France
INTRODUCTION
Most empirical studies on public support focus on membership support2. We argue that levels of
membership support alone do not give an accurate picture of where public opinion stands on the EU. This chapter proposes to document support for further European integration3. In the context of
economic crisis in the EU, some individuals might consider unification of Europe as a positive step but are dissatisfied with the European agenda. To do so, we use a survey question from the European Social Survey (ESS) asking European citizens whether or not European unification should go further using a 0 to 10 scale.
The contribution to the literature is threefold. First a new dataset is exploited; the question of further unification is essential and is not covered by the Eurobarometer survey question traditionally used in the literature. Secondly, the paper contributes to the debate on territorial VS transnational cleavage. Finally, very few empirical studies include a regional dimension to its analysis of public support for the European Union.
A multilevel analysis involving 21 countries was conducted to identify contextual preference formation. Variance components analysis reveals that a multilevel structure is sound although the variance at the region and country levels is negligible compared to the individual level. Individual level predictors confirm that wide divides among social groups exist regarding the EU. Focusing on further integration rather than EU membership support does not lead to a different conclusion in this respect. Highly skilled occupations and high incomes support further European integration a lot more than any other groups. Using random slope we see that individual factors such as education vary from one region to another or one country to another. In the next sections, explanatory variables are included at both levels to see if country and region divides can be explained4. Several predictors stand out: the percentage of tertiary education, the GDP and the percentage of net migration for regions, corruption, young unemployment and social expenditures for countries. As a final step, cross-level interactions are estimated. We find that wage coordination enhances the positive impact of education. Conversely the higher the percentage of tertiary education, the smaller the education gap in public support for the EU.
2
The survey question usually used in the literature is found in the Eurobarometer (surveys carried by the European Union): Generally speaking, do you think that (your country’s) membership in the European Community (Common Market) is a bad thing (1), neither good nor bad (2), or a good thing (3)?
3
In the present text, the terms "integration" and "unification" shall be used indiscriminately. They are regarded as similar concepts.
4
LITERATURE
Lipset and Rokkan (1967) describe two types of political cleavage: National/territorial and transnational/socioeconomic. National cleavages result from the historical, cultural and economic context people live in. Socioeconomic cleavages correspond to social classes (income and education levels mainly) as well as differences based on values (post materialism and cognitive mobilization). The present chapter investigates the economic determinants of public support for European Union and the interaction between national and transnational drivers.
We rely on utilitarian explanations to account for socioeconomic cleavages. This utilitarian theory is based on the assumption that individuals calculate their expected gains from European integration, and the likelihood of positive evaluations is positively related to one's relative human capital (Gabel, 1998b). Gabel and Palmer (1995) and Anderson and Reichert (1995) provide evidence supporting the utilitarian model. They showed that the higher the income, the higher the support for EU membership. Kaltenthaler et al (2004) demonstrate that the most educated have the necessary skills to maximize their earnings in the global economy. Citizens with higher levels of education tend to be greater supporters of pro-market policies because they identify themselves as potential winners of market competition.
As for national cleavages, the study will focus on the economic context. We assume that the EU tends to be evaluated according to the potential added value it might bring to the national situation. Several studies indicatethat citizens evaluate the EU based on macroeconomic performances (Eichenberg and Dalton, 1993; Anderson and Reichert, 1995; Gabel and Palmer, 1995). Indeed, the founders of the EU justified the integration in terms of welfare gains from trade. Nevertheless, the explanatory power of macro-economic predictors has largely decreased over time (Eichenberg and Dalton, 2007). Using Eurobarometer data, they emphasize that the higher the social expenses, the less citizens support EU action on health and social security (Eichenberg and Dalton, 2007:143 and 150). They make the case that many citizens want to preserve their national arrangements, notably social protection. Labor market or social protection policies are at the very root of socio-political compromises that funded post-war European economies. Eichenberg and Dalton also stress the influence of the EMU and its budgetary implications. Indeed, while European policies constrain national governments, there are no welfare state policies at the EU level. Citizens in the largest welfare states are likely to fear a decrease in social spendings as a consequence of European integration (Marks and Steenbergen, 2004). Kvist and Saari, (2007) investigate precisely this constraining effect of European integration on national welfare states (notably through the EMU).
Brinegar and Jolly (2005) make a bridge between national and transnational determinants. They intend to comprehend how national specificities (such as political-economic institutions and factor endowment) can reinforce or mitigate the impact of socioeconomic determinants on EU support5. Using Eurobarometer data, the skill level is taken into account through the frame of national factor endowments (skilled endowment is measured as the percentage of the population completing secondary education) and varieties of capitalism. They predict that in countries relatively well endowed with low-skilled workers, low-skilled workers should support integration, and the opposite would be true in countries with a scarcity of low-skilled labor. Additionally, workers in the most generous welfare states are more likely to perceive integration with a 'race-to-the-bottom' and be less supportive of the EU (Brinegar and Jolly, 2005). They find that skill-based differences are not uniform across countries. In the present study we also investigate how contextual factors mediate the influence of transnational variables that shape individual attitudes towards the EU such as occupational status. We further document the role of national determinants and extend it to test if regions are a relevant level of analysis to understand differences in public support for the EU. There are sound reasons to believe that regional contexts influence public support for the EU. First of all, the geographical location might affect the perception of citizens, for example in cross-border regions. EU support is expected to be stronger in regions hosting EU institutions such as Alsace, the Brussels-Capital region, Luxembourg and Hesse. On the other hand, according to their economic specific characteristics, regions are more or less affected by the EU. Its impact might appear damaging in certain regions. For example EU member-states are responsible for huge transit traffic in Tyrol which is viewed negatively by the Tyrolean people due to the pollution and noise caused by this transit traffic6. Some EU policies are controversial, opposition to the CAP and the Common Fisheries Policy (CFP) is found in the most rural regions, hostility to the CFP is also present in some coastal regions (Landes). Strong dissatisfaction with the EU's reform of the wine sector was expressed in the region of Aquitaine. These differences exist and the literature has highlighted some of them. Perrineau (2005) showed differences of up to 30 percentage points between regions in terms of no votes in France in the 2005 referendum on the EU constitutional treaty. Kaiser (1995) analyzed the 1994 accession referenda in the Nordic countries and finds that inter-regional differences in levels of support reached a 20 percentage point difference. Trouvé (2005) found that French citizens voted markedly against the EU Constitutional Treaty in Aquitaine. Lubbers and Scheepers (2010) build a four-level model to emphasize how trends in political euroscepticism7 vary both at the national and the regional levels. They find deviance from the
country-level trend in four regions. In Greece, dytiki Macedonia shows a weaker decrease in Euroscepticism
5 The authors constructed a new dependent variables labeled Overall European Integration View (OEIV) combining
several dimensions of EU perceptions
6
No stops are necessary to transit freight through the Alps so the positive economic effects for the local alpine population is almost zero
7
compared to the rest of Greece and the opposite is observed in Thessalia. The north of Luxembourg has become more eurosceptical over time than the rest of the country. Finally, the decrease in Euroscepticism is more pronounced in Castilla-La-Mancha than in Spain as a whole. Although Lubbers and Scheepers consider the variance at the regional level, they did not include any variable at the regional level that would help explain those differences.
Our study conveys another important contribution to the literature. Most empirical studies on public support use membership support as a proxy for European integration. We argue that support for membership is not enough to grasp preferences towards the EU. The issue of further integration is critical, especially in the context of economic crisis in the area. Hobolt (2014) investigate the support for deepening, or widening the European Union (further enlargement). The empirical analysis relies on Eurobarometer survey data over the period 2005-2012. Support for deepening is defined as strengthening the EU authority and is measured through support for integration in common foreign and security policy (CFSP) and support for the Economic and Monetary Union (EMU). The focus is on citizens who support deepening but not widening. Hobolt finds that citizens in core Eurozone countries, in net contributor states and in countries experiencing growth are more likely to support further integration, but not enlargement. High skilled workers also support deepening without widening. Their findings are consistent with the utilitarian theory: winners of the integration process want to deepen and reinforce the Union but they do not want to include new member states. Net contributor countries are especially concerned with the additional financial burden poorer member states might bring. These results suggest that economic variables are good predictors of support for further unification. Contrary to what is presented in Hobolt (2014), some individuals might consider unification of Europe as a positive step but are dissatisfied with the course of negative integration8 (Scharpf, 1999). In countries where citizens strongly support membership, a significant number might be unsatisfied with the political agenda of the EU (attitude that would be referred as soft-euroscepticism here) and as a consequence oppose further integration. This is the case in Belgium (Abts et al, 2009). We assume that support for further unification also reflects support for the current political agenda of the Union. Consequently it is reasonable to think that among traditional supporters of the EU, some might find further unification undesirable.
8
THE DATA
The analysis is based on the European Social Survey (ESS) dataset. The program was launched by the European Science Foundation (ESF) and designed to compare social attitudes and values across European countries. The ESS provides a large data sample (at least 1,500 respondents per country) and employs the most rigorous methodologies. Kohler (2007) describes the ESS as the most reliable data for international comparisons. The analysis includes 21 EU member states: Germany, Belgium, Denmark, Spain, Finland, France, United Kingdom, Ireland, Italy, the Netherlands, Portugal, Sweden, Bulgaria, Czech Republic, Hungary, Estonia, Lithuania, Poland, Slovenia, Slovakia and Cyprus. The appendix provides descriptive statistics of the main national trends. We use the most recent wave including multilevel data: ESS6. The individual level data from ESS6 were collected in 2012. Multilevel data are provided to document the context the ESS-respondents live in. Three levels are considered: individuals (the respondents), regions9 and countries10. Data at the regional and national levels are from 2011. We assume that individuals base their preferences on past macroeconomic information. The variables from ESS included in the analysis at the region-level are the percentage of tertiary education, the regional GDP, young unemployment, long-term unemployment and the percentage of net migration by region. Variables at the country-level are also sourced from the ESS: Social expenditure in percentage of GDP 2011, Gini coefficient of equivalised disposable income 2011, Unemployment rates by age 15-24 years in % 2011 and percentage of tertiary education. We use the following survey question:
“Now thinking about the European Union, some say European unification should go further. Others say it has already gone too far. Using this card, what number on the scale best describes your position? “
There are two other sources of data. Eurostat provided two variables (GDP and GDP per capita in Purchasing Power Standards (PPS)). We also use two variables from the Database on Institutional Characteristics of Trade Unions, Wage Setting, State Intervention and Social Pacts provided by Jelle Visser: Union density and coordination of wage-setting. See the appendix for details on the variables and their sources.
9
The regional variables are downloaded every second year. The variables from ESS 6 were downloaded in 2014
10 The selection of variables provided by the ESS is based on the recommendations in the report of the ESS
MULTILEVEL MODELING
Ignoring the multilevel data structure carries possibly incorrect standard errors and inflated Type 1 error rates (the probability of rejecting the null hypothesis although it is true). If the context is ignored, the individuals (N) are considered as independent. However, if individual-level factors are influenced by contextual factors then individuals sampled from the same context are not independent, but clustered. When those effects are not controlled for, the assumption that the errors are independent is violated. Including dummy variables for each subgroup captures the unique variation among the subgroups and standard errors are corrected. However, dummy variables do not explain why the different subgroups vary. Including subgroup level predictors and interacting subgroups characteristics with predictors measured at a lower level of analysis provide information on the behavior of each subgroup. On the other hand, interactive models assume that the subgroup level predictors fully account for subgroup differences11. This is a very strong assumption which is usually not confirmed by the data. Multilevel modeling, as presented in this paper, exploits the theoretical opportunity to explain why subgroups differ and meet the statistical challenge that clustered data presents (Steenbergen and Jones, 2002). We rely on a multilevel model to account for variance in a dependent variable measured at the individual level (support for further unification in the EU) using information from three levels of analysis: individuals, regions and countries. Variance components analysis is run using mixed-effects restricted maximum likelihood (REML) regression. Maximum likelihood parameters are those parameters estimates that maximize the probability of finding the sample data that was actually found.
The variance analysis enables to decompose the variance in EU support:
(1)
Equation (1) is the individual level model. is individual-level variation around this mean. is the mean level of EU support in region in country :
is the overall mean of EU support (the mean across individuals, regions and countries) and is cross-national variation around the mean
.
The national mean for EU support can be written as. Finally, is the region-level variation around this mean.
11
A random error is only incorporated at the lowest level and error components are assumed to be zero at the highest levels of analysis
The variances components are given by (cross-national variation), (regional variation) and (overall variation). If there is no variance at the regional and country levels, then responses from any EU countries and regions are expected to vary from the EU mean respondent in the same way. If there is cross-country and cross-region variance, individuals in different countries and regions will vary together from the EU mean respondent.
As a second step we estimate a linear model and include explanatory variables at the individual level (equation (2)). Although they most certainly play a role, no historical or cultural variables are included in the model; the focus is exclusively on economic factors. is a vector of individual socio-demographic characteristics (age and gender), and the socioeconomic position of individuals (ISCO classification, employment status and employment relation).
(2)
By modeling , regional level predictors can be included:
(3)
Thirdly, country-level drivers are included in the regional-level constant, :
(4)
R and C stand for predictors at the regional and country level respectively.
If we make the assumption that the effect of regional predictors is fixed (we write ) and the effect of the individual-level predictor is fixed as well ( then substituting (3) and (4) into equation (2) yields:
(5)
For both technical and theoretical however, the full model (including both regional and national predictors) presented in equation (5) is never implemented. Instead the predictors at the country and regional levels are included separately:
(Model 1.1) (Model 2) (Model 3.1)
So far, we have made the assumption that the individual-level predictors have fixed effects. Only the intercept was allowed to vary across levels (see figure 1). However, our theoretical framework implies that individual variables have a different impact on public support according to the characteristics of the region and the country respondents live in. To model causal heterogeneity12, we drop the assumption of fixed effects for education:
(Model 1.2)
With , a vector for each explanatory variable at the individual level except education and
Lastly, a model involving interaction terms between the individual level and the national level is estimated:
(Model 3.2)
is a vector for each explanatory variable not interacted with country-level variables. is a vector for individual level variables interacted with the country level variables.
12
Following Western (1998), assuming that individual variables have a different impact according to the context people live in is referred to as "causal heterogeneity" by Steenbergen and Jones (2002)
VARIANCE COMPONENTS ANALYSIS
Table 1 Parameter Estimates Fixed Effects Constant 5.114 (0.149) Variance Components Country-level ( ) 0.437 (0.145) Region-level ( ) 0.215 (0.028) Individual-level ( ) 6.575 (0.048) -2 x Log Likelihood 176514,86***=p >0.01 N= 37161
The intercept-only model (or variance component analysis) is estimated using mixed-effects restricted maximum likelihood (REML) regression on our large sample. Table 1 displays the REML estimates of the grand mean and the variance components. The intercept is 5.114 which is the average answer across all countries, regions and individuals.
As previously found in the literature (Brinegar and Jolly, 2005; Steenbergen and Jones, 2002) the variance component at the individual level explains the largest part of the variance in EU support. The intra-cluster correlations (ICC) are equal to the proportion of the total variance that the variance components at each levels account for13. Individual level variation accounts for 91% of total variation here, countries and regions for 6% and 3% respectively.
In the literature section, we have detailed the main reason why regions matter and we have seen that regional disparities in public support for the EU are wide. Regional-level residuals ( ) and their standard errors were calculated. Figure 1 illustrates that marked differences between regions are present in our data.
13
The ICC formula is: at the individual level, at the region-level, and at the country-level
Figure 1 -4 -2 0 2 4 Me a n sco re R EG IO N S 0 100 200 300
Estimated residuals ranking
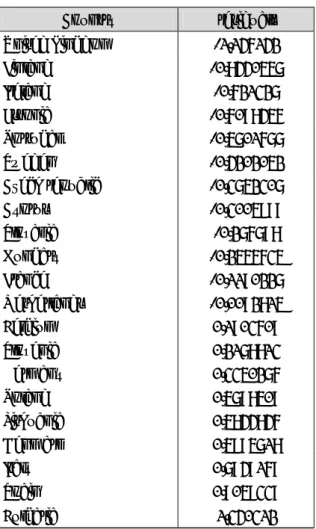
Table 2 presents the ranking of residuals among the 21 countries included in the present study. The United Kingdom has an estimated residual of -1.146. We estimate a mean score of 5.114-1.146=3.968. In contrast, the mean score for Bulgaria is estimated as 5.114+1.34= 6.454. Those results illustrate that cross-country variation in public support for further integration is wide among the countries included in our sample. It is worth noticing that among the least supportive of further integration we now find structurally eurosceptical countries (The UK, Finland, Estonia and Sweden) but also countries that used to be strongly supportive of the EU and suffered from the debt crisis and austerity programs imposed by EU authorities: Ireland, Portugal and Cyprus.
Table 2 Country residuals United Kingdom -1,146142 Finland -0,8440557 Ireland -0,621327 Estonia -0,6098456 Portugal -0,5701677 Sweden -0,4202052 Czech republic -0,3752307 Cyprus -0,3005999 Slovakia -0,276798 Hungary -0,2556635 France -0,1190227 Netherlands -0,0092815 Belgium 0,1903609 Slovenia 0,2178813 Germany 0,3350276 Poland 0,5798509 Lithuania 0,5844846 Denmark 0,5995718 Italy 0,7949169 Spain 0,9059339 Bulgaria 1,340312
The fact that cross-country differences are significant is already acknowledged in the literature. Our aim is to test the main results in the literature on a different sample (including new member states and at a more recent period) and include new variables at the country-level to extend the state of knowledge in the field.
Standard likelihood ratio (LR) test procedures are applied to determine the significance of variance components14. Two models are compared. Model 1 (m1) is a null single level model. Model 2 (m2) is
null but includes 3 levels: individuals, regions and countries.
Large sample Reduced sample
m2-m1: LR = 2471.426 m2-m1: LR= 929.29147 Prob > chi2 = 0 Prob > chi2 = 1.61e-202
In both cases the multilevel model fits better the data.
EXPLANATORY VARIABLES AND MAIN HYPOTHESIS
Socioeconomic determinants include income, occupation, trade union membership and the employment status.
Gabel and Palmer (1995) make the hypothesis that high income citizens are most capable to grasp the opportunities associated with capital market liberalization (investment opportunities and low inflation) and find empirical evidence supporting this assumption. Thus citizens belonging to high income families are expected to be more supportive of the EU than lower incomes. Gabel (2009) assumes that labor market liberalization benefits high-skilled workers because they are in a better position to compete on an international labor market. High-skilled positions such as managers and professionals are expected to be the most supportive occupational categories and low-skilled occupations (plant and machin operators, and elementary workers) to be more eurosceptical. Along with mainstream political parties, most European trade unions had adopted a pro-European position. However, the prospect of a “social Europe” has been challenged by the completion of the internal market, the enlargements and EU legislation such as the Posted Worker Directive (1996)15 (Leconte, 2010). Thus the impact of trade union membership is not clear and might depend on union density. We do not have strong assumptions for every employment status, except for students. The fact that students are the most supportive of European integration is widely acknowledged. Students are expected to strongly support further integration. Unemployed people might also have distinct preferences from paid worker16. Iversen and Soskice (2001) assume that unemployed people need social transfers and are
consequently opposed to policies that might weaken the welfare state. If the process of European integration is seen as encouraging liberalization, then unemployed Europeans would tend to oppose European integration. However, if the EU is able to pursue socioeconomic policies that could help them maximize their chances of finding a job, outsiders such as the unemployed might support the EU (Esping-Andersen, 1999).
Overall, our hypothesis regarding socioeconomic determinants is that the economic policies implemented by the European Union (notably budgetary orthodoxy or liberalization policies) are unlikely to favor low income, low-skilled or people dependent on state generosity.
We test four predictions found in the literature about the national context. Sanchez-Cuenca (2000) showed that levels of national support for integration are higher in countries that suffer greater corruption. The author argues that the worse the opinion of the national political system, the lower the
15 The directive states that firms seconding workers in another member state have to abide by the host country’s conditions in
terms of the minimum legal wage and working time limits. It led to several controversial decisions from the European Court of Justice (ECJ). Trade Unions accused the ECJ of prioritizing market integration over workers’ rights.
opportunity cost of transferring sovereignty to Europe. Thus we expect corruption to increase support for the EU. Kuhn et al (2014) show that growing inequalities are correlated with more euroscepticism especially among the low educated. The present study involves cross-sectional data which means that only the level of income inequality is considered. However, we expect the income inequality to decrease support, especially among the low educated. The study from Brinegar and Jolly (2005), presents two main hypothesis. They assume that the impact of education on public support for the EU will differ according to the skill endowments in the country and the welfare state type17. They predict that in countries relatively well endowed with low-skilled workers, low-skilled workers should support integration, and the opposite would be true in countries with a scarcity of low-skilled labor. Additionally, they expect workers in the most generous welfare states to be less supportive of the EU. These hypotheses will be tested with our data. Social expenses are used as a proxy for welfare state type. We expect respondents with large social expenses to fear a ‘race-to-the-bottom’ between EU countries. Scheve (2000) proposed an interesting theory about the role of wage bargaining. He argues that centralized wage bargaining tends to reduce wage inequality, thus the distributive consequences of integration are mitigated and individuals are less threatened by European integration.The evidence presented in the paper by Scheve implies that the well known skill cleavage in opinion formation over European integration should be attenuated by a high degree of wage bargaining centralization. This hypothesis will be tested on a different sample18.
We also test for the impact of GDP per capita in Purchasing Power Standards, young unemployment, and union density because we expect them to be relevant in the present context . The expected sign is positive for GDP, and negative for young unemployment. In the context of economic crisis in the EU and a lack of solidarity in the euro zone, we expect poor economic performances to erode confidence in the European Union19. Union density is a proxy for the prevalence of trade unions. If unions are strong, they are expected to inform workers about the consequences of further European integration, should it be the opportunities or the risks. In the context of the debt crisis, it is reasonable to expect union density to decrease support for further integration. However, the impact of trade unions might be limited to trade union members.
Additionally, structural factors are included in order to document the socio-economic profiles of a given region and proxy the perceived benefits and costs associated with European integration. We include the percentage of tertiary education, regional GPD and unemployment (long term unemployment and young unemployment). We make the same assumption we made at the country
17
The variable for welfare state type is coded as a continuous value which takes the value 1 for social democratic, 2 for Christian democratic and 3 for residual welfare states.
18
The sample in Scheve (2000) includes Belgium, Denmark, Germany, Greece, Italy, Spain, France, Ireland, Luxembourg, Netherlands, Portugal, United Kingdom, Finland, Sweden and Austria.
19
level. We also include the percentage of net migration and make the assumption that more cosmopolitan regions would be more supportive of further European integration.
RESULTS
INDIVIDUAL LEVEL PREDICTORS
Fixed effects
First, individual level variables are included in the regression. Although the sample is reduced20 compared to table 1 and thus the variance residual cannot be compared directly, one can see that the individual-level predictors explain very little of the individual level variance in EU support. Hooghe and Marks (2005) argue that identity explains a larger part of the variance than economic factors. However, taking into account identity consists in including survey questions that reflect the respondent's opinion21, to explain public support for the EU which is also an opinion. Our focus on economic
variables is an attempt to draw a causal relationship between the objective information available concerning the respondents (age, nationality, gender, income, and occupational status) and preference formation towards the EU. We are aware that including variables such as EU attachment or trust in the European parliament would increase the explained variance. However, these variables are too correlated. For people who do not have a sophisticated opinion on the EU, the three questions are the same but formulated differently. Consequently, we choose not to use such variables and accept that a large part of the variance remain unexplained.
20
This is mainly due to the inclusion of the income decile, this variable has a significant amount of missing variables. Including a proxy for income (the variable HINCFEL which is an income self positioning from "living comfortably on present income" to "very difficult on present income") with less missing values does not alter the results
21
The survey question typically used is: "do you see yourself as...(NATIONALITY) only / (NATIONALITY) and European / European and (NATIONALITY) /European only"
Table 3
Variables Coef Std-error Coef Std-error Coef Std-error female -0.151*** (0.0345) -0.0886** (0.0310) -0.102*** (0.0310) reference category: 25-39
15-24 0.265** (0.0826) 0.305*** (0.0757) 0.337*** (0.0757) 40-54 -0.210*** (0.0451) -0.168*** (0.0443) -0.153*** (0.0444) above 55 -0.128* (0.0520) -0.0302 (0.0513) -0.0558 (0.0512) reference category: paid work
Education 0.444*** (0.103) 0.364*** (0.0856) 0.411*** (0.0858) Unemployed -0.0303 (0.0685) -0.0541 (0.0657) -0.0467 (0.0655) Retired 0.0985 (0.0526) 0.172*** (0.0516) 0.143** (0.0516) Other 0.0370 (0.0574) 0.0425 (0.0540) 0.0414 (0.0539) Member of a trade union -0.127*** (0.0366) -0.146*** (0.0358) -0.147*** (0.0357) reference category: 5th decile
1st decile -0.134 (0.0740) -0.114 (0.0701) -0.133 (0.0701) 2nd decile -0.151* (0.0696) -0.127 (0.0667) -0.135* (0.0665) 3rd decile -0.0237 (0.0685) -0.00791 (0.0660) -0.0182 (0.0658) 4th decile 0.0175 (0.0681) 0.0179 (0.0657) 0.0172 (0.0655) 6th decile 0.122 (0.0689) 0.110 (0.0666) 0.0862 (0.0664) 7th decile 0.135* (0.0691) 0.167* (0.0668) 0.134* (0.0667) 8th decile 0.235*** (0.0711) 0.270*** (0.0687) 0.221** (0.0686) 9th decile 0.197** (0.0739) 0.229** (0.0714) 0.153* (0.0715) 10th decile 0.413*** (0.0751) 0.435*** (0.0720) 0.316*** (0.0726) reference category: clerks Armed forces 0.237 (0.258) Managers 0.312*** (0.0803) Professionals 0.454*** (0.0664) Associate professionals 0.0419 (0.0675) Serv and sales -0.0878 (0.0653) Agri, forestry and fishery -0.367** (0.120) Trade workers -0.265*** (0.0724) Plant and machin operators -0.285*** (0.0765) Elementary occupations -0.206** (0.0726) ref cat: ES-ISCED III upper tier
ES-ISCED I -0.300*** (0.0653)
ES-ISCED II -0.274*** (0.0514)
ES-ISCED III lower tier -0.270*** (0.0539)
ES-ISCED IV -0.00849 (0.0543)
ES-ISCED V lower terciary 0.345*** (0.0599) ES-ISCED V higher terciary 0.741*** (0.0567) Years of education 0.0729*** (0.00457)
1.1.1 1.1.2 1.1.3
Constant 5.209 (0.173) 4.153 (0.175) 5.126 (0.161) Variance components Country-level 0.436 (0.150) 0.435 (0.149) 0.402 (0.139) Region-level 0.226 (0.0328) 0.223 (0.0319) 0.217 (0.0311) Individual level 6.449 (0.0566) 6.409 (0.0544) 6.384 (0.0541) N 26286 28059 28125
Most variables are strongly significant and confirm that a wide divide among social groups exists when it comes to European integration. Model 1.1.1 tends to prove that social groups reluctant to further European integration are the same who traditionally fear liberalization, i.e. manual workers. Compared to the reference category (clerks), plants and machine operators support further integration less (by 0.29), so do elementary occupations (0.20). Conversely, working as a manager raise support by 0.31 and as a professional 0.45. Even though occupational clusters are taken into account, the highest income categories remain significantly more in favor of the European process (+0.4) than medium or low income ones. Trade union membership is significant and unionized workers are less supportive of further integration than their non-unionized counterparts (-0.13) points (in the 0-10 scale). As predicted, respondents in education are heavily supportive of the European Union. Being a student raises support by 0.44.
Model 1.1.2 is similar to model 1.1.1, except that a continuous variable is included to account for the educational level of respondents instead of occupational categories. The impact is strongly significant and the impact of an additional year of education is 0.073. Since education ranges from 0 to 51, the predicted difference between the least educated and the most educated is 51*0.073=3.723 which is considerable. Model 1.1.3 proposes an alternative measure of education, using ES-ISCED classification. Compared to the reference category, lower education decreases support and higher education enhances it.
Overall, we do not find any difference with respect to the existing literature. We confirm the results from Hobolt (2014) that supporters of deepening are traditional winners of the integration process.
Random effects
To model the different impact of individual variables on public support according to the characteristics of the region and the country respondents live in, we drop the assumption of fixed effects. The coefficient of the number of years of education completed is allowed to vary across levels.
Table 4
Variables Coef Std-error
female -0.0795* (0.0310) reference category: 25-39 15-24 0.311*** (0.0757) 40-54 -0.169*** (0.0443) above 55 -0.0315 (0.0513) Years of education 0.0695*** (0.00866)
reference category: paid work
Education 0.357*** (0.0856) Unemployed -0.0534 (0.0656) Retired 0.166** (0.0517) Other 0.0389 (0.0540)
Member of a trade union -0.143*** (0.0358)
reference category: 5th decile
1st decile -0.133 (0.0704) 2nd decile -0.128 (0.0667) 3rd decile -0.00797 (0.0660) 4th decile 0.0187 (0.0657) 6th decile 0.112 (0.0665) 7th decile 0.165* (0.0668) 8th decile 0.269*** (0.0686) 9th decile 0.228** (0.0714) 10th decile 0.434*** (0.0722) Constant 4.185*** (0.204) 1.2
Variance components Coef Std-error
Country level Education 0.000830 (0.000456) Constant 0.598 (0.235) Constant, education -0.604 (0.312) Region level Education 0.00151 (0.000587) Constant 0.603 (0.145) Constant, education -1,165 (0.201) individual level 6.381 (0.0544)
In this model the variable “years of education” consists of two parts, a fixed and a random part. The fixed part is the expected value across all countries and regions (+0.069). The random part is a random coefficient following a normal distribution. We calculate its standard error to estimate a confidence interval which indicates how the coefficient varies from one country to another or from one region to another.
At the country level, the variance of the variable education is estimated at 0.00083. Its standard deviation is 0.029. With normally distributed observations 95% of the observations lie between two standard deviations below and above the mean. Consequently, 95% of the regression coefficients are expected to lie between (0.069-0.057)=0.012 and (0.069+0.057)=0.126
At the region level, the variance is estimated at 0.0015, so the standard deviation is 0.0387. 95% of the regression coefficients are expected to lie between (0.069-0.0774)=-0.0084 and (0.069+0.0774)=0.1464 The predictive intervals express that 95% of the regression coefficients of the variable “years of education” are predicted to lie between 0.012 and 0.126 at the country level and -0.0084 and 0.1464 at the region level. We observe a large and significant variance of the regression coefficient of education across both countries and regions.
Although they are not presented here, other variables were found to vary across levels, notably income and trade union membership.
REGIONAL LEVEL ANALYSIS
Due to data availability, a reduced sample including only 9 countries22 (around 17 000 observations) is used to document regional differences in EU support.
Five fixed effect predictors are included in order to explain region-level variation: the percentage of tertiary education, the regional GDP, regional young unemployment and long term unemployment, as well as the percentage of net migration by region. A null model of the reduced sample (including 16229 observations) estimates the variance component at the regional level at 0.1223. Thus the
variance components are largely reduced with the inclusion of regional predictors (0.0448 in model 7). As predicted, the percentage of net migration, tertiary education and GDP all have a positive impact of EU support (model 2, 3, 6 and 7). Conversely, regional unemployment does not seem to affect support in the EU, neither young unemployment or long term unemployment are significant in model 4 and 5.
22 Belgium, Denmark, Germany, Spain, France, The UK, Italy, Netherlands and Sweden 23
Table 5
Variables Coef Std-error Coef Std-error Coef Std-error female -0.139** (-2.69) -0.131* (-2.31) -0.136** (-2.63) reference category: 25-39
15-24 0.168 (1.42) 0.179 (1.36) 0.177 (1.49) 40-54 -0.205** (-3.03) -0.198** (-2.69) -0.202** (-2.98) above 55 -0.161* (-2.10) -0.111 (-1.31) -0.155* (-2.01) reference category: clerks
Armed forces 1.166** (2.98) 1.159** (2.81) 1.184** (3.03) Managers 0.461*** (4.07) 0.472*** (3.89) 0.465*** (4.12) Professionals 0.699*** (7.50) 0.779*** (7.77) 0.698*** (7.48) Associate professionals 0.167 (1.77) 0.172 (1.71) 0.167 (1.78) Serv and sales -0.0506 (-0.54) -0.136 (-1.33) -0.0454 (-0.48) Agri, forestry and fishery -0.0651 (-0.35) -0.0101 (-0.05) -0.0499 (-0.27) Trade workers -0.188 (-1.71) -0.148 (-1.24) -0.178 (-1.62) Plant and machin operators -0.367** (-2.98) -0.299* (-2.23) -0.362** (-2.94) Elementary occupations -0.186 (-1.68) -0.219 (-1.86) -0.178 (-1.61) reference category: paid work
Education 0.628*** (4.54) 0.656*** (4.20) 0.628*** (4.54) Unemployed -0.00833 (-0.07) -0.0872 (-0.72) -0.00158 (-0.01) Retired 0.278*** (3.49) 0.263** (3.02) 0.279*** (3.51) Other 0.00478 (0.06) 0.0452 (0.51) 0.00229 (0.03) Member of a trade union -0.0812 (-1.49) -0.0245 (-0.42) -0.0711 (-1.31) reference category: 5th decile
1st decile -0.118 (-1.02) -0.0724 (-0.58) -0.108 (-0.93) 2nd decile -0.103 (-0.98) -0.111 (-0.98) -0.0947 (-0.90) 3rd decile 0.0866 (0.81) 0.106 (0.91) 0.0963 (0.90) 4th decile -0.0192 (-0.18) 0.00898 (0.08) -0.0141 (-0.13) 6th decile 0.164 (1.58) 0.173 (1.55) 0.167 (1.62) 7th decile 0.198 (1.91) 0.229* (2.06) 0.199 (1.93) 8th decile 0.149 (1.42) 0.213 (1.86) 0.147 (1.40) 9th decile 0.306** (2.81) 0.402*** (3.33) 0.310** (2.86) 10th decile 0.506*** (4.63) 0.550*** (4.59) 0.503*** (4.62) % of tertiary education by region 0.102** (3.04)
log of regional GPD (current price) 0.720*** (4.83) Constant 5.042*** (18.10) 4.680*** (14.57) -2.420 (-1.54) Variance components Country-level 0.493 (-1.29) 0.488 (-1.21) 0.537 (-1.14) Region-level 0.0672 (-8.65) 0.0542 (-7.19) 0.0385 (-7.72) Individual level 6.369 (139.79) 6.580 (132.40) 6.370 (139.81) N 11540 10006 11540 2.1.1 2.1.2 2.1.3 t statistics in parentheses * p<0.05, ** p<0.01, *** p<0.001
Table 6
Variables Coef Std-error Coef Std-error Coef Std-error Coef Std-error female -0.137* (-2.42) -0.131* (-2.32) -0.136** (-2.62) -0.125* (-2.20) reference category: 25-39
15-24 0.160 (1.21) 0.173 (1.32) 0.169 (1.43) 0.183 (1.39) 40-54 -0.203** (-2.75) -0.202** (-2.74) -0.204** (-3.01) -0.196** (-2.66) above 55 -0.123 (-1.45) -0.116 (-1.38) -0.166* (-2.16) -0.112 (-1.32) reference category: clerks
Armed forces 1.256** (3.02) 1.158** (2.81) 1.156** (2.96) 1.172** (2.85) Managers 0.460*** (3.78) 0.472*** (3.89) 0.454*** (4.01) 0.468*** (3.85) Professionals 0.774*** (7.70) 0.783*** (7.81) 0.692*** (7.41) 0.774*** (7.70) Associate professionals 0.164 (1.62) 0.173 (1.72) 0.162 (1.72) 0.167 (1.65) Serv and sales -0.142 (-1.38) -0.136 (-1.34) -0.0480 (-0.51) -0.130 (-1.27) Agri, forestry and fishery -0.0315 (-0.16) -0.0245 (-0.12) -0.0565 (-0.31) 0.00284 (0.01) Trade workers -0.161 (-1.35) -0.153 (-1.29) -0.189 (-1.71) -0.146 (-1.23) Plant and machin operators -0.290* (-2.16) -0.302* (-2.25) -0.362** (-2.94) -0.291* (-2.17) Elementary occupations -0.233* (-1.97) -0.219 (-1.86) -0.186 (-1.68) -0.214 (-1.81) reference category: paid work
Education 0.662*** (4.21) 0.657*** (4.21) 0.613*** (4.42) 0.643*** (4.10) Unemployed -0.0980 (-0.81) -0.0819 (-0.68) -0.00728 (-0.06) -0.0821 (-0.68) Retired 0.261** (2.98) 0.263** (3.02) 0.286*** (3.58) 0.272** (3.11) Other 0.0547 (0.62) 0.0423 (0.48) 0.00249 (0.03) 0.0390 (0.44) Member of a trade union -0.0269 (-0.46) -0.0226 (-0.39) -0.0839 (-1.54) -0.0213 (-0.36) reference category: 5th decile
1st decile -0.0665 (-0.53) -0.0705 (-0.57) -0.105 (-0.90) -0.0565 (-0.45) 2nd decile -0.111 (-0.98) -0.110 (-0.97) -0.0966 (-0.91) -0.0955 (-0.84) 3rd decile 0.119 (1.02) 0.108 (0.93) 0.0831 (0.77) 0.108 (0.93) 4th decile 0.0110 (0.10) 0.00986 (0.09) -0.0239 (-0.23) 0.00635 (0.06) 6th decile 0.162 (1.44) 0.169 (1.51) 0.161 (1.55) 0.172 (1.53) 7th decile 0.224* (2.01) 0.222* (2.00) 0.186 (1.79) 0.213 (1.92) 8th decile 0.229* (1.99) 0.206 (1.80) 0.139 (1.32) 0.197 (1.71) 9th decile 0.394** (3.25) 0.391** (3.23) 0.311** (2.86) 0.403*** (3.33) 10th decile 0.560*** (4.65) 0.547*** (4.56) 0.501*** (4.59) 0.540*** (4.50) % of tertiary education by region 0.0374 (0.93) log of regional GPD (current price) 0.622** (3.06) Regional young unemployment (%) -0.00283 (-0.34) Regional long term unemployment (%) -0.0220 (-0.85) % of net migration by region 0.252* (2.06) -0.0553 (-0.40) Constant 5.117*** (15.32) 5.124*** (16.50) 4.966*** (17.44) -1.477 (-0.72) Variance components Country-level 0.498 (-1.17) 0.504 (-1.15) 0.507 (-1.24) 0.515 (-1.12) Region-level 0.0720 (-7.32) 0.0685 (-7.37) 0.0624 (-8.40) 0.0448 (-6.79) Individual level 6.572 (131.83) 6.579 (132.38) 6.370 (139.52) 6.582 (132.12) N 9936 10006 11493 9959 2.1.4 2.1.5 2.1.6 2.1.7 t statistics in parentheses * p<0.05, ** p<0.01, *** p<0.001
COUNTRY LEVEL PREDICTORS
As previously mentioned, variables at the region level were systematically available only for 9 countries. Additionally, we choose not to include regional explanatory variables in the same regression because regional and national variables might blend (National GDP for example is a linear combination of regional GDP). Thus, in the next sections, region level predictors are not included and the larger sample (including 21 countries) is used.
Fixed effects
As a first step, national predictors are included as fixed effects. Indeed, a coefficient is calculated for the whole sample and the impact of variables are not allowed to vary from one country to another. We tested for the impact of GDP per capita in Purchasing Power Standards, the percentage of tertiary education, the corruption index, young unemployment, Gini coefficients, the degree of wage coordination and union density. However, only three variables have a significant impact on EU support. They are presented in table 7. Higher scores stand for lower corruption in the Transparency International Corruption Perception Index, thus, a negative sign is interpreted as high corruption increases support for further European integration. When the index increase by 1 point (corruption decreases) support for further integration drops by 0.268. Young unemployment is only significant at 10% and as expected higher young unemployment decreases EU support. Since the percentage of young unemployment ranges from 7.6% to 46.4% the highest unemployment rate might decrease support by 1.38 point on the 0-10 EU support scale. Finally, the higher social expenditures, the more citizens support further integration which challenges our hypothesis.
Table 7
Variables Coef Std-error
female -0.130*** (-3.53)
reference category: 25-39
15-24 0.221* (2.55)
40-54 -0.222*** (-4.65)
above 55 -0.153** (-2.77) Member of a trade union -0.153*** (-3.92)
reference category: clerks
Armed forces 0.433 (1.54) Managers 0.345*** (4.08) Professionals 0.506*** (7.22) Associate professionals 0.0623 (0.88) Serv and sales -0.0718 (-1.04) Agri, forestry and fishery -0.317* (-2.50) Trade workers -0.251** (-3.26) Plant and machin operators -0.299*** (-3.65) Elementary occupations -0.197* (-2.52)
reference category: paid work
Education 0.469*** (4.48) Unemployed 0.0130 (0.18)
Retired 0.120* (2.13)
Other -0.00919 (-0.15)
reference category: 5th decile
1st decile -0.140 (-1.74) 2nd decile -0.154* (-2.09) 3rd decile -0.0492 (-0.68) 4th decile 0.00660 (0.09) 6th decile 0.137 (1.90) 7th decile 0.147* (2.02) 8th decile 0.225** (3.00) 9th decile 0.222** (2.84) 10th decile 0.436*** (5.43) Corruption -0.268** (-3.11) Young unemployment -0.0356 (-1.85) Social expenditures 0.0767* (2.32) Constant 5.760*** (6.11) 3.1
Variance components Country-level 0.188*** (-4.45) Region-level 0.136*** (-11.29) Individual level 6.365*** (196.54) N 22795 Cross-level interactions
Model 3.2 in table 8 presents comprehensive models including 3 levels of analysis and interaction terms between individual and national predictors. Our aim is to document how national institutions affect the perception of the costs and benefits of European integration.
In the presence of a significant interaction the effect of the interaction variable and the direct effects of the explanatory variables that make up that interaction must be interpreted together as a system. Thus both direct effects are included in the regression, even though they are not systematically significant. The regression slope of one of the direct variables is the expected value of the regression coefficient for the case that the other variable is equal to zero, and vice versa. If the observed values of one variable do not include zero, then the regression coefficient for the other variable has no substantive interpretation. We present average marginal effects for each interaction terms.
The differentiated impact of education is investigated according to the degree of wage coordination in a country24 and the percentage of tertiary education. The results concerning wage setting coordination
do not confirm the assumption of Scheve (2000). Once interacted with years of education, one can see that the more coordinated wage bargaining is the more education enhances support for further European integration (figure 3). Education is also interacted with the percentage of tertiary education. Following Brinegar and Jolly (2005), in countries with a high share of highly educated workers, the low skilled are expected to display a lower support for European integration than countries less endowed with skills. A higher percentage of tertiary education should reinforce the positive impact of education on support. However the regression coefficient is negative and figure 5 shows that education has a positive and significant impact but this impact is mitigated by the percentage of tertiary education. In sum, a high percentage of tertiary education mitigates the positive impact of education on support in our sample.
24
Table 8
Variables Coef Std-error Coef Std-error female -0.153*** (-4.19) -0.0865** (-2.79)
reference category: 25-39
15-24 0.201* (2.32) 0.309*** (4.08) 40-54 -0.228*** (-4.82) -0.173*** (-3.89) above 55 -0.162** (-2.97) -0.0328 (-0.64) Member of a trade union -0.0264 (-0.41) -0.145*** (-4.06)
reference category: clerks
Armed forces 0.320 (1.12) Managers 0.310*** (3.71) Professionals 0.472*** (6.83) Associate professionals 0.0568 (0.81) Serv and sales -0.0688 (-1.01) Agri, forestry and fishery -0.290* (-2.31) Trade workers -0.267*** (-3.51) Plant and machin operators -0.314*** (-3.88) Elementary occupations -0.202** (-2.64)
reference category: paid work
Education 0.468*** (4.42) 0.361*** (4.21) Unemployed -0.0117 (-0.16) -0.0553 (-0.84) Retired 0.130* (2.33) 0.170** (3.29)
Other 0.0195 (0.32) 0.0423 (0.78)
reference category: 5th decile
1st decile -0.186* (-2.33) -0.129 (-1.84) 2nd decile -0.174* (-2.41) -0.134* (-2.02) 3rd decile -0.0487 (-0.68) -0.0114 (-0.17) 4th decile -0.0188 (-0.26) 0.0159 (0.24) 6th decile 0.118 (1.65) 0.109 (1.64) 7th decile 0.131 (1.81) 0.165* (2.47) 8th decile 0.203** (2.71) 0.264*** (3.85) 9th decile 0.204** (2.63) 0.227** (3.17) 10th decile 0.415*** (5.27) 0.435*** (6.04) Union density -0.00157 (-0.23) UnionmembershipXUniondensity -0.00445* (-2.54) Years of education 0.0421*** (4.65) Coordination of wage setting -0.127 (-1.11) EducationXCoordination 0.0110*** (3.95) Constant 5.245*** (20.22) 4.513*** (13.40)
3.2.1 3.2.2
Variance components Country-level 0.326 (-3.16) 0.407 (-2.68) Region-level 0.126 (-12.36) 0.222 (-10.52) Individual level 6.443 (202.05) 6.401 (218.71) N 23723 28059 3.2.1 3.2.2 Table 9
Variables Coef Std-error Coef Std-error
female -0.0840** (-2.71) -0.0879** (-2.83)
reference category: 25-39
15-24 0.301*** (3.97) 0.308*** (4.07)
40-54 -0.171*** (-3.86) -0.169*** (-3.81)
above 55 -0.0319 (-0.62) -0.0312 (-0.61)
Member of a trade union -0.146*** (-4.09) -0.144*** (-4.03)
reference category: paid work
Education 0.357*** (4.17) 0.364*** (4.25) Unemployed -0.0574 (-0.87) -0.0524 (-0.80)
Retired 0.164** (3.18) 0.172*** (3.33)
Other 0.0431 (0.80) 0.0427 (0.79)
reference category: 5th decile
1st decile -0.107 (-1.53) -0.124 (-1.76) 2nd decile -0.123 (-1.85) -0.130 (-1.95) 3rd decile -0.00647 (-0.10) -0.0108 (-0.16) 4th decile 0.0182 (0.28) 0.0174 (0.26) 6th decile 0.110 (1.65) 0.110 (1.65) 7th decile 0.168* (2.51) 0.165* (2.47) 8th decile 0.271*** (3.96) 0.267*** (3.89) 9th decile 0.234** (3.28) 0.227** (3.18) 10th decile 0.441*** (6.12) 0.434*** (6.03) Years of education 0.155*** (6.94) 0.153*** (4.02) Percentage of tertiary education 0.157 (0.81)
EducationXtertiaryeducation -0.0188*** (-3.75) Gini coefficient 0.103* (2.34) EducationXGinicoefficient -0.00275* (-2.12) Constant 3.475*** (4.00) 1.176 (0.92) 3.2.3 3.2.4 t statistics in parentheses * p<0.05, ** p<0.01, *** p<0.001
Variance components Country-level 0.406 (-2.69) 0.354 (-3.04) Region-level 0.220 (-10.56) 0.223 (-10.49) Individual level 6.402 (218.72) 6.404 (218.76) N 28059 28059 3.2.4 3.2.5
As stated before, belonging to a trade union has a negative impact on support for further European unification. Now we see that this negative impact increases with union density25(figure 2). The fact that the coefficient for membership alone is not significant has no straightforward interpretation. The coefficient for union membership in regression 3.2.1 refers to a country where union density is zero which is an extreme value, not observed in the data. However, one can infer that the negative impact of union membership is driven by countries where trade unions are strong and play a part in the debate over European integration.
Finally, the impact of inequalities is considered. In the previous section we find no significant impact of the level of income inequalities (gini index26) on support for further unification. Now we consider the
impact of inequalities according to the education level. Inequalities are expected to decrease support for further European integration for the low skilled (Kuhn et al, 2014). However, we find the opposite effect. The coefficient in model 3.2.4 indicates that higher inequalities mitigate the positive impact of education on public support for the EU. If education equals to zero, inequalities increase support (0.103). This should not be interpreted as positive impact of inequalities on EU feelings. Figure 6 in the appendix show that income inequalities do not have a significant impact on support for further unification except under 10 years of education. However figure 4 reveals that income inequalities reduces the positive impact of education on support for further unification. Empirical evidence prove that the educational divide is weaker in countries where inequalities are higher.
25 To facilitate the interpretation, union density was standardized 26
Figure 2 -. 6 -. 4 -. 2 0 Ef fe ct s o n L in e a r Pre d ict io n , F ixe d Po rt io n -1.05 -.55 -.05 .45 .95 1.45 1.95
Standardized values union density
Average Marginal Effects of trade union membership with 95% CIs
Figure 3 .0 4 .0 6 .0 8 .1 .1 2 Ef fe ct s o n L in e a r Pre d ict io n , F ixe d Po rt io n 1 2 3 4 5
Coordination of wage setting
Figure 4 .0 4 .0 6 .0 8 .1 .1 2 Ef fe ct s o n L in e a r Pre d ict io n , F ixe d Po rt io n 20.00 25.00 30.00 35.00
Gini coefficient of equivalised disposable income 2011
Average Marginal Effects of education with 95% CIs
Figure 5 0 .0 5 .1 .1 5 Ef fe ct s o n L in e a r Pre d ict io n , F ixe d Po rt io n 3 3.5 4 4.5 5 5.5 6 6.5
Percentage of tertiary education (country)
Overall, our results challenge previous results in the literature. The most straightforward explanation is the composition of the sample. Our sample is much larger than previous studies and includes central and eastern member states. The preferences of new member states are likely to be distinct because of their communist past and their emerging economies. The time period is also different from most of the literature we refer to. Data were collected in 2012 and the crisis might have affected public opinion temporarily or even permanently. Thirdly our dependant variable focuses on support for further European integration. Respondents who are opposed to it involve hard and soft eurosceptical and as such might blend different socioeconomic profiles. Finally there might be a technical reason for some counter-intuitive results. As one can see in the appendix, variables at the country-level do not vary strongly from one country to another. For example, the Gini coefficient or the percentage of tertiary education, are concentrated around the same values which might reflect a convergence within the EU. The former economic gaps are narrowing and fail to explain political attitudes towards the EU.
ROBUSTESS CHECKS
So far, our dependent variable was treated as linear. To make sure that our results are not sensitive to the choice of a linear specification, an ordered logit regression is estimated. The eleven original categories (from 0 to 10) were re-coded to five27. The estimated equation can be defined as:
(1)
and are parameters to be estimated and is the latent variable, i.e. the intensity of the support for the European integration. D is a vector of individual socio-demographic characteristics (age and gender). E measures the socioeconomic position of individuals (ISCO classification, employment status and employment relation). C and R are a country and region dummies which accounts for any omitted country-specific and region-specific influences. is the error term.
We do not observe , but a variable that goes from 1 to 5 and rises when public support for the European Union rises:
if
For Where are thresholds, with and
To facilitate the interpretation of the results, odd ratios are provided instead of coefficients. The odd ratio represents the odds that an event will occur given a particular exposure, compared to the odds of the outcome occurring in the absence of that exposure. Odd ratios allow to compare dummy variables in a meaningful way (within the same regression, the magnitude of coefficients is comparable). For example, an odd ratio of 0.5 for the dummy variable "female" means that, holding all other variables constant, the odds of having more negative attitudes toward European integration are half as large for women as for men.
The results on individual predictors are unchanged. Tables are presented in the appendix.
CONCLUSION
Using a new dataset this chapter contributes to the debate on territorial versus transnational cleavage thanks to a multilevel structure and the inclusion of explanatory variables at three levels. Our focus on a new dependent variable (support for further integration) does not challenge what is usually found in the literature; highly skilled occupations and high incomes support further European integration a lot more than any other groups. Although its influence is modest, the regional dimension exists and influences public support for further European integration. We find three relevant predictors: the percentage of tertiary education, the regional GDP and the percentage of net migration. The role played by countries is well-documented in the literature and confirmed in the present study. Several macroeconomic variables are found to influence support within member states (corruption, young unemployment and social expenditures) and our results confirm that individual-level predictors work differently in different institutional contexts. Education has a positive and significant impact and this impact is increased by wage setting coordination but mitigated by income inequalities. Additionally in our sample, the higher the percentage of tertiary education, the smaller the education gap in public support for the EU. Our results challenge previous findings in the literature. The most likely explanation is that the opinion of citizens in the new member states is not shaped by the same drivers.
REFERENCES
Abts, K., Heerwegh, D., & Swyngedouw, M. (2009). Sources of Euroscepticism: utilitarian interest, social distrust, national identity and institutional distrust. World Political Science Review, 5(1).
Brinegar, A. P., & Jolly, S. K. (2005). Location, Location, Location National Contextual Factors and Public Support for European Integration. European Union Politics, 6(2), 155-180.
Esping-Andersen, G. (1999). Social foundations of postindustrial economies. Oxford University Press. ESS Round 6: European Social Survey Round 6 Data (2012). Data file edition 2.1. Norwegian Social Science Data Services, Norway – Data Archive and distributor of ESS data for ESS ERIC.
Gabel, M. J. (2009). Interests and integration: Market liberalization, public opinion, and European Union. University of Michigan Press.
Hobolt, S. B. (2014). Ever closer or ever wider? Public attitudes towards further enlargement and integration in the European Union. Journal of European Public Policy, 21(5), 664-680.
Hooghe, L., & Marks, G. (2005). Calculation, community and cues public opinion on European integration. European Union Politics, 6(4), 419-443.
Inglehart, R. (1990). Culture shift in advanced industrial society. Princeton University Press.
Kuhn, T., van Elsas, E., Hakhverdian, A., & van der Brug, W. (2014). An ever wider gap in an ever closer union: Rising inequalities and euroscepticism in 12 West European democracies, 1975–2009. Socio-Economic Review, mwu034.
Lipset, Seymour Martin; Rokkan, Stein (1967). Party systems and voter alignments: cross-national perspectives. Free Press. p. 554.
Long J. S. & Freese J. (2006). Regression Models for Categorical Dependent Variables using Stata, 2nd Edition. Stata Press books, StataCorp LP.
Lubbers, M., & Scheepers, P. (2010). Divergent trends of euroscepticism in countries and regions of the European Union. European Journal of Political Research, 49(6), 787-817.
Marks, G., & Steenbergen, M. R. (2004). European integration and political conflict. Cambridge University Press.
Perrineau, P. (2005) ‘Le referendum français du 29 mai 2005. L’irrésistible nationalisation du vote européen’, in P. Perrineau (ed.) Le vote européen 2004-2005. De l’élargissement au referendum français (Paris: Presses de Sciences Po
Sánchez-Cuenca, I. (2000). The political basis of support for European integration. European Union Politics, 1(2), 147-171.
Scheve, K. (2000). Comparative context and public preferences over regional economic integration. In Annual Meeting of the American Political Science Association, Washington, DC (Vol. 31).
Steenbergen, M. R., & Jones, B. S. (2002). Modeling multilevel data structures. american Journal of political Science, 218-237.
J. Visser, ICTWSS Data base. version 5.0. Amsterdam: Amsterdam Institute for Advanced Labour Studies AIAS. October 2015.