HAL Id: hal-01634506
https://hal.archives-ouvertes.fr/hal-01634506
Submitted on 10 Jan 2018HAL is a multi-disciplinary open access archive for the deposit and dissemination of sci-entific research documents, whether they are pub-lished or not. The documents may come from teaching and research institutions in France or abroad, or from public or private research centers.
L’archive ouverte pluridisciplinaire HAL, est destinée au dépôt et à la diffusion de documents scientifiques de niveau recherche, publiés ou non, émanant des établissements d’enseignement et de recherche français ou étrangers, des laboratoires publics ou privés.
Chain-Melting and Surface-Melting Process of the
Hydrogen Bonds
Anne-Laure Fameau, Fabrice Cousin, Arnaud Saint-Jalmes
To cite this version:
Anne-Laure Fameau, Fabrice Cousin, Arnaud Saint-Jalmes. Morphological Transition in Fatty Acid Self-Assemblies: A Process Driven by the Interplay between the Chain-Melting and Surface-Melting Process of the Hydrogen Bonds. Langmuir, American Chemical Society, 2017, 33 (45), pp.12943-12951. �10.1021/acs.langmuir.7b02651�. �hal-01634506�
Morphological transition in fatty acids self-assemblies: a process driven by
the interplay between the chain melting and the surface melting process of
the hydrogen bonds.
Anne-Laure Fameau 1*, Fabrice Cousin 2 and Arnaud Saint-Jalmes 3
1) Biopolymères Interactions Assemblages Inra, la Géraudière, 44316 Nantes, France. 2) Laboratoire Léon-Brillouin, CEA Saclay, 91191 Gif-sur-Yvette CEDEX, France.
3) Institut de Physique de Rennes, UMR CNRS 6251 -Université Rennes 1, Rennes, France.
Corresponding author :
Anne-Laure Fameau, email: anne-laure.fameau@nantes.inra.fr
Abstract:
In surfactant systems, the major role of the nature of the counter-ion on the surfactant behavior is well-known. However, the effect of the molar ratio between the surfactant and its counter-ion is less explored in the literature. We investigated the effect of the molar ratio (R) between 12-hydroxystearic acid (12-HSA) and various alkanolamines as a function of the temperature in aqueous solution from the molecular scale to the mesoscale.
By coupling microscopy techniques and small angle neutron scattering, we showed that 12-HSA self-assembled into multilamellar tubes and transitioned into micelles at a precise temperature. This temperature transition depended on both the molar ratio and the alkyl chain length of the counter-ion and could be precisely tuned from 20°C to 75°C. This thermal behaviour was investigated by differential scanning calorimetry and wide angle X-ray scattering. We highlighted that the transition at the supramolecular scale between tubes to micelles came from two different mechanisms at the molecular scale as a function of the molar ratio. At low R, with an excess of counter-ion, the transition came from the chain melting phenomenon. At high R, with an excess of 12-HSA, the transition came from both the chain melting process and the surface melting process of the hydrogen bonds.
At the mesoscale, this transition of supramolecular assemblies from tubes to micelles, delimited a regime of high bulk viscosity, with a regime of low viscosity.
2 3 4 5 6 7 8 9 10 11 12 13 14 15 16 17 18 19 20 21 22 23 24 25 26 27 28 29 30 31 32 33 34 35 36 37 38 39 40 41 42 43 44 45 46 47 48 49 50 51 52 53 54 55 56 57 58 59
Keywords:
Lipid tubes, counter-ion, molar ratio, chain melting, hydrogen bonds.
Introduction:
In surfactant science, the main parameter known to dictate surfactant properties is the nature of the surfactant itself: cationic, anionic or non-ionic.1 A slight change in the molecular structure of the surfactant can affect the self-assembled structure in water and the interfacial activity, which can, in turn, tune the properties at the macroscopic scale such as their rheological behavior or their ability to stabilize emulsions and foams.2 However, not only the nature of the surfactant is important, since the presence of electrolytes and both the chemical structure and the charge of the counter-ion can also drastically change the properties of the solution. For a given ionic surfactant, a change of the counter-ion can modify the behavior of the surfactant- its solubility, its critical aggregation concentration (CAC) and its foaming and emulsifying properties.3-8 These changes come from the interactions between these two species, which depend on the chemical structure of the counter-ion.9, 10 Surfactant counter-ions may be either inorganic (sodium, potassium, etc.) or organic (tetramethylammonium, amino acids, etc). In the case of fluorosurfactants, Eastoe et al. have summarized in a review the effects of various counter-ions on the physical and chemical properties of such fluoro-based molecules.11 For fatty acids, numerous examples are described in literature showing how a change of counter-ion will have an effect on the Krafft temperature, the self-assembly, and the interfacial properties12-18. Therefore, by changing the counter-ion size and hydrophobicity, it is possible to easily tune the properties of a given surfactant.
Another way to modify the surfactant’s properties is to tune the molar ratio between the surfactant and the counter-ion. It is an efficient way, but less explored in the literature.14 Regarding fatty acids as anionic surfactants, the interest of modifying the molar ratio has increased in the last five years in order to improve their dispersion in aqueous solution.14, 19- 21 For example, for the system based on myristic acid in the presence of choline hydroxide as counter-ion, it has been described that the myristic acid displays a broad polymorphism from facetted vesicles, multilamellar vesicles, lamellar phases and to spherical micelles as a function of the molar ratio.22 The interfacial properties of the myristic acid are also directly linked to the quantity of counter-ions leading to various foaming and emulsifying behaviors.
In past studies, we focused on the 12-hydroxystearic acid (12-HSA), which is an inexpensive molecular surfactant available in large quantities and at low cost, derived by the
2 3 4 5 6 7 8 9 10 11 12 13 14 15 16 17 18 19 20 21 22 23 24 25 26 27 28 29 30 31 32 33 34 35 36 37 38 39 40 41 42 43 44 45 46 47 48 49 50 51 52 53 54 55 56 57 58 59
hydrogenation of a sustainable material - ricinoleic acid from castor plants - because it can self-assemble in unusual morphologies.23-26 Indeed, the 12-HSA is known to self-assemble into multilamellar micron-size tubes in the presence of alkanolamine as counter-ion.25 Upon heating, the tubes transform into spherical micelles due to a change in temperature, which in turn change the packing parameter of the fatty acid assemblies. These tubes can be used for drug delivery as illustrated in the literature.27 Another interest of this system comes from the outstandingly stability over months of the foams produced from these 12-HSA tubes dispersions, which are even described as “ultra-stable”.28 The phase transition of tubes into micelles upon heating leads to fast foam destabilization. By using the temperature-response of this self-assembly, the production of responsive foams has been achieved.28 Previously, we have demonstrated that the temperature transition between tubes and micelles is tuned by the alkyl chain length of the alkanolamines.25 For example at the equimolar 12-HSA/alkanolamine ratio, the transition is around 75°C for ethanolamine and 60°C for hexanolamine. In the case of ethanolamine, we have shown that the molar ratio modifies the transition from 75°C to 43°C in an excess of ethanolamine in bulk.14
Our aim was to understand the effect of the molar ratio between 12-HSA and various alkanolamines on the tube/micelle transition from the molecular scale to the supramolecular scale in order to tune it for a wide range of temperatures. At the microscopic scale, we investigated these systems by coupling microscopy techniques, DSC, SANS and WAXS. Combining these techniques allows for a comprehensive overview of the changes occurring at the supramolecular and molecular scale for the 12-HSA. We showed how the molar ratio and the nature of the counter-ion are the key parameters to tune the transition between tubes and micelle leading to drastic changes of the solution viscosity.
Materials and methods
Sample preparation12-hydroxystearic acid (12-hydroxyoctadecanoic acid, Sigma-Aldrich, 99% purity) was weighed in a sample tube into which Milli-Q water was added to obtain the desired concentration. Next, we mixed in the desired volume of a 1 M stock solution of the counter-ion to obtain the molar ratio (R) defined as R=n12-HSA/[n12-HSA+ncounter-counter-ion], with n the molar concentration in mol.L-1. All the counter-ions used are listed Table 1 and purchased from Sigma-Aldrich with the highest purity available. The mixture was heated at 80°C for 15 min
2 3 4 5 6 7 8 9 10 11 12 13 14 15 16 17 18 19 20 21 22 23 24 25 26 27 28 29 30 31 32 33 34 35 36 37 38 39 40 41 42 43 44 45 46 47 48 49 50 51 52 53 54 55 56 57 58 59
until all fatty acid solids were dispersed. The samples were then vigorously vortexed and cooled to room temperature. Prior to use, each sample was heated at 80°C for 15 min and cooled to room temperature.
Table 1: Counter-ions used in this study with their number of carbons and their abbreviations.
Counterion No. of carbons Abbreviation
Ethanolamine 2 C2
Propanolamine 3 C3
Butanolamine 4 C4
Pentanolamine 5 C5
Hexanolamine 6 C6
Phase Contrast Microscopy
Microscopy observations were carried out as a function of temperature (10°C to 80°C within ± 0.2°C) at 20x magnification using an optical microscope in the phase-contrast mode (Nikon Eclipse E-400, Tokyo, Japan) equipped with a 3-CCD JVC camera allowing digital images (768x512 pixels) to be collected. A drop of the lipid dispersion (about 20 µL) was deposited on the glass-slide surface (76x26x1.1 mm, RS France) and covered with a cover slide (22x22 mm, Menzel–Glaser, Germany). The glass slides were previously cleaned with ethanol.
Transmission Electronic Microscopy (TEM)
A drop of each sample was placed on a carbon-coated TEM copper grid. They were negatively stained with uranyl acetate. Then, the grid was air-dried before observation.The samples were mounted in a Gatan 910 specimen holder that was inserted in the microscope using a CT-3500-cryotransfer system. TEM images were then obtained by using a JEM 1230 'Cryo' microscope (Jeol, Japan) operated at 80 kV and equipped with a LaB6 filament.
Differential Scanning Calorimetry (DSC)
The phase transition temperatures were measured on a microcalorimeter Micro-DSC 7 (Setaram, France). Two stainless steel cells were used, one containing ca. 0.75 g of sample and the other, filled with the same amount of water used as reference. The heating and cooling ramps were from 10°C to 85°C at a rate of 1°C/min. The data analysis was performed with Calisto Processing. 2 3 4 5 6 7 8 9 10 11 12 13 14 15 16 17 18 19 20 21 22 23 24 25 26 27 28 29 30 31 32 33 34 35 36 37 38 39 40 41 42 43 44 45 46 47 48 49 50 51 52 53 54 55 56 57 58 59
Small-angle neutron scattering (SANS)
Small-angle neutron scattering experiments were performed at Laboratoire Léon-Brillouin (Saclay, France) on spectrometer PAXY. We used three configurations to get a Q-range lying between 0.005 Å-1 and 0.4 Å-1 (respectively 4.5 Å at 1m, 4.5 Å at 4.5 m, 4.5 m, 13.5Å at 4.5 m). The neutron beam was collimated by appropriately chosen neutron guides and circular apertures, with a beam diameter at the sample position of 7.6 mm. The neutron wavelength was set to the desired value with a mechanical velocity selector (∆λ/λ≈0.1). The samples, prepared with deuterated water, were held in flat quartz cells (Hellma) with a 2 mm optical path, and temperature-controlled by a circulating fluid to within ± 0.2°C. All samples were freshly made. The azimuthally-averaged spectra were corrected for solvent, cell and incoherent scattering, as well as for background noise by using PASINET software package provided at the beamline.29 The fitting procedure with all the form and structure factors used is described in Supporting Information.
Wide angle X-ray Scattering (WAXS)
WAXS spectra were recorded during two hours on a Bruker D8 Discover diffractometer. Cu Ka1 radiation (Cu Ka1 = 1.5405 Å), produced in a sealed tube at 40 kV and 40 mA was selected and parallelized using a Gobël mirror parallel optics system and collimated to produce a 0.5 cm beam diameter. Samples were prepared using the previous procedure with a 12-HSA concentration at 2% put in thin capillaries of 1.5 mm of diameter which were then flame-sealed immediately. The temperature was varied from 15°C to 75°C and controlled by a HFS 91-CAP platine (Linkam).
Rheometry
An Anton Paar rheometer (MCR 301) was used for studying the viscoelastic properties of the solutions of 12-HSA and alkanoamine. Experiments were performed with a cone-plate setup, well suited for these solutions and for steady-shear measurements. The rheometer was equipped with a Peltier system so that we could accurately set the temperature from 10 to 80°C.
Tests were made with other geometrical setup to be sure of the reproducibility of the results, and independence on the setup used.
2 3 4 5 6 7 8 9 10 11 12 13 14 15 16 17 18 19 20 21 22 23 24 25 26 27 28 29 30 31 32 33 34 35 36 37 38 39 40 41 42 43 44 45 46 47 48 49 50 51 52 53 54 55 56 57 58 59
Results
1. Phase behavior in the 12-HSA/ Counter-ion system at the supramolecular scale
In this study, five counter-ions have been used in mixture with 12-HSA. The abbreviation of the counter-ions corresponds to their number of carbons. The mixture of 12-HSA with counter-ions are denoted in the rest of the article with the abbreviation of the counter-ions, that is to say C2 to C6 (Table 1). The 12-HSA concentration was fixed at 10 g.L-1And the molar ratio, as defined previously, was R=n12-HSA/[n12-HSA+ncounter-ion].
For R>0.66, 12-HSA crystals were observed by eyes indicating that the amount of counter-ion was not enough to disperse the 12-HSA. Therefore, we limit our study to the range between 0.18 to 0.66. By using phase-contrast microscopy, we determined the phase diagram obtained as a function of both R and temperature for each counter-ion. Two different cases were observed as a function of the temperature: either tubes leading to turbid solution were observed or limpid solution by phase contrast microscopy (Figure SI.1). The temperature at which tubes transitioned into limpid solution was denoted temperature transition (Tt) and was represented on Figure 1 and Table SI.1. Three regimes were observed as a function of R. For example, in the case of C5, at low molar ratio (0.18 ≤ R≤ 0.33), Tt was constant around 30°C +/- 0.5. From R=0.35 to 0.55, Tt increased sharply to reach a value of 72°C +/- 1. For R > 0.55, Tt did not evolve anymore and remained constant around 72°C +/- 1. For each counter-ion, the same behavior was observed, but Tt was shifted to lower temperatures by increasing the number of carbons of the counter-ion. From C2 to C6, at low molar ratio, Tt decreased of around 23°C. At high molar ratio (R > 0.55), Tt varied of 10°C between C2 to C6. The intermediate regime of R, for which Tt increased sharply, was shifted to higher R by increasing the number of carbons of the counter-ion. We suppose that this result could be explained by a difference of pKa between the counter-ions.13 By modifying both R and the counter-ions, Tt could be finely tuned from 20°C to 78°C.
2 3 4 5 6 7 8 9 10 11 12 13 14 15 16 17 18 19 20 21 22 23 24 25 26 27 28 29 30 31 32 33 34 35 36 37 38 39 40 41 42 43 44 45 46 47 48 49 50 51 52 53 54 55 56 57 58 59
Figure 1: Phase diagram of the 12-HSA/counter-ion system as a function of temperature and molar
ratio R showing the temperature transition (Tt) at which tubes vanished, transformed into limpid solution containing micelles, as viewed by phase-contrast microscopy. The dashed lines are drawn to guide the eyes.
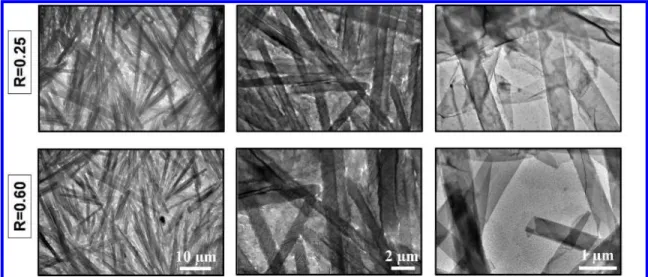
In order to characterize the tubes structure in solution at the supramolecular scale in various regions shown in Figure 1, TEM experiments were performed for each counter-ion below Tt at R=0.25 and R=0.60. When we compared for a given counter-ion the tubes aspect at the two molar ratios, we observed that tubes were similar (Figure 2 and SI.2a-d). For example for C5, tubes length was around 10 µm, and the tubes diameter was around 0.6 µm whatever R (Figure 2). Below Tt, tubes of a given counter-ion had similar characteristics at the supramolecular scale.
Figure 2: TEM images for C5 below Tt (T= 20°C) at two molar ratio: R=0.25 and R=0.60.
0,2 0,3 0,4 0,5 0,6 0,7 20 25 30 35 40 45 50 55 60 65 70 75 80 C2 C3 C4 C5 C6
T
e
m
p
e
ra
tu
re
(
°C
)
R
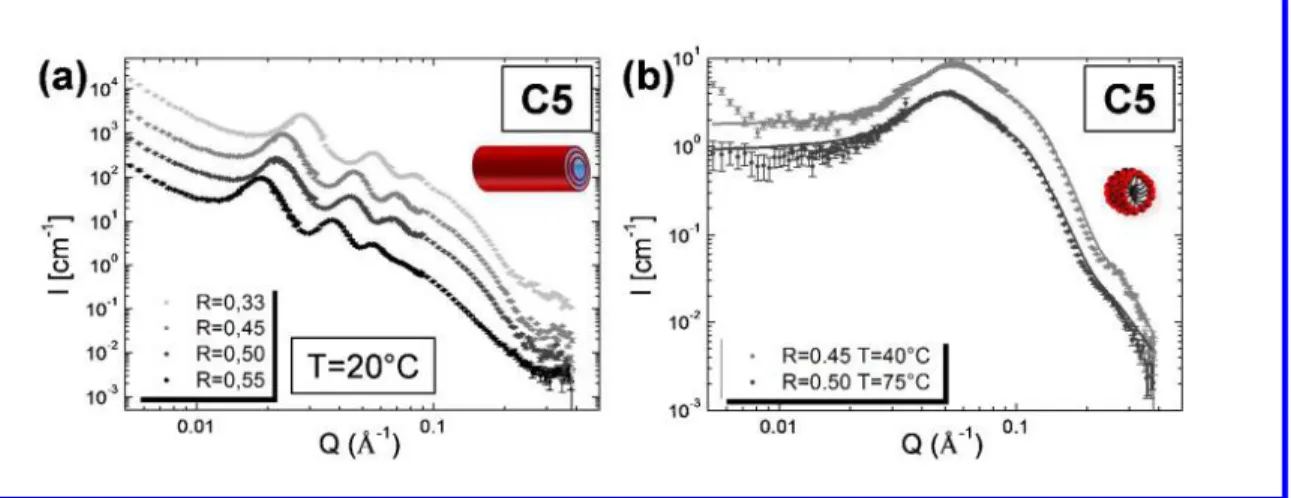
2 3 4 5 6 7 8 9 10 11 12 13 14 15 16 17 18 19 20 21 22 23 24 25 26 27 28 29 30 31 32 33 34 35 36 37 38 39 40 41 42 43 44 45 46 47 48 49 50 51 52 53 54 55 56 57 58 59As described in the introduction part, the 12-HSA tubes are multilamellar.24 In order to determine the effect of R on the multilamellar structure of these tubes, we performed SANS experiments at various R for each counter-ion below Tt. Figure 3.a displays the scattering profiles for C5 at R = 0.33, 0.45, 0.50 and 0.55 at 20°C. The scattering profiles for C2, C3, C4 and C6 are shown Figure SI.3.
Figure 3: (a) SANS intensity profile for C5 at four molar ratios (R=0.33, R=0.45, R=0.50 and
R=0.55) at 20°C below Tt.(b) SANS intensity profile for C5 at two molar ratios above Tt (R=0.45 at T=40°C and R=0.50 at T=75°C). The spectra were shifted in intensity for clarity. The lines correspond to the best fit of the data described in the Supporting Information.
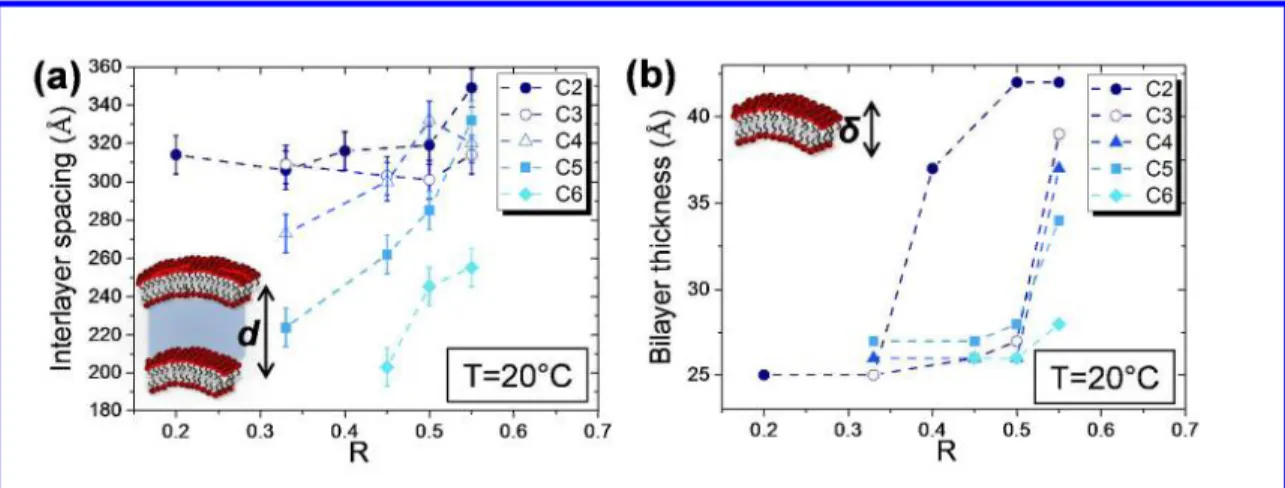
In the low-Q region, we observed two to four intense sharp peaks. Their positions were exactly in a ratio 1: 2: 3: 4 (Q0, 2Q0, 3Q0, 4Q0). The presence of a strong correlation peak followed by its harmonics indicated the presence of stacked bilayers. This result was similar to the ones previously obtained, confirming that tubes remained multilamellar whatever R and the nature of the counter-ion when T < Tt.25 The interlayer spacing (d), corresponding to the repeat distance to one fatty acid bilayer and one water layer in the stack, was estimated from the first peak position (d=2π/Q0). The data were displayed as a function of both R and the nature of the counter-ion at 20°C (Figure 4.a). For C2, the interlayer spacing increased from 314 Å for R=0.20 to 349 Å for R=0.55. For C6, the interlayer spacing increased from 203 Å for R=0.45 to 255 Å for R=0.55. For each counter-ion, the interlayer spacing increased by increasing R. This result can be explained by the decrease of the counter-ion amount by increasing R. This decrease leads to a decrease of the screening effect of the counter-ion and an increase of interlayer spacing between the negatively charged bilayers. At a fixed R, we observed that the interlayer spacing increased by decreasing the
2 3 4 5 6 7 8 9 10 11 12 13 14 15 16 17 18 19 20 21 22 23 24 25 26 27 28 29 30 31 32 33 34 35 36 37 38 39 40 41 42 43 44 45 46 47 48 49 50 51 52 53 54 55 56 57 58 59
carbon numbers of the counter-ion. For counter-ions with higher carbon numbers, it is possible that they are more condensed onto the surfactant layers, reducing the effective charge of the bilayers. Therefore, they could decrease the double-layer repulsion and leading to a closer approach between the bilayers.
Figure 4: (a) Evolution of the interlayer spacing with the schematic representation as a function of R
at 20°C below Tt for all counter-ions. (b) Evolution of the bilayer thickness with the schematic representation as a function of R at 20°C below Tt for all counter-ions. The dashed lines are drawn to guide the eyes.
Above Tt, the scattering spectra were completely different (Figure 3.b and Figure SI.3). At large Q, the spectra were fitted with a form factor of a sphere. From the oscillation of the form factor, we determined the radius of the sphere. By fitting the data, we showed the presence of negatively charged spherical micelles and the radius slightly varied around 22 2 Å as a function of R and the nature of the counter-ion (Table SI.2). These results shows that the absence of microns-size objects as viewed by phase-contrast microscopy inside the limpid solution above Tt comes from the presence of spherical micelles as previously shown in literature.25 At low Q, the scattered intensity decreased due to the low isothermal compressibility of the system. Micelles were mainly composed by the ionized 12-HSA molecules and were negatively charged. Micelles repelled over large distances due to electrostatic repulsions giving rise to a broad correlation peak, which corresponds in the direct space to the average distance between spherical micelles. For C5 at R=0.45, the broad correlation peak was centered on Q = 0.055 Å, which corresponded to a distance between micelles of around 114 Å. For C5 at R = 0.50, it was located at Q = 0.052 Å. The distance between micelles was around 121 Å. The distance between micelles decreased by decreasing R. We observed in the same time a slight decrease in the micelles size by decreasing R, which
2 3 4 5 6 7 8 9 10 11 12 13 14 15 16 17 18 19 20 21 22 23 24 25 26 27 28 29 30 31 32 33 34 35 36 37 38 39 40 41 42 43 44 45 46 47 48 49 50 51 52 53 54 55 56 57 58 59
means that the aggregation number also decreased (Table SI.2). Whatever R, the 12-HSA molecules number remained the same. Therefore, the number of micelles increased leading to a decrease of the distance between them in solution. To quantify the evolution of the aggregation number and the micelle charge, the position of the counter-ion regarding the micelles and the 12-HSA need to be known in order to perfectly fit the data. Other experiments such as SANS with contrast variation are needed.30
In conclusion, these observations confirm the results previously obtained for various alkanolamines at an equimolar ratio and show that in all cases whatever the counter-ion and the molar ratio, when T < Tt multilamellar tubes were present, and when T > Tt tubes transitioned into spherical micelles (Figure SI.5).
2. Thermal behavior of the bilayers at the molecular scale
The 12-HSA tubes are made of multilayers. In the 12-HSA tubes system based on C2, it is known that the alkyl chains of the fatty acid embedded in the bilayers may be present either in gel state (Lβ) or fluid state (Lα) depending on the temperature.26 In literature, the transition between the two states is called melting transition and leads to a change in the fluidity and thickness of the bilayers.31 We studied the bilayers state for each system in order to characterize the melting transition as a function of both R and the nature of the counter-ion. To evaluate the evolution of the bilayer thickness, we used the SANS spectra previously described at large Q (Figure 3.a and SI.3-4). From the oscillation of the form factor, we determined the bilayer thickness. The evolution of the bilayer thickness at 20°C as a function of R and the counter-ion is represented in Figure 4.b. For C2 at 20°C, from R=0.2 to R = 0.33, the bilayer thickness was constant around 25 +/- 1 Å. Then, for 0.33 < R < 0.40, the bilayer thickness sharply increased to reach 42 +/-1 Å. For R > 0.40, the bilayer thickness remained constant around 42 +/-1 Å. At high R, the value of 42 Å suggested that 12-HSA were embedded in a gel bilayer phase since it corresponds to exactly twice the length of the 12-HSA chain length in its extended conformation (21 Å). For the other counter-ions (C3, C4, C5 and C6), from R = 0.33 to R = 0.55 at 20°C, the bilayer thickness remained constant around 25 +/-1 Å. For R > 0.55, the bilayer thickness began to increase sharply for C3, C4 and C5 and slowly for C6. By increasing R for each counter-ion, the bilayer thickness evolved from 25 to 28-42 Å. When we compared the bilayer thickness at a fixed R = 0.55 at 20°C, we observed that the bilayer thickness increased from 28 Å for C6 to 42 Å for C2. The bilayer
2 3 4 5 6 7 8 9 10 11 12 13 14 15 16 17 18 19 20 21 22 23 24 25 26 27 28 29 30 31 32 33 34 35 36 37 38 39 40 41 42 43 44 45 46 47 48 49 50 51 52 53 54 55 56 57 58 59
thickness evolved as a function of R and the counter-ion at a given temperature. When the bilayer thickness was around 25 Å, the thickness was lower than twice the 12-HSA in extended conformation. It suggested that either the bilayer was in fluid phase (Lα) or in gel phase (Lβ) with its alkyl chains interdigitated.32 To discriminate between these two hypotheses and to understand the thermal behavior of the 12-HSA alkyl chains inside the bilayer, we coupled two techniques: Wide-Angle X-ray scattering (WAXS) and Differential scanning Calorimetry (DSC).
We first performed DSC measurements as a function of R for each counter-ion (Figure 5.a and SI.6). As a function of R, one or two endothermic peaks were observed. The global shape of the curves and the position of the transition temperatures were dependent on R. For example for C5, for R = 0.33, only one endothermic peak was observed and the maximum of the peak was around 27°C. This temperature corresponds exactly to those of the transition between the tubes and the micelles (Figure 1). From R = 0.46 to 0.55, two endothermic peaks were observed (Figure 5.a). The temperature second peak corresponds here to those of the transition between the tubes and the micelles (Figure 1). The same trend was observed for all the counter-ions (Figure SI.6). For each counter-ion, we determined the peak with the highest temperature on the enthalpogram, and we plotted the change of the maximum temperature of this peak as a function of R (Figure 5.b). By comparing the Figures 1 and 5.b, we observed exactly the same behavior. We can conclude that the peak at the highest temperature in DSC corresponds to the tubes to micelles transition. For all counter-ions, the same behavior with three regimes was observed (Figure 5.b). At low R, from R = 0.20 to R = 0.40, for C3, C4, C5 and C6, only one endothermic peak was observed and the temperature of the peak remained almost constant. The temperature of the peak was 32 °C, 27 °C, 24.5 °C and 19.5 °C, for C3, C4, C5 and C6, respectively. For C2, again one endothermic peak was observed with a maximum temperature around 37 °C but from R = 0.20 to R = 0.33. At low R, only one endothermic peak was observed with a constant temperature for all the counter-ions. We observed that the temperature of the peak increased by decreasing the number of carbons of the counter-ion (Figure 5.b). At intermediate R constituting the second regime, for all counter-ions, two endothermic peaks were present and the temperature of the highest peak increased sharply by increasing R (Figure 5.a). For example for C5, with 0.40 < R < 0.55, two endothermic peaks were noted and the temperature of the highest peak increased from 26°C to 67°C (Figure 5.a). At high R (R > 0.55), two endothermic peaks were present and the temperature of the peak was almost constant (Figure 5.b). For example, the temperature was
2 3 4 5 6 7 8 9 10 11 12 13 14 15 16 17 18 19 20 21 22 23 24 25 26 27 28 29 30 31 32 33 34 35 36 37 38 39 40 41 42 43 44 45 46 47 48 49 50 51 52 53 54 55 56 57 58 59
around 78°C and 68°C for C2 and C5, respectively. We noticed that the temperature increased by decreasing the carbon numbers of the counter-ion as previously observed by microscopy.
Figure 5: (a) Micro Differential Scanning Calorimetry endotherms obtained during heating scans for
C5 at four molar ratios (R=0.33, R=0.46, R=0.50 and R=0.55). The spectra were shifted in intensity for clarity.(b) Evolution of the temperature of the highest temperature on the enthalpogram as a function of R for all the counter-ions. The dashed lines are drawn to guide the eyes.
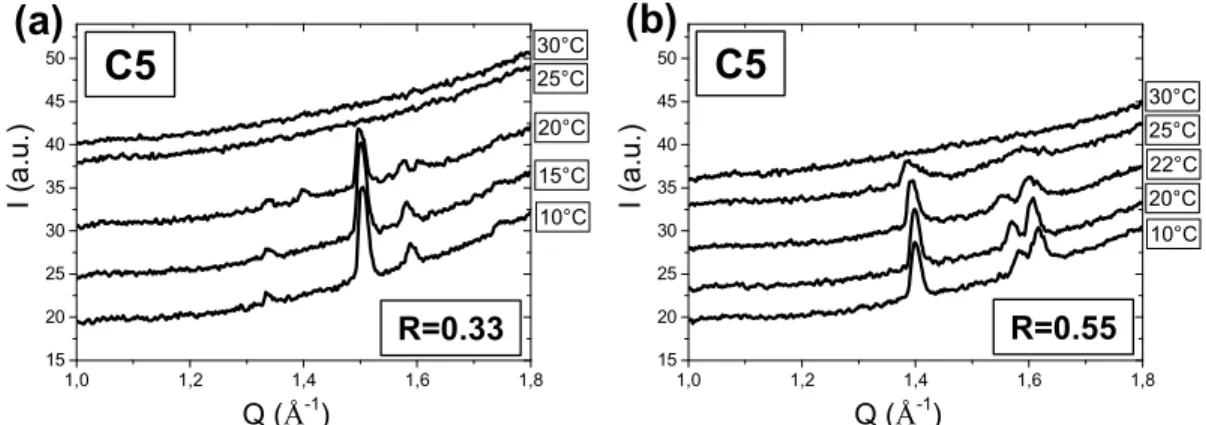
To understand the nature of these transitions, we performed WAXS experiments. For C5 at R = 0.33, two diffraction peaks were observed at 1.50 Å-1 and 1.58 Å-1 from 10°C to 20°C (Figure 6.a). Then, the two peaks completely disappeared above 25°C. However at R = 0.55, three sharp peaks were observed at 1.40 Å-1, 1.58 Å-1and 1.62 Å-1 from 10°C to 20°C with the same intensity (Figure 6.b). However, from 22°C to 25°C the peak intensity decreased progressively to disappear completely at 30°C. The presence of these peaks shows that the 12-HSA alkyl chains are in Lβ state. When the peaks disappear, the bilayer is in Lα state. The presence of two peaks at low R and three peaks at high R showed that the molecular organization inside the bilayers was not the same. By comparing with the DSC and SANS results, we can conclude that below the first peak in DSC for C5 at R=0.33, the bilayer thickness of 27 +/-1 Å at 20°C corresponded to interdigitated alkyl chain chains in gel state. We can suppose that for all counter-ions below the first peak in DSC the alkyl chains are in gel state. When the carbon number of the counter-ion is high enough, it may enter inside the bilayer leading to interdigitated bilayers. Above the first peak in DSC, the alkyl chains were in fluid phase (Lα). 0,2 0,3 0,4 0,5 0,6 0,7 20 25 30 35 40 45 50 55 60 65 70 75 80 C2 C3 C4 C5 C6 T e m p e ra tu re ( °C ) R C5 10 15 20 25 30 35 40 45 50 55 60 65 70 75 0 5 10 15 20 R=0.55 R=0.50 R=0.46 R=0.33 H e a t F lo w ( a .u .) Temperature (°C) (a) (b) 2 3 4 5 6 7 8 9 10 11 12 13 14 15 16 17 18 19 20 21 22 23 24 25 26 27 28 29 30 31 32 33 34 35 36 37 38 39 40 41 42 43 44 45 46 47 48 49 50 51 52 53 54 55 56 57 58 59
Figure 6: WAXS spectra as a function of the temperature for C5 at two molar ratios: (a) R=0.33 and
(b) R=0.55. The spectra were shifted in intensity for clarity.
3. Effect of R and of the counter-ion at the mesoscale : Bulk viscosity
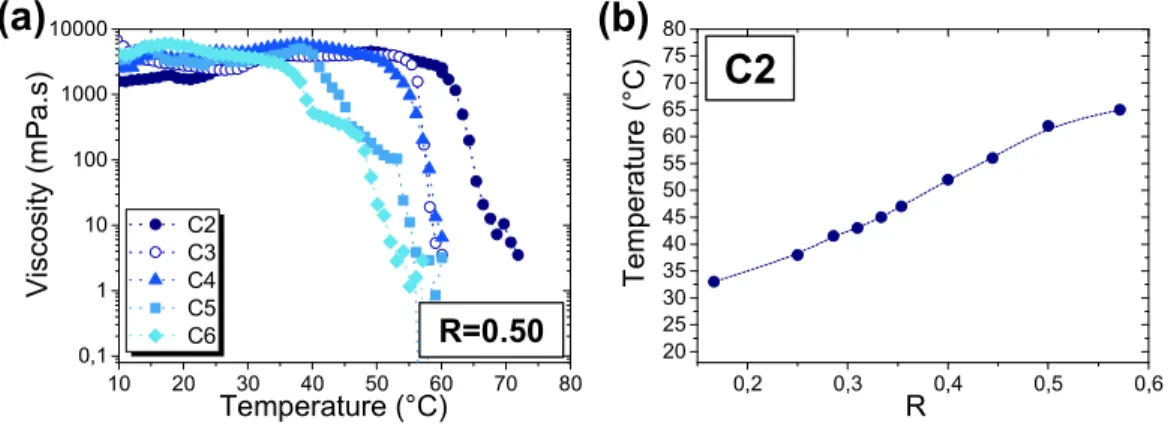
In a previous study, we showed that the transition between tubes and micelles leads to drastic changes of viscosity for C2 at an equimolar ratio R=0.50.33 Here, we determined the evolution of the dynamic viscosity for each counter-ion various R as a function of the temperature. In Figure 7.a, the results obtained for R=0.50 are shown. The shear rate was fixed at 0.5 s-1. All the curves present a drastic fall, where the viscosity decreased by more than three orders of magnitudes within few degrees around a critical temperature, which actually turns out to be close to Tt discussed previously for molecular and supramolecular scales. Below Tt, the solutions were always highly viscous for each counter-ion (viscosity > 1000 mPa.s) and with a strong shear-thinning behavior. At T ≈ Tt, the viscosity sharply decreased to reach low viscosity values around 1 mPa.s, close to the one of pure water and became Newtonian. In agreement with the previous observations, the temperature at which the viscosity decreased was shifted to lower values by increasing the number of carbons of the counter-ion.
We also determined the evolution of the temperature at which the viscosity changed as a function of R. The results for C2 are shown (Figure 7.b). We observed that this temperature increased by increasing R and was again close to Tt, but it was less easy to distinguish the three transition regimes. Therefore, there is a direct correlation between the presence of tubes and the high viscosity of the solution, and the abrupt fall of viscosity is a direct consequence of the tube/micelle transition. These results are complementary to our previous work based
1,0 1,2 1,4 1,6 1,8 15 20 25 30 35 40 45 50 30°C 25°C 20°C 15°C 10°C I (a .u .) Q (Å-1)
C5
R=0.33C5
R=0.55 1,0 1,2 1,4 1,6 1,8 15 20 25 30 35 40 45 50 30°C 25°C 22°C 20°C 10°C I (a .u .) Q (Å-1)(b)
(a)
2 3 4 5 6 7 8 9 10 11 12 13 14 15 16 17 18 19 20 21 22 23 24 25 26 27 28 29 30 31 32 33 34 35 36 37 38 39 40 41 42 43 44 45 46 47 48 49 50 51 52 53 54 55 56 57 58 59only on C2 at an equimolar ratio, and make clear that the same qualitative features are recovered for the five counter-ions tested here, and for all R.
Figure 7: (a) Evolution of the bulk viscosity as a function of the temperature for all counter-ions for
R=0.50. The dashed lines were drawn to guide the eyes. (b) Evolution of the temperature at which the viscosity changed as a function of R for C2.
4. Discussion: Link between the transition at the supramolecular scale and the melting phenomena at the molecular scale
We observed that the transition between tubes and micelles was tuned by R. For all counter-ions, we identified three different regimes according to R: low R, intermediate R and high R.
At low R, Tt was constant and only one endothermic peak was observed in DSC. In this regime, there was an excess of counter-ion in solution. 12-HSA and alkanolamines are a weak base and acid, respectively. There is a coexistence of fatty acids under their carboxylic forms (COOH) and carboxylate (COO-). The ratio between the two forms depends on the pH of the solution, which is governed by the molar ratio. At low R, the pH of the solution for all counter-ions was relatively high around 10.75 +/- 0.25 at 20°C and almost constant. We suppose that when R is low, the amount of the carboxylate form is markedly higher than the carboxylic form. In these conditions, the headgroup area is large. There are few hydrogen bonding and the interactions between ionized headgroups are repulsive. Below Tt, the aliphatic chains were in rigid and ordered gel state, leading to the formation of multilamellar tubes. The interdigitated bilayers observed for some counter-ions can be attributed to the
10 20 30 40 50 60 70 80 0,1 1 10 100 1000 10000 C2 C3 C4 C5 C6 V is c o s it y ( m P a .s ) Temperature (°C) 0,2 0,3 0,4 0,5 0,6 20 25 30 35 40 45 50 55 60 65 70 75 80 T e m p e ra tu re ( °C ) R
C2
R=0.50(a)
(b)
2 3 4 5 6 7 8 9 10 11 12 13 14 15 16 17 18 19 20 21 22 23 24 25 26 27 28 29 30 31 32 33 34 35 36 37 38 39 40 41 42 43 44 45 46 47 48 49 50 51 52 53 54 55 56 57 58 59electrostatic repulsion between the negatively charged fatty acid molecules and/or the insertion of the counter-ion inside the bilayer. Upon heating at Tt the tubes transformed into spherical micelles due to the alkyl chain melting process. The aliphatic chains change from the gel state to a fluid state, in which bilayers become more flexible. The molecules gain a disordered and the repulsions between the ionized headgroups lead to a decrease of the packing parameter and micelles, which are flexible self-assembly with higher curvature, are formed. In this low R regime, Tt is mainly dependent on the hydrophobic interaction. The amount of COO- is high and almost constant. The interactions between headgroups then do not vary. Therefore the chain melting process happens at the same temperature for a given counter-ion. At low R, Tt has a much lower value than at high R, because it depends only on the chain melting, which happens at low temperatures. Moreover, the chain melting temperature depends on the alkyl chain length of the counter-ion: higher the alkyl chain length, lower the chain melting temperature.
At intermediate R, Tt increased sharply according to R. Two endothermic peaks were observed in DSC. The pH of the solution for all counter-ions decreased sharply from 10.75 +/- 0.25 down to 9.75 +/- 0.25 at 20°C. In this intermediate regime, by increasing R, the excess of counter-ion decreases progressively to reach an excess of 12-HSA in solution. The quantity of fatty acid molecules neutralized by the counter-ion decreases and the quantity of protonated 12-HSA molecules increases. There is the coexistence of the carboxylic and carboxylate forms in solution. Hydrogen bonds can be obtained between the two types of forms at the headgroup level. We identified that the first endothermic peak in DSC corresponds to the chain melting process and it is almost constant such as in the low R regime. Above the chain melting process, multilamellar tubes are still observed even if the bilayers are in fluid disordered state due to the hydrogen bonds, which help to stabilize and maintain the bilayer structure.32, 34 However, when the hydrogen bonds disappear, the tubes to micelles transition is observed. This phenomenon is called surface melting. The second peak in DSC corresponds to the disappearance of the hydrogen bonds at the headgroups level.32, 34 The headgroup area becomes larger leading to lower packing parameter and the formation of micelles. For this regime, Tt is linked to the surface melting and not to the chain melting process. Tt is dependent on the headgroups interactions and, as a result, Tt increases with the number of hydrogen bonds between headgroups. The increase of R leads to an increase of the carboxylic forms giving more hydrogen bonds to stabilize the bilayers, which can resist to the
2 3 4 5 6 7 8 9 10 11 12 13 14 15 16 17 18 19 20 21 22 23 24 25 26 27 28 29 30 31 32 33 34 35 36 37 38 39 40 41 42 43 44 45 46 47 48 49 50 51 52 53 54 55 56 57 58 59
surface melting at higher temperatures. Thus, by increasing R, the sharp increase observed for Tt is correlated to the increase of the surface melting temperature.
At high R, Tt was almost constant, but markedly higher than for the low R regime. The pH of the solution for all counter-ions was almost constant around 9.75 +/- 0.25 at 20°C. It was lower than for the low R regime. In such high R regime, there is an excess of 12-HSA in solution. The quantity of protonated 12-HSA molecules is high and almost constant up to a threshold R for which the amount of counter-ion is too low to disperse the 12-HSA, and crystals are observed (for R > 0.66). At high R, hydrogen bonds are still present at the headgroup level, but the number remains almost constant. Two endothermic peaks were observed in DSC. In the same way than for the intermediate regime, the alkyl chain melting and the surface melting processes occur. Since the number of hydrogen bonds remains constant, the surface melting process occur at a constant temperature and Tt is constant. We observed that the surface melting temperature depends on the alkyl chain length of the counter-ion: higher the alkyl chain length, lower the surface melting temperature. We can suppose that it is linked to the pKa of the counter-ion and the pH of the solution modifying the ionization state of the 12-HSA, which is slightly higher when the alkyl chain length of the counter-ion increases.
To summarize, thanks to complementary studies at the molecular and supramolecular scale, we have illustrated many features of this tube-micelle transition, and identified its origins. The temperature Tt at which tubes transit toward micelles can be easily tuned by R which governs both the surface melting and the alkyl chain melting transitions. For all the alkanolamine tested here, two extreme limits are found for low and high R, where Tt is constant, and respectively corresponding to an excess of counter-ion or an excess of 12-HSA. In between these two limits, a intermediary regime is found where Tt varies linearly with R. Similar observations have been described in literature for salt-free catanionics systems based on fatty acid and cationic surfactant in its hydroxide form.31, 35 The transition between tubes and micelles was reversible due to the reversibility of the surface and alkyl chain melting phenomena. 2 3 4 5 6 7 8 9 10 11 12 13 14 15 16 17 18 19 20 21 22 23 24 25 26 27 28 29 30 31 32 33 34 35 36 37 38 39 40 41 42 43 44 45 46 47 48 49 50 51 52 53 54 55 56 57 58 59
Conclusion
The effect of the molar ratio between 12-HSA and various alkanolamines as counter-ion has been studied in bulk. The 12-HSA self-assembled into multilamellar tubes and transitioned into micelles at a precise temperature, which depended on both the molar ratio and the alkyl chain length of the counter-ion. This transition delimited a regime of high bulk viscosity, with a regime of low viscosity. This temperature transition could be precisely tuned from 20°C to 75°C. We demonstrated that this transition between tubes to micelles at the supramolecular scale had two origins at the molecular scale as a function of the molar ratio. At low R, with an excess of counter-ion, the transition came from the chain melting phenomenon. At high R, with an excess of 12-HSA, two phenomena at play were observed leading to the transition between tubes into micelles. The first one was the chain melting process and the second one was the disappearance of the hydrogen bonds. This study confirms that the molar ratio is a crucial parameter to take into account in surfactant’s system and the approach used in this study could be extended to other surfactant systems. Moreover, from our results, we can see that the effects of the counter-ion and molar ratio are not only important on the transition between tubes and micelles, but they seem to have a role on the tubes structure and formation mechanisms. Further studies are needed to determine precisely the position of the counter-ion as a function of its alkyl chain length and the molar ratio regarding the fatty acid bilayers and the micelles. These results could be compared with the different theories about self-assembled molecules and lipid tubes formation in order to determine precisely how these tubes are formed.36-41
Our system based on 12-HSA as surfactant in combination with alkanolamine is known to exhibited excellent foamability and stability due to the presence of 12-HSA tubes in the foam liquid channels and their adsorption at the air/water interface. The transformation of the tubes into micelles upon heating above the temperature transition led to the complete destruction of the foam leading to responsive foams controllable by the temperature as stimulus. Moreover, bulk and interfacial rheological properties are tuned by the 12-HSA changes of the supramolecular assembly. The temperature at which all these properties are modified, are directly linked to the temperature transition between tubes to micelles. From applied perspectives, the modification of both the counter-ion and the molar ratio could be a simple, but effective way to choose the temperature transition at any given temperatures between 20°C to 75°C. Thus, the 12-HSA properties at the macroscopic scale such as
2 3 4 5 6 7 8 9 10 11 12 13 14 15 16 17 18 19 20 21 22 23 24 25 26 27 28 29 30 31 32 33 34 35 36 37 38 39 40 41 42 43 44 45 46 47 48 49 50 51 52 53 54 55 56 57 58 59
foaming, bulk and interfacial rheological properties, and drug delivery properties could be manipulate precisely in a wide range of temperatures.
Acknowledgments
The authors gratefully acknowledge the Laboratoire Léon Brillouin (LLB) for the allocation of neutron beam time on the spectrometer PAXY. We thank Dr. Cédric Gaillard and Bérénice Houinsou-Houssou for their help for the microscopy experiments, and Romain Derrien for the rheological experiments. We thank Bruno Pontoire for his help with the WAXS experiments. We also acknowledge Dr. Thomas Zemb and Dr. Jean-Paul Douliez for the useful discussions.
Supporting Information
Part of the experimental section including DSC results, SANS results, and micrographs of tubes. This information is available free of charge via the Internet at http://pubs.acs.org/.
References
1. Czajka, A.; Hazell, G.; Eastoe, J. Surfactants at the design limit. Langmuir 2015, 31 (30), 8205-8217.
2. Myers, D. Surfactant Science and Technology; Wiley: New York, 2006.
3. Slavchov, R. I.; Karakashev, S. I.; Ivanov, I. B. Ionic surfactants and ion-specific effects: adsorption, micellization, thin liquid films. Surfactant science and technology, retrospects and prospects. CRC Press, New York 2014.
4. Benrraou, M.; Bales, B. L.; Zana, R. Effect of the nature of the counterion on the properties of anionic surfactants. 1. Cmc, ionization degree at the cmc and aggregation number of micelles of sodium, cesium, tetramethylammonium, tetraethylammonium, tetrapropylammonium, and
tetrabutylammonium dodecyl sulfates. The Journal of Physical Chemistry B 2003, 107 (48), 13432-13440.
5. Zana, R. Partial phase behavior and micellar properties of tetrabutylammonium salts of fatty acids: Unusual solubility in water and formation of unexpectedly small micelles. Langmuir 2004, 20 (14), 5666-5668.
6. Zana, R.; Benrraou, M.; Bales, B. L. Effect of the nature of the counterion on the properties of anionic surfactants. 3. Self-association behavior of tetrabutylammonium dodecyl sulfate and tetradecyl sulfate: Clouding and micellar growth. Journal of Physical Chemistry B 2004, 108 (47), 18195-18203. 7. Zana, R.; Schmidt, J.; Talmon, Y. Tetrabutylammonium alkyl carboxylate surfactants in aqueous solution: Self-association behavior, solution nanostructure, and comparison with tetrabutylammonium alkyl sulfate surfactants. Langmuir 2005, 21 (25), 11628-11636.
8. Bales, B. L.; Tiguida, K.; Zana, R. Effect of the nature of the counterion on the properties of anionic surfactants. 2. Aggregation number-based micelle ionization degrees for micelles of
2 3 4 5 6 7 8 9 10 11 12 13 14 15 16 17 18 19 20 21 22 23 24 25 26 27 28 29 30 31 32 33 34 35 36 37 38 39 40 41 42 43 44 45 46 47 48 49 50 51 52 53 54 55 56 57 58 59
tetraalkylammonium dodecylsulfates. The Journal of Physical Chemistry B 2004, 108 (39), 14948-14955.
9. Pottage, M. J.; Greaves, T. L.; Garvey, C. J.; Tabor, R. F. The effects of alkylammonium counterions on the aggregation of fluorinated surfactants and surfactant ionic liquids. Journal of Colloid and Interface Science 2016, 475, 72-81.
10. Pottage, M. J.; Greaves, T. L.; Garvey, C. J.; Mudie, S. T.; Tabor, R. F. Controlling the characteristics of lamellar liquid crystals using counterion choice, fluorination and temperature. Soft Matter 2015, 11 (2), 261-268.
11. James, C.; Eastoe, J. Ion specific effects with CO 2-philic surfactants. Current Opinion in Colloid & Interface Science 2013, 18 (1), 40-46.
12. Xu, W.; Gu, H.; Zhu, X.; Zhong, Y.; Jiang, L.; Xu, M.; Song, A.; Hao, J. CO2-controllable foaming and emulsification properties of the stearic acid soap systems. LANGMUIR 2015, 31 (21), 5758-5766.
13. Feng, Y.; Han, Y. Effect of counterion size on wormlike micelles formed by a C22-tailed anionic surfactant. Journal of Molecular Liquids 2016, 218, 508-514.
14. Fameau, A.-L.; Zemb, T. Self-assembly of fatty acids in the presence of amines and cationic components. Advances in Colloid and Interface Science 2014, 207, 43-64.
15. Douliez, J.-P.; Houssou, B. H.; Fameau, A.-L.; Navailles, L.; Nallet, F.; Grélard, A.; Dufourc, E. J.; Gaillard, C. Self-assembly of bilayer vesicles made of saturated long chain fatty acids.
LANGMUIR 2016, 32 (2), 401-410.
16. Rengstl, D.; Diat, O.; Klein, R.; Kunz, W. Influence of chain length and double bond on the aqueous behavior of choline carboxylate soaps. Langmuir 2013, 29 (8), 2506-2519.
17. Novales, B.; Navailles, L.; Axelos, M.; Nallet, F.; Douliez, J.-P. Self-assembly of fatty acids and hydroxyl derivative salts. Langmuir 2008, 24 (1), 62-68.
18. Xu, W.; Song, A.; Dong, S.; Chen, J.; Hao, J. A systematic investigation and insight into the formation mechanism of bilayers of fatty acid/soap mixtures in aqueous solutions. LANGMUIR 2013, 29 (40), 12380-12388.
19. Arnould, A.; Cousin, F.; Chabas, L.; Fameau, A.-L. Impact of the molar ratio and the nature of the counter-ion on the self-assembly of myristic acid. Journal of Colloid and Interface Science 2017. 20. Klein, R.; Kellermeier, M.; Drechsler, M.; Touraud, D.; Kunz, W. Solubilisation of stearic acid by the organic base choline hydroxide. Colloids and Surfaces a-Physicochemical and Engineering Aspects 2009, 338 (1-3), 129-134.
21. Wolfrum, S.; Marcus, J.; Touraud, D.; Kunz, W. A renaissance of soaps?—How to make clear and stable solutions at neutral pH and room temperature. Advances in Colloid and Interface Science
2016, 236, 28-42.
22. Arnould, A.; Perez, A. A.; Gaillard, C.; Douliez, J.-P.; Cousin, F.; Santiago, L. G.; Zemb, T.; Anton, M.; Fameau, A.-L. Self-assembly of myristic acid in the presence of choline hydroxide: Effect of molar ratio and temperature. Journal of Colloid and Interface Science 2015, 445, 285-293.
23. Douliez, J. P.; Pontoire, B.; Gaillard, C. Lipid Tubes with a Temperature‐Tunable Diameter. ChemPhysChem 2006, 7 (10), 2071-2073.
24. Douliez, J.-P.; Gaillard, C.; Navailles, L.; Nallet, F. Novel lipid system forming hollow microtubes at high yields and concentration. Langmuir 2006, 22 (7), 2942-2945.
25. Fameau, A.-L.; Cousin, F.; Navailles, L.; Nallet, F. d. r.; Boué, F. o.; Douliez, J.-P. Multiscale structural Characterizations of fatty acid multilayered tubes with a temperature-tunable diameter. The Journal of Physical Chemistry B 2011, 115 (29), 9033-9039.
26. Fameau, A.-L.; Houinsou-Houssou, B.; Novales, B.; Navailles, L.; Nallet, F.; Douliez, J.-P. 12-Hydroxystearic acid lipid tubes under various experimental conditions. Journal of Colloid and Interface Science 2010, 341 (1), 38-47.
27. Salerno, C.; Chiappetta, D. A.; Arechavala, A.; Gorzalczany, S.; Scioscia, S. L.; Bregni, C. Lipid-based microtubes for topical delivery of Amphotericin B. Colloids and Surfaces B:
Biointerfaces 2013, 107, 160-166.
28. Fameau, A.-L.; Saint-Jalmes, A.; Cousin, F.; Houssou, B. H.; Novales, B.; Navailles, L.; Nallet, F.; Gaillard, C.; Boue, F.; Douliez, J.-P. Smart Foams: Switching Reversibly between
Ultrastable and Unstable Foams. Angewandte Chemie-International Edition 2011, 50 (36), 8264-8269.
2 3 4 5 6 7 8 9 10 11 12 13 14 15 16 17 18 19 20 21 22 23 24 25 26 27 28 29 30 31 32 33 34 35 36 37 38 39 40 41 42 43 44 45 46 47 48 49 50 51 52 53 54 55 56 57 58 59
29. Brûlet, A.; Lairez, D.; Lapp, A.; Cotton, J.-P. Improvement of data treatment in small-angle neutron scattering. Journal of Applied Crystallography 2007, 40 (1), 165-177.
30. Carrière, D.; Belloni, L.; Demé, B.; Dubois, M.; Vautrin, C.; Meister, A.; Zemb, T. In-plane distribution in mixtures of cationic and anionic surfactants. Soft Matter 2009, 5 (24), 4983-4990. 31. Zemb, T.; Dubois, M. Catanionic Microcrystals: Organic Platelets, Gigadalton ‘Molecules’, or Ionic Solids? Australian journal of chemistry 2003, 56 (10), 971-979.
32. Vautrin, C.; Zemb, T.; Schneider, M.; Tanaka, M. Balance of pH and ionic strength influences on chain melting transition in catanionic vesicles. The Journal of Physical Chemistry B 2004, 108 (23), 7986-7991.
33. Fameau, A.-L.; Saint-Jalmes, A. Yielding and flow of solutions of thermoresponsive surfactant tubes: tuning macroscopic rheology by supramolecular assemblies. Soft Matter 2014, 10 (20), 3622-3632.
34. Vautrin, C.; Dubois, M.; Zemb, T.; Hoffmann, H.; Gradzielski, M. Chain melting in swollen catanionic bilayers. Colloids and Surfaces A: Physicochemical and Engineering Aspects 2003, 217 (1), 165-170.
35. Zemb, T.; Dubois, M.; Deme, B.; Gulik-Krzywicki, T. Self-assembly of flat nanodiscs in salt-free catanionic surfactant solutions. Science 1999, 283 (5403), 816-819.
36. Barclay, T. G.; Constantopoulos, K.; Matisons, J. Nanotubes self-assembled from amphiphilic molecules via helical intermediates. Chemical Reviews 2014, 114 (20), 10217-10291.
37. Aggeli, A.; Nyrkova, I. A.; Bell, M.; Harding, R.; Carrick, L.; McLeish, T. C. B.; Semenov, A. N.; Boden, N. Hierarchical self-assembly of chiral rod-like molecules as a model for peptide beta-sheet tapes, ribbons, fibrils, and fibers. Proceedings of the National Academy of Sciences of the United States of America 2001, 98 (21), 11857-11862.
38. Shimizu, T.; Masuda, M.; Minamikawa, H. Supramolecular nanotube architectures based on amphiphilic molecules. Chemical Review 2005, 105 (4), 1401-1443.
39. Selinger, J. V.; Schnur, J. M. Theory of Chiral Lipid Tubules. Physical Review Letters 1993, 71 (24), 4091-4094.
40. Spector, M. S.; Selinger, J. V.; Singh, A.; Rodriguez, J. M.; Price, R. R.; Schnur, J. M. Controlling the morphology of chiral lipid tubules. Langmuir 1998, 14 (13), 3493-3500.
41. Selinger, J. V.; Spector, M. S.; Schnur, J. M. Theory of self assembled tubules and helical ribbons. Journal of physical Chemistry 2001, 105 (30), 7157-7169.
2 3 4 5 6 7 8 9 10 11 12 13 14 15 16 17 18 19 20 21 22 23 24 25 26 27 28 29 30 31 32 33 34 35 36 37 38 39 40 41 42 43 44 45 46 47 48 49 50 51 52 53 54 55 56 57 58 59