HAL Id: hal-00328399
https://hal.archives-ouvertes.fr/hal-00328399
Submitted on 23 Aug 2005
HAL is a multi-disciplinary open access
archive for the deposit and dissemination of
sci-entific research documents, whether they are
pub-lished or not. The documents may come from
teaching and research institutions in France or
abroad, or from public or private research centers.
L’archive ouverte pluridisciplinaire HAL, est
destinée au dépôt et à la diffusion de documents
scientifiques de niveau recherche, publiés ou non,
émanant des établissements d’enseignement et de
recherche français ou étrangers, des laboratoires
publics ou privés.
scattering coefficient over the Eastern Mediterranean
Sea during the MINOS campaign
J. Sciare, K. Oikonomou, H. Cachier, N. Mihalopoulos, M. O. Andreae, W.
Maenhaut, R. Sarda-Estève
To cite this version:
J. Sciare, K. Oikonomou, H. Cachier, N. Mihalopoulos, M. O. Andreae, et al.. Aerosol mass closure
and reconstruction of the light scattering coefficient over the Eastern Mediterranean Sea during the
MINOS campaign. Atmospheric Chemistry and Physics, European Geosciences Union, 2005, 5 (8),
pp.2265. �10.5194/acp-5-2253-2005�. �hal-00328399�
www.atmos-chem-phys.org/acp/5/2253/ SRef-ID: 1680-7324/acp/2005-5-2253 European Geosciences Union
Chemistry
and Physics
Aerosol mass closure and reconstruction of the light scattering
coefficient over the Eastern Mediterranean Sea during the MINOS
campaign
J. Sciare1,3, K. Oikonomou2,3, H. Cachier3, N. Mihalopoulos2, M. O. Andreae1, W. Maenhaut4, and R. Sarda-Est`eve3
1Department of Biogeochemistry, Max Planck Institute for Chemistry, Mainz, Germany 2Department of Chemistry, University of Crete (ECPL), Heraklion, Crete, Greece
3Laboratoire des Sciences du Climat et de l’Environnement (LSCE), Gif-sur-Yvette, France 4Institute for Nuclear Sciences, Ghent University (UGent), Belgium
Received: 6 January 2005 – Published in Atmos. Chem. Phys. Discuss.: 21 April 2005 Revised: 4 August 2005 – Accepted: 9 August 2005 – Published: 23 August 2005
Abstract. As part of the Mediterranean Intensive
Oxi-dant Study (MINOS) performed during August 2001 in the Eastern Mediterranean Region, intensive measurements of chemical and radiative properties of atmospheric aerosols were performed at two remote sites on Crete Island, lo-cated in the marine boundary layer (MBL), and in the lower free troposphere (FT), respectively. Gravimetric particulate mass, as well as chemically-derived masses of water solu-ble ions, organic and elemental carbon, and tracer elements for dust aerosols were measured for fine (<1.2 µm) and coarse (>1.2 µm) particles at the two sampling sites. Al-though strongly bound water, mainly associated with inor-ganic species, could have slightly altered our results (10% of the reconstructed mass), chemical mass closure was achieved most of the time for the fine and coarse size fractions and at both sites. Our conversion factor of 2.1 for organic car-bon (OC) to particulate organic matter (POM) is at the upper end of those reported in the literature, but fits with the aged smoke particles collected during the campaign. The results indicate that this conversion factor changed during the cam-paign along with the BC/TC ratio.
The particulate mass (PM) concentration for fine aerosols at the MBL and FT sites averaged 17.4±4.7 µg/m3 and 11.2±3.2 µg/m3, respectively, and is among the highest re-ported in the literature for remote sites; more than 90% of this PM was composed equally of ammonium sulfate and carbonaceous aerosols. Comparison between the MBL and FT sites showed a slight vertical gradient for PM that was not observed for dust aerosols, which averaged 10.5±4.8 and 11.7±5.0 µg/m3for the MBL and FT sites, respectively.
Correspondence to: J. Sciare (sciare@cea.fr)
The results were used to reconstruct the ambient light scat-tering coefficient (σsp)that was measured at ambient
Rela-tive Humidity (RH ) for fine particles at the MBL site. Re-construction of σsp was achieved using ratios of wet to dry
scattering, f (RH ), that depend on RH for ammonium sul-fate, but are kept equal to 1 for POM. This results in a low water adsorption for our organic-rich carbonaceous aerosols, although these aged biomass smoke aerosols are supposed to be highly oxidized. Mass scattering efficiencies of the main aerosol components were obtained by multivariate re-gression analysis, and were 2.66 and 4.19 m2/g (at the 95%
confidence level) for dry ammonium sulfate and POM, spectively. The calculations indicate that one third of the re-constructed σspwas due to water uptake by ammonium
sul-fate aerosols, demonstrating their major role in the radiative aerosol properties in the eastern Mediterranean.
1 Introduction
The effect of aerosols on climate might be as large, but oppo-site in sign, as that of the long-lived greenhouses gases (IPCC report, 2001). The direct radiative forcing of these aerosols is often expressed through their different chemical components (black carbon, sulfate, organic carbon or mineral dust); mak-ing the chemical composition one of the most important pa-rameters for determining the climatic role of aerosols. To re-duce the uncertainties in the knowledge of both the direct and indirect effects of aerosols, efforts have been made over the years to better characterize the size resolved chemical com-position of aerosols at various distances from their sources. Among these studies, chemical mass closure experiments are more and more required as they will serve to better constrain
the optical properties of aerosols or the formation of cloud condensation nuclei. They will also help to estimate the im-pact of various pollution sources on ambient air quality (Bal-asubramian et al., 2003; Harrison et al., 2003). When per-formed in the Mediterranean Sea, these local aerosol closure experiments will bring a more comprehensive picture of the aerosol chemical composition in a region that is surrounded by strong sources of dust, sulfate and carbonaceous aerosols (Mihalopoulos et al., 1997; Andreae et al., 2002; Sciare et al., 2003a), and where some of the strongest aerosol radiative forcing in the world can be found (Haywood and Boucher, 2000; Jacobson, 2001; Kirkevag and Iversen, 2002; Markow-icz et al., 2002).
Fulfilling one of the objectives of the Mediterranean Inten-sive Oxidant Study (MINOS), performed during the summer 2001, we present here an attempt to fully characterise the aerosol mass from gravimetric measurements and exhaustive chemical analysis at two remote sites in the Eastern Mediter-ranean Basin. The carbonaceous aerosol characterization performed by Sciare et al. (2003b) during the MINOS cam-paign is be used here to better constrain the organic fraction of aerosols. A detailed description of the chemical appor-tionment of size-segregated aerosols is also presented here, as it can be used to derive the light scattering coefficient that was also recorded during the experiment at ambient relative humidity (RH ). This detailed study will serve later on for the calculation of the direct aerosol radiative forcing that will be compared to previous results derived from direct radiometric measurements (Markowicz et al., 2002), which showed that absorbing Mediterranean aerosols may lead to a large reduc-tion in the solar radiareduc-tion at the surface.
2 Instrumentation
2.1 Sampling sites and air mass origin
A detailed overview of the MINOS campaign is given by Lelieveld et al. (2002), Traub et al. (2003), and Salisbury et al. (2003). Briefly, two ground-based stations were oper-ated during the MINOS campaign: Finokalia station, locoper-ated in the MBL (35◦190N, 25◦400E; 150 m a.s.l.) and Skinakas station, located in the FT (35◦150N, 25◦500E; 1500 m a.s.l.) and at 50 km from the MBL site. These stations are located respectively within the two aerosol layers (0–1200 m and 1200–3000 m) observed from the vertical profiles of aerosol properties measured throughout the entire campaign from aircraft (Minikin et al., unpublished results). Backtrajectory analysis showed that the MBL site and to a lesser extent the FT site were both influenced by biomass burning, which oc-curred in the west and north of the Black Sea for almost the whole duration of the campaign (Salisbury et al., 2003; Sciare et al., 2003b). Air masses arriving at the FT site had a more pronounced westerly pattern, including long range transport from North Africa.
2.2 Aerosol sampling (MBL + FT sites)
A total of 56 ambient aerosol samples were collected at the MBL site (26 July–23 August 2001), on 47-mm diameter quartz fibre filters (QMA, Whatman) for carbon analysis, and with Stacked Filter Units (SFUs) for gravimetric measure-ments and ion analysis. Using similar devices, 6 quartz fibre filter and 15 SFU samples were collected at the FT site dur-ing the period 31 July–18 August 2001. The sampldur-ing time was typically of 12 h for the SFUs and quartz filters at the MBL site, 24 h for SFUs at the FT site, and 48 h for quartz filters at the FT site. The SFUs consist of an 8 µm pore size 47-mm diameter Nuclepore polycarbonate filter mounted in front of a 0.4 µm pore size 47-mm diameter Nuclepore fil-ter. Similar devices have been successfully used by oth-ers in the dusty environment of the eastern Mediterranean (e.g., Formenti et al., 2002 and Andreae et al., 2002). At our flow rate of 28.5±1.5 L/min, the 50% cut-point diame-ter (D50) of the 8 µm pore size fildiame-ter was estimated to be of the order on 1.2±0.1 µm aerodynamic diameter (AD) fol-lowing the calculation by John et al. (1983). In this paper, the aerosol coarse fraction will refer to the particles collected on the 8 µm pore size filters and thus having a diameter larger than 1.2 µm AD. Conversely, the fine fraction will refer to particles collected on the 0.4 µm pore size filters and will correspond to particles with a diameter below 1.2 µm AD.
Size-segregated aerosols were collected during the cam-paign on a 3-day basis at the MBL site using two cascade impactors in parallel; a 11-stage Micro-Orifice Uniform De-posit Impactor (MOUDI, MSP Corporation) operating with 47-mm diameter Nuclepore polycarbonate or Teflon filters as impaction surfaces, for mass, ionic, elemental, and absorp-tion measurements; and a 13-stage DEKATI Low pressure cascade Impactor (Dekati Ltd, Tampere, Finland) operating with 25-mm diameter Glass fiber (GFC) filters as impaction surfaces for BC and OC measurements.
2.3 Scattering coefficient measurements
Aerosol scattering coefficient was measured at the MBL site with a single-wavelength integrating nephelometer (M903, Radiance Research, Seattle, USA). This instrument measures the light scattering coefficient (σsp)at 545 nm. The
opti-cal and electriopti-cal background noise is sufficiently low to al-low measurements of σsp(for particles) from less than 10%
of air Rayleigh (σsp<1 Mm−1)to greater than 1000 Mm−1.
Measurements were performed at ambient Relative Humidity (RH ), with a cut-off of the order of 1–2 µm AD (impactor plate) applied at the inlet of the nephelometer (i.e., close to the cut-off diameter between coarse and fine of our SFUs). In order to minimize any RH discrepancies resulting in the heating of air from the nephelometer light source, an air flow of 1 m3/h was applied at the inlet of the nephelometer. Com-parison between RH data from the nephelometer and from the meteo station of the sampling site have shown a good
agreement (r2=0.71, N=585) a slope of 1.03. Calibration of the instrument has been performed using CO2, prior to the
campaign in the laboratory. The zero point of the instrument was checked on a daily basis by the mean of a HEPA filter. Comparison was performed in the field at the beginning and at the end of the campaign with a second Radiance Research Nephelometer and showed good agreement between the two instruments, with deviations below 5%.
3 Analysis
3.1 Gravimetric measurements
The Nuclepore filters from the SFU samples were weighed at LSCE after 24 h equilibration at room temperature and RH below 30%, using a Mettler Microbalance UMT3 with 1 µg sensitivity. The uncertainty in the gravimetric measurement is typically of the order of 10 µg, which represents campaign an average uncertainty of 3–4% for particulate mass (PM) measurements in the fine and coarse fractions for the MI-NOS campaign. Gravimetric measurements used in the later sections for our chemical mass closures refer to these mea-surements.
Teflon and Nuclepore filters used in the MOUDI were weighed at University of Gent after 24 h equilibration at room temperature and RH below 50%, using also a Met-tler Microbalance with 1 µg sensitivity. Several blanks were taken in the field and averaged 3.6±2.8 µg for Teflon filters and −2±1 µg for Nuclepore filters.
3.2 Ion Chromatography (IC) analysis
One-half sections of the SFU filters and MOUDI impaction surfaces were analyzed by IC for the major inorganic ions (Na+, NH+4, K+, Mg2+, Ca2+, Cl−, NO−3, Br−, SO2−4 , PO3−4 )and some light organics (acetate, formate, methane-sulfonate (MSA), pyruvate, oxalate). Analytical procedures for ion analysis are reported in detail by Kouvarakis et al. (2002). Blanks were taken in the field and were system-atically below the detection limits. Based on a maximum uncertainty of 10 ppb in the analysis of the major inorganic ions, we estimated a maximum uncertainty of 0.03 µg/m3for each ion during this campaign. For the MINOS campaign, this is one order of magnitude lower than the uncertainty in the gravimetric measurements.
3.3 Carbon analysis
A detailed description of the carbon analysis of the quartz fi-bre filters collected during the campaign is given by Sciare et al. (2003b). To avoid interference by carbonates in the measurements, all the samples were initially treated with HCl fumes using the protocol designed by Cachier et al. (1989). The BC and OC concentrations for the quartz fil-ters were measured with a Thermo-Optical Reflectance
tech-nique (Sunset Carbon Analyzer Instrument; Birch and Carry, 1996) using a temperature program that is similar to the one used within the IMPROVE network (Interagency Monitoring of Protected Visual Environments) and reported by Chow et al. (2001). BC was not detected on field blanks, whereas OC concentration averaged 0.24 µgC/m3on these blanks. Blank corrections were then performed only for OC and represent on average 3% of the OC measurements performed during the campaign. Following the recommendation given by the Sunset Company, uncertainty in the BC and OC measure-ments is estimated to be on the order of 5%±0.2 µgC/cm2. Typically for our MBL site, this uncertainty corresponds to 14.2±4.5% and 8.7±1.1%, on average, for our BC and OC mass concentrations; it is comparable to the uncertainty in the gravimetric PM measurements.
3.4 Particle-induced X-ray emission (PIXE) and short ir-radiation Instrumental Neutron Activation Analysis (INAA)
One half sections of the MOUDI impaction substrates were subjected to INAA and PIXE analysis. The 15 following el-ements were determined by INAA: Na, Mg, Al, Cl, Ca, Ti, V, Mn, Cu, Br, Sr, In, Sn, I, Ba; following the analytical procedures given by Maenhaut and Zoller (1977), Schutyser et al. (1978), and Maenhaut and Cafmeyer (1998). The 28 following elements were determined by PIXE: Na, Mg, Al, Si, P, S, Cl, K, Ca, Ti, V, Cr, Mn, Fe, Ni, Cu, Zn, Ga, As, Se, Br, Rb, Sr, Y, Zr, Nb, Mo, Pb. A detailed descrip-tion of the PIXE analysis is given by Maenhaut et al. (1981) and Maenhaut and Raemdonck (1984). The uncertainties in INAA and PIXE depend on many factors, including the sam-ple composition, and for INAA they vary in an irregular way from element to element. For example, the uncertainty of the INAA was typically smaller than 0.3 and 0.2 µg for Na and Al, respectively. These values corresponded to a typi-cal relative uncertainty in the atmospheric concentration data of less than 10% for Na and of less than 5% for Al. In the PIXE analysis for S, the uncertainty was generally smaller than 0.04 µg, which corresponded to a relative uncertainty in the atmospheric concentration of less than 2%.
3.5 Quality assurance
Intercomparison between IC and PIXE/INAA: An intercom-parison exercise was performed for the MOUDI samples taken during the campaign. This intercomparaison is shown (using logarithmic scales) in Fig. 1 for some major anions and cations. For the whole dataset, a very good correlation coefficient (0.97) and slope (1.04) are obtained. These results indicate that there was a quantitative solubilization of the ions analyzed by IC, and in particular calcium, used later as a tracer element for crustal particles (Sect. 4.2). The largest discrepancies appear for concentrations lower than 20 ng/m3;
1 10 100 1000
1 10 100 1000
Chemical species analyzed by IC, ng/m3
C hem ic al s pec ies analy z ed by P IX E /I N A A , ng/ m 3 Calcium Potassium Chloride Sulfur Magnesium Sodium y =1.041 x r² = 0.967
Fig. 1. Intercomparison of data obtained for the MOUDI cascade
impactor samples, by, on the one hand, IC (for water-soluble ions) and, on the other hand, PIXE/INAA (for the total elements).
they affect the lower stages of the MOUDI impactor and thus are not significant for the mass reconstruction presented here. Ionic balance from IC analysis: Strictly speaking, our ionic balance (6+/6−)cannot serve as a quality control of our IC measurements since [H+] and carbonates were not determined in the samples.
For the MBL fine size fraction (0.4 µm pore size Nucle-pore filters), the contribution of H+ to the ion balance is likely to be important, since nss-SO2−4 is only partly neu-tralized by ammonium ([NH+4]/[nss-SO2−4 ](neq/m3)=0.76;
r2=0.87). As a result, without taking into account H+ in
our calculation, the ionic balance of these samples is not achieved (6− (neq/m3)=0.696−++24; r2=0.79). On the
other hand, if we assume that nss-SO2−4 is fully neutral-ized by ammonium and H+, and thus, if H+is added in our calculation, the previous equation is significantly improved (6− (neq/m3)=1.016−++6.1; r2=0.97) and ion balance is achieved.
The coarse size fraction (8 µm pore size Nuclepore fil-ters) contains mainly sea salt and dust aerosols (in particular calcium carbonate) and is thus potentially more basic than acidic. Without taking into account H+ or carbonates, the ionic balance in this fraction is almost achieved and gives: (6−(neq/m3)=0.966−+–2.8; r2=0.99).
Carbonaceous aerosols measurements: The bias in the car-bonaceous aerosol sampling and analysis has been addressed in detail by Sciare et al. (2003b). Briefly, important differ-ences were observed between the BC concentrations from two different methods (a thermo-optical method and the 2-step thermal method developed by Cachier et al., 1989). BC from the thermo-optical method correlated well with
non-sea-salt potassium (nss-K+), indicating that it was associated
with biomass burning. On the other hand, BC from the 2-step thermal method was correlated with non-sea-salt sulfate (nss-SO2−4 ), considered as a tracer for fossil fuel combustion dur-ing the MINOS campaign. For our chemical mass closure, we have used the results from the thermo-optical method, which showed, for BC, a very good correlation with light absorption measurements (r2=0.90; n=56), performed in the field with a PSAP (particle soot absorption photometer; Ra-diance Research; Seattle, USA).
To better constrain the uncertainties in the determination of TC, we intercompared the results from all the samples col-lected at the MBL and FT sites, and analyzed with our two different methods. The TC data of the two methods com-pared very well for all samples from both sites with a slope of 1.00 and r2=0.93 for all data points.
4 Methodology for reconstructing the particulate mass
In this section, we report the different calculations and hy-potheses we have used for the aerosol mass reconstruction in the fine and coarse size fractions.
4.1 Sea salt calculation
Six major ions make more than 99% of the mass of salts dis-solved in seawater: four cations, sodium (ss-Na+), magne-sium (ss-Mg2+), calcium (ss-Ca2+), and potassium (ss-K+); and two anions, chloride (ss-Cl−) and sulfate (ss-SO2−4 ). From the very good correlations found between Na+ and
Mg2+ in both aerosol size fractions (r2=0.92 and 0.96 for the fine and coarse fractions, respectively) and from the good agreement between our mass ratio [Mg2+]/[Na+] of 0.14 and the one of 0.12 reported for Seinfeld and Pandis (1998) for sea water, we can consider these two species as mainly originating from sea salt. On the other hand, our mass ratio [Na+]/[Cl−] for the coarse fraction is, on average, 1.29±0.56, which is significantly lower than the ratio of 1.8 reported for sea water (Seinfeld and Pandis, 1998). Reduc-tion in this ratio is often observed in the area (Mihalopoulos et al., 1997; Kocak et al., 2004) and is due to reaction of nitric and sulfuric acid with NaCl particles and subsequent volatilization of HCl. As a consequence, the HCl volatiliza-tion will not make possible the use of [NaCl] to describe [sea salt]. For this reason, sea salt concentrations will be calcu-lated in the following from the equation:
[Sea salt]=
[Na+] + [Cl−] + [Mg2+] + [ss−K+] + [ss−Ca2+] + [ss−SO2−4 ] (1)
Based on the sea water composition, sea-salt sulfate [ss-SO2−4 ] is calculated as total [Na+] times 0.252, sea-salt calcium [ss-Ca2+] as total [Na+] times 0.038, and sea-salt potassium [ss-K+] as total [Na+] times 0.036.
4.2 Dust calculation
Aluminum and iron were determined by INAA and PIXE, respectively, for the Nuclepore filter impaction surfaces that were used in the MOUDI impactor samplings. A very good correlation was found between these two elements for the whole duration of the campaign and for the entire size range of the MOUDI impactor ([Fe]=0.67*[Al]; r2=0.98; n=22, with concentrations in µg/m3). Our [Fe]/[Al] mass ratio of 0.67 agrees with the ratio of 0.64 reported by Guieu et al. (2002) for Saharan dust. It agrees even better with the ratio of 0.662 reported by Tuncel et al. (1997) for Saharan dust over the eastern Mediterranean region. These results al-low us to use these two elements to calculate the dust aerosol loading of our samples following the equations proposed by Guieu et al. (2002):
[Al](%)=7.09 ± 0.79 [dust] (2)
[Fe](%)=4.45 ± 0.49 [dust] (3)
These equations give the mass percentage of Aluminium and iron found in dust aerosols. On the other hand, neither of these two elements (Fe, Al) was routinely determined in our SFU samples. To calculate the mass fraction of dust aerosols in the SFU samples, we will use another relationship that was obtained for Nuclepore filter impaction substrates of the MOUDI samples between [Al] determined by INAA and an-other tracer element for crustal particles, nss-Ca2+measured by IC ([nss-Ca2+]=1.29 [Al]; r2=0.97; n=18). Combining Eq. (2) with this relationship leads to:
[dust]=10.96 ± 1.00[nss−Ca2+] (4)
This equation is given in µg/m3and will be used later on to calculate the dust mass concentration for our SFU samples. 4.3 Inorganic ions
The ammonium and non-sea-salt sulfate mass concentrations were added as [Ammonium Sulfate]=[nss-SO2−4 ]+[NH+4]. There was a very good correlation between these two species for all size fractions of the MOUDI impactor and for the whole duration of the campaign (r2=0.99; n=78). In the fol-lowing, [Potassium] will refer to [nss-K+]. It was shown to have a biomass burning origin (Sciare et al., 2003b). 4.4 Estimation of BC and OC for the fine and coarse size
fractions – calculation of the Particulate Organic Mass (POM)
BC and OC were determined in the total quartz filter sam-ples that were collected in parallel with our SFU samsam-ples. To separate these total data into fine and coarse size fractions, use was made of the mass size distributions of BC and OC that were derived from the 5 Dekati cascade impactor sam-ples (Sciare et al., 2003b). The impactor data indicated that,
on average, 85±4% of the BC and 82±11% of the OC were present in the fine size fraction (i.e., the fraction with diame-ter below 1.2 µm AD). Since the BC and OC mass size dis-tributions remained fairly constant throughout the campaign, we used these two percentages to deduce the fractions of BC and OC in our two SFU size fractions.
In most closure experiments between gravimetric mass and chemical species measurements, particulate organic mat-ter (POM) is estimated by multiplying OC by a conversion factor (CF), which is the ratio of the average molecular mass to the carbon mass for the organic aerosol:
[POM]=CF[OC] (5)
CF is usually taken in the range from 1.4 for urban aerosols to 1.8 for remote aerosols. Turpin et al. (2001) revisited these conversion factors and proposed values of 1.6±0.2 and 2.1±0.2 for urban and non-urban aerosols, respectively. The latter estimate is given for 40% “more water-soluble” organ-ics. These results are in agreement with the conversion fac-tor of the order of 1.9–2.0 reported by Kiss et al. (2002) for a rural site in Hungary and for an average of 66% for water soluble organic carbon (WSOC). Note that these estimates could be even higher for more oxygenated (aged) aerosols or for smoke particles, known to contain a significant amount of WSOC as well as probably oxygenated BC material (Ruel-lan et al., 1999; Mayol-Bracero et al., 2002). The remote location of Crete Island as well as the aged biomass burning aerosols collected during the MINOS campaign will prob-ably lead to high CF. For all these reasons, we decided to use a conversion factor of 2.1 for our mass reconstruction. A critical discussion of the relevance of this factor is presented below.
4.5 Relevance of our aerosol separation into fine and coarse size fractions
The hypotheses and calculations used to reconstruct the PM in the fine and coarse size fractions were also adopted for the samples taken with the MOUDI impactor. Figure 2 shows the average size distribution of the major aerosol chemical components (carbonaceous aerosols excluded), as obtained from the 6 MOUDI samples taken during the campaign (5– 23 August). The remaining mass reported in the figure rep-resents the difference from the gravimetric PM data. As seen in the figure, the particulate mass is divided into two modes of similar importance, located at approximately 0.45 and 4.5 µm AD. Secondary components, such as ammonium sulfate, dominate the submicron mode, whereas the super-micron mode is essentially made up of sea salt and dust aerosols, and thus has a primary origin. The cut-off diam-eter of 1.2 µm AD used in our SFUs lies between these two modes, and is thus particularly relevant to separate the coarse and fine modes and their corresponding primary and sec-ondary origins.
Table 1. Average concentrations (and associated standard deviations) for the Particulate Mass (PM) and chemical species in the fine and
coarse size fractions and at the two sampling sites (MBL and FT).
Sampling site Aerosol Size fraction Number of Samples Ammonium sulfate µg/m3 Nitrate µg/m3 Potassium µg/m3 BC µgC/m3 OC µgC/m3 Sea salt µg/m3 Dust µg/m3 Sum* (mchem) µg/m3 Particulate Mass (mgrav) µg/m3 MBL station Fine 54 7.99±2.79 0.07±0.04 0.43±0.31 1.18±0.55 2.92±0.90 0.22±0.16 0.54±0.47 16.39±3.95 17.41±4.72 (150 m a.s.l.) Coarse 54 1.20±0.60 2.45±1.19 0.08±0.05 0.18±0.09 0.63±0.20 6.27±6.19 10.55±4.76 22.19±11.10 24.46±10.99 FT station Fine 10 4.70±1.65 0.10±0.05 0.25±0.11 0.65±0.21 2.15±0.41 0.13±0.06 1.35±0.90 11.99±2.59 11.16±3.25 (1500 m a.s.l.) Coarse 10 0.99±0.57 0.80±0.37 0.08±0.06 0.12±0.04 0.47±0.09 0.84±0.75 11.75±4.98 15.55±5.19 14.24±6.05
* calculated using a conversion factor (CF) of 2.1 to convert OC into POM
0 1 2 3 4 5 AD, (µm) A eros ol M as s C onc ent rat ion , µ g/ m 3
POTASSIUM AMMONIUM SULFATE
NITRATE SEA SALT
DUST REMAINING MASS
0.056 -0.1 0.1 -0.18 0.18 -0.32 0.32 -0.56 0.56 -1.00 1.00 -1.80 1.80 -3.20 3.20 -5.60 5.60 -10.00 10.00 -18.00 > 18.00
Fig. 2. Average size distribution of the particulate mass and of
water-soluble inorganic and dust aerosols, as derived from the MOUDI impactor samples of the MBL site.
5 Chemical mass closure for the fine and coarse size
fractions
In the following, the mass reconstructed from our chemical analysis (mchem)is defined as:
mchem=
[Sea salt] + [Dust] + [Nitrate]+
[Ammonium Sulfate] + [Potassium] + [BC] + [POM] (6) Table 1 presents the average concentration and associated standard deviation for the major species used in Eq. (6), for their sum (mchem), and for the gravimetric particulate mass
(mgrav)for the fine and coarse size fractions and for the MBL
and FT sites. The measurements of the individual chemical species and of the gravimetric particulate mass have some uncertainty associated with them (as indicated in Sect. 3).
If we assume that the uncertainties in the measurement of the chemical species are independent of those in the gravi-metric mass measurements, the overall uncertainties in the mass reconstructed from our chemical analysis (mchem)can
be estimated by error propagation, and we arrive at a relative uncertainty of the order of 10%.
Figure 3 shows the temporal variation of the aerosol mass concentration derived from both gravimetric measurements (mgrav) and chemical analysis (mchem). Black and gray
arrows in the figure indicate biomass burning and anthro-pogenic events that were observed during the campaign (Sal-isbury et al., 2003; Sciare et al., 2003b). Good correlations, with slopes close to 1, are seen between the gravimetric and chemically determined mass, for both sites and both size fractions. This indicates that our hypotheses and especially the calculations for dust and carbonaceous aerosols were re-alistic.
For the MBL site, our chemical reconstructed mass (Ta-ble 1) represents, on average, 95 and 90% of the gravimetri-cally determined mass for the fine and coarse size fractions, respectively. For the FT site, and using the same analysis and calculations, the reconstructed mass represents, on aver-age, 107 and 102% of the gravimetrically determined mass for the fine and coarse fractions, respectively. For some in-dividual samples, the difference is larger than the previously estimated overall uncertainty of 10%. In the following, we explore the factors that could be responsible for these differ-ences.
5.1 Influence of water on the chemical mass closure According to Quinn and Coffman (1998), a significant amount of water can be associated with aerosol particles, even at RH below the low-humidity environment of the weighing room. Speer et al. (2003) reported that strongly bound water mainly associated with inorganic species (sul-fate, nitrate) is not removed at these low RH . This wa-ter could be responsible for our remaining undewa-termined mass. To take the bound water into account and close the chemical mass balance, Harrison et al. (2003) applied a
MBL site – Fine fraction mchem= 0.93*mgrav r² = 0.80 30 20 10 0 Mass concentr ation, µg/m 3
MBL site - Coarse fraction
mchem= 0.90*mgrav
r² = 0.78
Chemically determined mass (mchem)
Gravimetric mass (mgrav)
60 30 50 20 40 10 0 70 Mass concentr ation, µg/m 3 25/07 30/07 04/08 09/08 14/08 19/08 24/08 (a) 30 20 10 0 Ma ss concentr a tion, µg /m 3 60 30 50 20 40 10 0 70 Mass concentr ation, µg/m 3
FT site – Fine fraction
mchem= 0.94*mgrav
r² = 0.88
FT site – Coarse fraction
mchem= 0.95*mgrav
r² = 0.72
5/08 10/08 15/08 19/08
Chemically determined mass (mchem)
Gravimetric mass (mgrav)
(b)
MBL site – Fine fraction
mchem= 0.93*mgrav r² = 0.80 30 20 10 0 Mass concentr ation, µg/m 3
MBL site - Coarse fraction
mchem= 0.90*mgrav r² = 0.78
Chemically determined mass (mchem) Gravimetric mass (mgrav)
60 30 50 20 40 10 0 70 Mass concentr ation, µg/m 3 25/07 30/07 04/08 09/08 14/08 19/08 24/08
Fig. 3. Temporal variation of aerosol mass concentration obtained from gravimetric measurements and chemical analyses for the fine and
coarse size fractions of the (a) MBL and, (b) FT sites, respectively. Black and grey arrows stand for biomass burning and anthropogenic influence, respectively.
hydradation multiplication factor of 1.29 to convert their in-organic species (Ammonium sulfate, Nitrate, Sea Salt) into hydrated species. Assuming similar bound water in our sam-ples and using a similar factor of 1.29 for our inorganic species, complete chemical mass closure was achieved at our MBL site with slopes of 1.00 and 0.98 for the fine and coarse size fractions, respectively.
5.2 Sensitivity of chemical mass closure to the carbon anal-ysis protocol and OC to POM conversion factor Influence of the carbon analysis protocol: To examine to what extent the chemical mass closure depends on the car-bon analysis protocol, we employed in Eq. (6) the carcar-bon re-sults obtained with the 2-step thermal method of Cachier et al. (1989) instead of those obtained with our thermo-optical method. Sciare et al. (2003b) indicated that there are seri-ous differences (on average 33±22%) between the BC data from the two methods. These differences lead to differences in the OC and POM concentrations and subsequently in the chemically reconstructed aerosol mass. Slopes and
correla-tion coefficients calculated between (mchem)and (mgrav)with
the 2-step carbon dataset were compared with those obtained with the thermo-optical method. Both carbon analysis proto-cols lead to similar chemical mass closure results. We could therefore conclude that our mass reconstruction was not very sensitive to the carbon analysis protocol.
Influence of the OC to POM conversion factor: The large amount of POM in the fine size fraction as well as the sub-stantial number of samples collected at the MBL site allow us to investigate the relevance of the conversion factor (CF) of 2.1, which was applied to convert OC into POM.
First, if we vary CF from 1.4 to 2.1, the correlation (r2) between mgrav and mchem do not change significantly, but
the slope is the closest to 1 for CF=2.1. Second, by using a least squares method, it was estimated for which CF the best chemical mass closure could be achieved (i.e., mgrav=mchem).
This also resulted in a CF value of 2.1, demonstrating the va-lidity of this conversion for OC to POM.
However, the use of a single CF for the whole duration of the campaign is questionable. As mentioned above, CF is
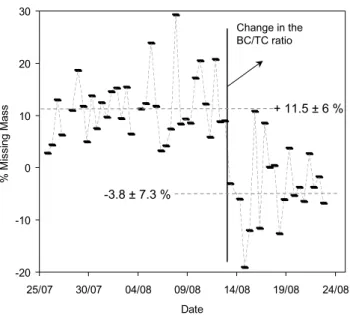
-20 -10 0 10 20 30 25/07 30/07 04/08 09/08 14/08 19/08 24/08 Date % Mi ssi ng M as s + 11.5 ± 6 % -3.8 ± 7.3 % Change in the BC/TC ratio
Fig. 4. Missing mass for the fine size fraction at the MBL site,
defined as the difference between the gravimetric and chemically determined mass. Average values before and after 12 August are indicated by dashed lines.
expected to depend on the oxidation level of the OC, and thus on combustion efficiencies that produce primary and secondary OC. Sciare et al. (2003b) observed that there was a substantial change in the BC/TC ratio during the MINOS campaign on 12 August. Although this change was also ob-served in the BC/CO ratio, it could not be straightforwardly explained by a parallel change in combustion sources, an-thropogenic pollution and biomass burning being observed both before and after 12 August (Fig. 3a). In order to test the sensitivity of our chemical closure to a change in the CF during the campaign, we show in Fig. 4 the missing mass calculated for the fine size fraction as the difference between mgrav and mchem. There is a significant change in the
aver-age value of this missing mass before and after 12 August, which is concomitant with the change in the BC/TC ratio. The change suggests different CF values before and after 12 August, with most probably a higher CF at the beginning of the campaign.
It is interesting to note here that the missing mass in Fig. 4 is not connected with a change in the concentration of inor-ganic salts (which will increase/decrease bound water influ-ence) but is connected with a change in the BC/TC ratio. This result would suggest that the choice of CF is more important than bound water influence in our chemical mass balance.
If we aim to evaluate the results of our mass closure with two CF (noted later CF1and CF2for the periods before and
after 12 August), we can proceed following the two methods reported above to calculate CF:
First, we let CF1and CF2to vary from 1.5 to 3 in order
to find the best correlation (r2) between mgrav and mchem.
30 20 10 0 Mass concentration, µg/m 3
Gravimetric mass (mgrav)
25/07 30/07 05/08 10/08 15/08 20/08 Black Carbon Potassium Organic Matter Ammonium Sulfate Nitrate Sea salt Dust 60 30 50 20 40 10 0 70 Mass concentration, µg/m 3 Fine fraction Coarse fraction MBL site
Chemically determined mass (mchem)
Fig. 5. Temporal variation of the main chemical constituents in the
fine and coarse size fractions at the MBL site.
The best result is found for CF1=2.7 and CF2=1.8.
Correla-tion coefficient (r2) between mgravand mchemis then
signifi-cantly improved from 0.80 to 0.93. Second, by using a least squares method, we can estimate for which CF1and CF2the
best chemical mass closure could be achieved (mgrav=mchem,
i.e. no missing mass). This results in CF values of 2.9 and 1.8 for CF1and CF2, respectively.
Both methods lead to similar CF2(1.8), which is a value
commonly reported in literature. On the other hand, both methods lead to CF1values which are by far too much higher
and unrealistic. This is a striking result since both methods show that our mass closure study is significantly improved for high CF1values. In other words, we need higher
lev-els of POM in the first part of the campaign to fully achieve our chemical mass balance. Errors in the OC analysis can be already excluded (see above the TC intercomparison). Al-ternatively sampling artifact (volatilization of organics from our QMA filters) could be proposed to explain why we don’t have enough POM to close the aerosol mass during the first part of the campaign.
5.3 Factors controlling the particulate mass in the fine and coarse size fractions
Mass concentrations deduced from gravimetric measure-ments average 17.4±4.7µg/m3 and 24.5±11.0 g/m3for the fine and coarse fractions, respectively, at the MBL site (Ta-ble 1). These values compare very well with those reported by Bardouki et al. (2003) one year before at the same station and with gravimetric measurements performed on Berner cascade impactor samples (16.2 and 19.6 µg/m3for fine and coarse fractions, respectively). These values are among the highest reported in literature for “rural” sites in Europe, as defined by Putaud et al. (2004) and they emphasize the role of aerosols in the Mediterranean region.
The temporal variations of the chemical components in the coarse and fine size fractions are shown in Fig. 5. The two size fractions mostly originate from different aerosol sources (mainly anthropogenic secondary sources in the fine fraction and natural primary sources in the coarse fraction). The vari-ations for the two fractions are uncorrelated, which points to the need for a separation between coarse and fine if we aim to constrain the role and variability of anthropogenic aerosols in the Mediterranean Region. The contributions of ammo-nium sulfate and carbonaceous aerosols (BC+POM) to the fine particulate mass are similar for the MBL and FT sites, and sum up to approximately 90%. In the coarse size frac-tion, dust aerosols are particularly important, since they con-tribute 48% and as much as 83% of the coarse PM at the MBL and FT sites, respectively (Table 1). At the MBL site, sea salt and dust aerosols were correlated for some periods of the campaign, suggesting similar wind driven processes and thus regional sources for these types of aerosols. For some other periods, variations in dust aerosols at the MBL site were more related to dust loadings observed at the FT site, suggesting a predominant origin from long-range trans-port. This was supported by back trajectory analysis, which indicated a significant influence of Saharan air masses at the FT site.
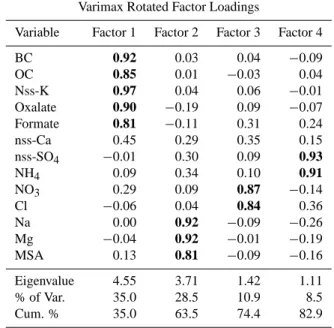
5.4 Factor analysis and source identification
Factor analysis is widely used for source identification and apportionment of particulate air pollutants at receptor sites (see, for instance, Harrison et al., 1997; Balasubramian et al., 2003). It was used here to better characterize the different sources of the submicron aerosols at the MBL site. The data set with the IC and carbon analysis results for the fine SFU filters from the MBL site was subjected to Varimax Rotated Factor Analysis using statistiXL for Microsoft Excel. Four factors were identified with Eigenvalues greater than one (Ta-ble 2). Loadings greater than 0.5 are shown in bold in the table. The 4 factors together explain more than 80% of the total variance of our dataset. The first factor with high load-ings for carbonaceous material (BC, OC, oxalate, formate) and nss-K+can be attributed to biomass burning, which had
Table 2. Varimax Rotated Factor Loadings for the fine particle data
set from the MBL site.
Varimax Rotated Factor Loadings
Variable Factor 1 Factor 2 Factor 3 Factor 4
BC 0.92 0.03 0.04 −0.09 OC 0.85 0.01 −0.03 0.04 Nss-K 0.97 0.04 0.06 −0.01 Oxalate 0.90 −0.19 0.09 −0.07 Formate 0.81 −0.11 0.31 0.24 nss-Ca 0.45 0.29 0.35 0.15 nss-SO4 −0.01 0.30 0.09 0.93 NH4 0.09 0.34 0.10 0.91 NO3 0.29 0.09 0.87 −0.14 Cl −0.06 0.04 0.84 0.36 Na 0.00 0.92 −0.09 −0.26 Mg −0.04 0.92 −0.01 −0.19 MSA 0.13 0.81 −0.09 −0.16 Eigenvalue 4.55 3.71 1.42 1.11 % of Var. 35.0 28.5 10.9 8.5 Cum. % 35.0 63.5 74.4 82.9
an impact at the MBL site during the entire campaign. This finding has to be compared with the conclusions drawn by Sciare et al. (2003b) who reported that carbonaceous parti-cles were not exclusively of biomass burning origin but could also have an anthropogenic origin. Such contradictory results reflect probably well the limits of factor analysis in source identification.
The second factor, with high loadings for sodium, mag-nesium, and MSA, can be attributed to sea salt aerosols, al-though MSA is strictly speaking not emitted by the sea but is an end-product of the oxidation of dimethylsulfide (DMS), which is directly released, like sea salt aerosols, in the atmo-sphere by the effect of wind speed.
The third factor, with high loadings for Cl and NO3, is
most probably linked with HNO3 adsorption on sea salt
particles and subsequent HCl volatilization (as indicated in Sect. 4.1). Although this result brings more evidence of the role of neutralization of sea salt by nitric acid, it fails in deter-mining a specific aerosol source and brings another example of the caution that should be taken when interpreting factor analysis results.
The fourth and last factor, with high loadings for ammo-nium and sulfate, can be attributed to continental anthro-pogenic sources of sulfate and subsequent partial neutraliza-tion by ammonium.
6 Light scattering reconstruction from the chemical mass closure
The cut-off diameter of 1–2 µm AD that was applied in our nephelometer measurements at the MBL site corresponds to the signal from the fine aerosol that was chemically char-acterized. The temporal resolution of our chemical mass closure will be applied here to calculate the specific scatter-ing coefficient and the relative contribution of each chemical species to the light scattering coefficient (σsp)in the fine size
fraction.
The inherent limitations of estimating aerosol optical properties from bulk aerosol measurements have been ad-dressed, at least in part, by a number of authors (see for in-stance, Ouimette and Flagan, 1982). Assuming an externally mixed aerosol (alternatively internally mixed with an index of refraction that is not a function of composition or size), and assuming the aerosol density to be independent of vol-ume, it has been shown that σspcan be written as:
σsp=6αX[X] (7)
where αX is the specific scattering or absorption coefficient
(or mass efficiency) and [X] is the mass concentration of the individual species.
¿From a theoretical perspective, it has been shown that specific scattering from mixtures of organics and sulfates is not sensitive to the choice of internal or external mixtures (Malm and Kreidenweis, 1997). Several authors have es-timated that the differences between external and internal models were usually less than about 10% (Sloane, 1986; Malm and Kreidenweis, 1997). In the absence of knowledge about the detailed microphysical and chemical structure of our ambient aerosols, we assumed that a reasonable estimate of the aerosol scattering coefficient can be achieved through Eq. (7) and by considering that the various species are exter-nally mixed.
Since the nephelometer measurements were done at am-bient RH , the role of water uptake on the aerosol had to be taken into account. It is well-known that sulfates and other hygroscopic species form solution droplets that increase in size as a function of RH . The water uptake can be taken into account by multiplying the concentration of the hygro-scopic species by a humidity-dependent scattering enhance-ment factor, f (RH ). In a first approximation, we will as-sume that the ionic species are the only species that are sen-sitive to RH changes, and thus we assume that f (RH )=1 for BC and POM. This hypothesis has been tested and validated by Malm et al. (2003) who reported good agreement between modelled and measured f (RH ) when assuming that organ-ics did not absorb water.
We will consider here only ammonium sulfate and POM as the main chemical components of aerosols in the fine size fraction, since nitrate, potassium, sea salt and dust aerosols only account for 0.4, 2.4, 1.2% and 3.3% of the total mass
respectively (Table 1). Based on these assumptions Eq. (7) can be reduced to:
σsp=αASf (RH )[Ammonium Sulfate] + αP OM[POM] (8)
where αASand αP OM, stand for the specific scattering
coef-ficient of ammonium sulfate and POM in the fine fraction, respectively. The parameterization we used to determine
f(RH ) for ammonium sulfate aerosols, is the one reported for the summer period in the IMPROVE network and is avail-able on http://vista.cira.colostate.edu/improve/. This f (RH ) was deduced from the following best-fit equation:
f (RH ) = −0.18614 + 0.99211(1/(1 − RH )) (9) Equations (8) and (9) do not link linearly RH and σsp. As
a matter of fact, errors in reconstructed σsp which are
as-sociated with RH measurements will increase together with
RH. Besides this, 12 h averaged RH (used in Eqs. (8) and (9)) will also introduce important bias, especially when im-portant variations of RH will be observed within few hours. Sensitivity tests have been performed to evaluate these errors: First, RH measurements performed by the nephelometer and used here in Eq. (9) have shown to compare well with
RH data from the meteo station of the sampling site (see above Sect. 2.3). Secondly, errors due to 12 h averaged RH were found to be not significant during the time of the cam-paign. Hence, the most important variations of RH observed during the campaign did not correspond to the maximum er-ror observed between measured and reconstructed σsp. Then,
we can conclude that discrepancies found between measured and reconstructed σspwere not originating from errors
asso-ciated with RH measurement or fast changes of RH . 6.1 Calculation of the specific scattering coefficients (αAS,
αP OM)
The time resolution of 12 h in our chemical mass closure work for the MBL site made it possible to obtain a suffi-ciently large data set to determine experimentally the spe-cific scattering coefficients of dry ammonium sulfate and POM. The calculations were done with Multivariate Regres-sion Analysis (MRA) and resulted in αAS=2.66 m2/g, and αP OM=4.19 m2/g at the 95% confidence level. The slope
and correlation (r2)obtained between measured and recon-structed scattering coefficient with this MRA were, respec-tively, 0.99 and 0.83 (number of samples used for the regres-sion = 48).
Our specific scattering coefficients compare well with those of Trijonis (1990), who reported values of 2.5 m2/g and 3.75 m2/g for dry sulfate and organic aerosols. Our value of 2.66 m2/g for sulfate is also in good agreement with the value of 3.15 m2/g reported by Malm et al. (2003) for a US remote site (Big Ben National Park, Texas, USA). Our OC specific scattering coefficient (αP OM) compares well with
the value obtained for various rural sites in United States: 4.0 m2/g reported by Malm et al. (1994), 3.81 m2/g reported
by Omar et al. (1999) for low RH (below 63%) at Bondville (Illinois, USA) and, 3.36±0.49 m2/g reported by Slater and Dibb (2004) in New England (USA). After we bring our dry specific coefficient for ammonium sulfate (αAS)to
am-bient RH (i.e., after multiplying αAS by f (RH )), the
coeffi-cient reaches a value of 6.73 m2/g for the mean RH of 60% recorded during the campaign. This value falls within the range proposed by other authors for ambient RH conditions (Andreae et al., 2002, and references therein).
To emphasize the role of water uptake on the optical prop-erties of aerosols, the reconstructed scattering coefficient was calculated for RH =0 and is shown in Fig. 6 together with the measured and reconstructed ambient scattering coefficient. The relative contribution of water uptake on aerosols was found to range from 15 to 60% of the reconstructed ambi-ent light scattering coefficiambi-ent (36±14%, on average, for the duration of the campaign).
Although our MBL site was most of the time influenced by biomass burning, these results highlight the major role of anthropogenic sulfate aerosols and their corresponding wa-ter uptake on the radiative properties of aerosols in the MBL of the eastern Mediterranean Basin. It is interesting to note also that, from a thermodynamic point of view, the role of water uptake on sulfate aerosols should be even more im-portant here due to the partial ammonia neutralization that promotes water uptake on sulfate aerosols at RH as low as 40% (see for instance the results of the equilibrium thermo-dynamic model described by Clegg et al., 1998).
6.2 Influence of the OC to POM conversion factor CF on the reconstructed σsp
We have reported in Sect. 5.2 that two different CF (before and after 12 August) were probably needed to significantly improve our mass closure, and we have decided here to test this hypothesis on the reconstructed σsp with CF1=2.7 and CF2=1.8. We do agree that this hypothesis cannot be realistic
for CF1(see the discussion in Sect. 5.2). On the other hand,
it is interesting to note that the use of this hypothesis sig-nificantly improves the correlation coefficient (r2) between measured and reconstructed σsp(from 0.83 to 0.90). This
re-sult brings further evidence on the need to use two different CF in our mass closure. In other words, we have shown here that reconstruction of σsp could be useful to better constrain
our chemical mass closure (and our OC to POM conversion factor).
7 Conclusions
A detailed chemical characterization of size-segregated aerosols was performed during the MINOS campaign for two sites located in the MBL and the lower FT, respectively. Quality assurance was performed by intercomparing IC data for water-soluble ions and PIXE/INAA elemental data, and
0 25 50 75 100 125 28/07 02/08 07/08 12/08 17/08 22/08 Scatterin g Coeffici e n t, Mm-1 VspNephelometer Vspreconstructed at ambient RH Vspreconstructed at RH = 0
Vsp(Nephelometer) = 0.99 x Vsp(reconstructed at ambient RH) r² = 0.83
Fig. 6. Scattering coefficient (σsc)at the MBL site, measured with a
nephelometer at ambient RH and reconstructed from the chemical mass closure results at ambient RH and RH =0.
the effect of applying different analytical protocols for car-bon analysis was examined. Chemical mass closure was achieved for the fine and coarse size fractions at the two sites, which indicated that our hypotheses to calculate sea salt, dust, and organic aerosols were justified. Sensitivity tests showed that, unlike for the BC concentrations, the mass re-construction does not significantly depend on a specific car-bon analysis protocol. Our proposed conversion factor from OC to POM of 2.1 is at the upper end of those reported in the literature, but fits with the fact that aged combustion aerosols were sampled during the campaign. Our mass closure results also suggest that this conversion factor changed in the mid-dle of the campaign together with a concomitant change in the BC/TC ratio.
Factor analysis for our submicron aerosols suggested that the carbonaceous aerosols were mainly linked to biomass burning, and that there is a separate anthropogenic compo-nent with ammonium sulfate aerosols that is not connected to nitrate which is adsorbed on sea salt particles.
The chemical mass closure results are used to reconstruct and constrain the ambient light scattering measured at the MBL site. The specific light scattering coefficients of 2.66 and 4.19 m2/g calculated for dry ammonium sulfate and or-ganic aerosols agree well with literature data. Assuming that ammonium sulfate was the only aerosol component sensitive to RH , we found that water uptake was responsible for about one third on average of the calculated reconstructed ambient light scattering coefficient.
These results obtained in this study will be used in a ra-diative transfer model to calculate the local direct rara-diative forcing of aerosols at our MBL site, following the methodol-ogy reported by Mallet et al. (2003).
Acknowledgements. The authors want to acknowledge J. C. Roger
for his helpful comments, as well as F. Gautier and O. Favez for their important contribution in sampling and analysis of the carbonaceous aerosols at the two sampling sites. The ECPL team is thanked for its help in the field as well as for its hospitality. This work has been supported by the LSCE, the Max Planck Society, ECPL and UGent. One of us (W. Maenhaut) is indebted to the Belgian Federal Science Policy Office for research support. Edited by: M. de Reus
References
Andreae, T. W., Andreae, M. O., Ichoku, C., Maenhaut, W., Cafmeyer, J., Karnieli, A., and Orlovsky, L.: Light scattering by dust and anthropogenic aerosol at a remote site in the Negev desert, Israel, J. Geophys. Res., 107, doi:10.1029/2001JD900252, 2002.
Balasubramian, R., Qian, W.-B.,Decesari, S., Facchini, M. C., and Fuzzi, S.: Comprehensive characterization of PM2.5 aerosols in Singapore, J. Geophys. Res., 108, doi:10.1029/2002JD002517, 2003.
Bardouki, H., Liakakou, H., Economou, C., Sciare, J., Smol´ık, J., ˇ
Zd´ımal, V., Eleftheriadis, K., Lazaridis, M., and Mihalopoulos, N.: Chemical composition of size resolved atmospheric aerosols in the eastern Mediterranean during summer and winter, Atmos. Environ., 37, 195–208, 2003.
Birch, M. E. and Cary, R. A.: Elemental carbon-base method for monitoring occupational exposures to particulate diesel exhaust, Aerosol Sci. Technol., 25, 221–241, 1996.
Cachier, H., Br´emond, M. P., and Buat-M´enard, P.: Determination of atmospheric soot carbon with a simple thermal method, Tellus 41B, 379–390, 1989.
Chow, J. C., Watson, J. G., Crow, D., Lowenthal, D. H., and Mer-rifield, T.: Comparison of IMPROVE and NIOSH carbon mea-surements, Aerosol Sci. Technol., 34, 23–34, 2001.
Clegg, S. L., Brimblecombe, P., and Wexler, A. S.: A Thermody-namic Model of the System H+-NH+4-Na+-SO2−4 -NO−3-Cl− -H2O at 298.15 K, J. Phys. Chem., 102A, 2155–2171, 1998.
Formenti, P., Boucher, O., Reiner, T., Sprung, D., Andreae, M. O., Wendish, M., Wex, H., Kindred, D., Tzortziou, M., Vasaras, A., and Zerefos, C.: STAAARTE-MED 1998 summer airborne mea-surements over the Aegean Sea : 2. Aerosol scattering and ab-sorption, and radiative calculations, J. Geophys. Res., 107(D21), 4451, doi:10.1029/2001JD001536, 2002.
Guieu, C., Lo¨ye-Pilot, M.-D., Ridame, C., and Thomas, C.: Chemi-cal Characterization of the Saharan dust end-member: Some bio-geochemical implications for the Western Mediterranean sea, J. Geophys. Res., 107, doi:10.1029/2001JD000582, 2002. Harrison, R. M., Smith, D. J. T., Pio, C. A., and Castro, L. M.:
Com-parative receptor modeling study of airborne particulate pollu-tants in Birmingham (United Kingdom), Coimbra (Portugal) and Lahore (Pakistan), Atmos. Environ., 31, 3309–3321, 1997. Harrison, R. M., Jones, A. M., and Lawrence, R. G.: A pragmatic
mass closure model for airborne particulate matter at urban back-ground and roadsites, Atmos. Environ., 37, 4927–4933, 2003. Haywood, J. and Boucher, O.: Estimates of the direct and indirect
radiative forcing due to tropospheric aerosols: A review, Rev. Geophys., 38, 513–543, 2000.
IPCC: The Scientific Basis; Contribution of the Working group I to the third Assessment Report of the Intergovernmental Panel on Climate Change, edited by: Houghton, J. T., Ding, Y., and Griggs, D. J., pp. 249–348, Cambridge Univ. Press, New York. Jacobson, M. Z.: Global direct radiative forcing due to
multicompo-nent anthropogenic and natural aerosols, J. Geophys. Res., 106, 1551–1568, 2001.
John, W., Hering, S., Reischl, G., Sasaki, G., and Goren, S.: Char-acteristic of Nuclepore filters with large pore size, II, Filtration properties, Atmos. Environ., 17, 373–382, 1983.
Kirkevag, A. and Iversen, T.: Global direct radiative forcing by process-parametrized aerosol optical properties, J. Geophys. Res., 107(D20), 4433, doi:10.1029/2001JD000866, 2002. Kiss, G., Varga, B., Galambos, I., and Granszky, I.:
Char-acterization of water-soluble organic matter isolated from atmospheric fine aerosol, J. Geophys. Res., 107(D21), doi:10.1029/2001JD000603, 2002.
Kouvarakis, G., Doukelis, Y., Mihalopoulos, N., Rapsomanikis, S., Sciare, J., and Blumthaler, M.: Chemical, physical and optical characterization of aerosol during PAUR II experiment, J. Geo-phys. Res., 107, 814, doi:10.1029/2000JD000291, 2002. Koc¸ak, M., Kubilay, N., and Mihalopoulos, N.: Ionic composition
of the lower tropospheric aerosols in a NE Mediterranean site: Implication regarding sources and long-range transport, Atmos. Environ., 38, 2067–2077, 2004.
Lelieveld, J., Berresheim, H., Borrmann, S., Crutzen, P. J., Den-tener, F. J., Fischer, H., Feichter, J., Flatau, P. J., Heland, J., Holzinger, R., Korrmann, R., Lawrence, M. G., Levin, Z., Markowicz, K. M., Mihalopoulos, N., Minikin, A., Ramanathan, V., de Reus, M., Roelofs, G. J., Scheeren, H. A., Sciare, J., Schlager, H., Schultz, M., Siegmund, P., Steil, B., Stephanou, E. G., Stier, P., Traub, M., Warneke, C., Williams, J., and Ziereis, H.: Global Air Pollution Crossroads over the Mediterranean, Sci-ence, 298, 794–799, 2002.
Maenhaut, W. and Cafmeyer, J.: Long-term atmospheric aerosol study at urban and rural sites in Belgium using multi-elemental analysis by particle-induced X-ray emission spectrometry and short-irradiation instrumental neutron activation analysis, X-Ray Spectrom., 27, 236–246, 1998.
Maenhaut, W. and Raemdonck, H.: Accurate calibration of a Si(Li) detector for PIXE analysis, Nuclear Instrum. Methods Phys. Res., B1, 123–136, 1984.
Maenhaut, W. and Zoller, W. H.: Determination of the chemical composition of the South Pole aerosol by instrumental neutron activation, J. Radioanal. Chem., 37, 637–650, 1977.
Maenhaut, W., Selen, A., Van Espen, P., Van Grieken, R., and Winchester, J. W.: PIXE analysis of aerosol samples collected over the Atlantic Ocean from a sailboat, Nuclear Instrum. Meth-ods, 181, 399–405, 1981.
Mallet, M., Roger, J. C., Despiau, S., Dubovik, O., and Putaud, J. P.: Microphysical and optical properties of aerosol particles in urban zone during ESCOMPTE, Atmos. Res., 69, 73–97, 2003. Malm, W. C., Sisler, J. F., Huffman, D., Eldred, R. A., and Cahill, T.
A.: Spatial and seasonal trends in particle concentration and op-tical extinction in the United States, J. Geophys. Res., 99, 1347– 1370, 1994.
Malm, W. C. and Kreidenweis, S. M.: The effects of models of aerosol hygroscopicity on the apportionement of extinction, At-mos. Environ., 31, 1965–1976, 1997.
Malm, W. C., Day, D. E., Kreidenweis, S. M., Collett, J. L., and Lee, T.: Humidity-dependent optical properties of fine particles during the Big Bend Regional Aerosol and Visibil-ity Observational Study, J. Geophys. Res., 108(D29), 4279, doi:10.1029/2002JD002998, 2003.
Markowicz, K. M., Flatau, P. J., Ramana, M. V., Crutzen, P. J., and Ramanathan, V.: Absorbing Mediterranean aerosols lead to a large reduction in the solar radiation at the surface, 29, Geophys. Res. Lett., doi:10.1029/2002GL015767, 2002.
Mayol-Bracero, O. L., Guyon, P., Graham, B., Roberts, G., An-dreae, M. O., Decesari, S., Facchini, M. C., Fuzzi, S., and Ar-taxo, P.: Water soluble organic compounds in biomass burning aerosols over Amazonia, 2, Apportionment of the chemical com-position and importance of the polyacidic fraction, J. Geophys. Res., 107(D20), 8091, doi:10.1029/2001JD000522, 2002. Mihalopoulos, N., Stephanou, E., Pilitsidis, S., Kanakidou, M., and
Bousquet, P.: Atmospheric aerosol composition above the East-ern Mediterranean region, Tellus, 49B, 314–326, 1997. Omar, A. H., Biegalski, S., Larson, S. M., and Landsberger, S.:
Particulate contributions to light extinction and local forcing at a rural Illinois site, Atmos. Environ., 33, 2637–2646, 1999. Ouimette, J. R. and Flangan, R. C.: The extinction coefficient
of multicomponent aerosols, Atmos. Environ., 16, 2405–2419, 1982.
Ohta, S. and Okita, T.: Measurement of particulate carbon in urban and marine air in Japanese areas, Atmos. Environ., 18, 2439– 2445, 1984.
Putaud, J. P., Raes, F., Van Dingenen, R., et al.: A European Aerosol Phenomenology – 2: chemical characteristics of particulate mat-ter at kerbside, urban, rural and background sites in Europe, At-mos. Environ., 38, 2579–2595, 2004.
Quinn, P. K. and Coffman, D. J.: Local closure during the First Aerosol Characterization Experiment (ACE 1): Aerosol mass concentration and scattering and backscattering coefficients, J. Geophys. Res., 103, 16 575–16 596, 1998.
Ruellan, S., Cachier, H., Gaudichet, A., Masclet, P., and Lacaux, J. P.: Airborne aerosols over central Africa during the regional sources and sinks of oxidants (EXPRESSO), J. Geophys. Res., 104(D23), 30 673–30 690, 1999.
Salisbury, G., Williams, J., Holzinger, R., Gros, V., Mihalopou-los, N., Vrekoussis, M., Sarda-Est`eve, R., Berresheim, H., von Kuhlmann, R., Lawrence, M. G., and Lelieveld, J.: Ground-based PTR-MS measurements of reactive organic compounds during the MINOS campaign in Crete, July–August 2001, At-mos. Chem. Phys., 3, 925–940, 2003,
SRef-ID: 1680-7324/acp/2003-3-925.
Schutyser, P., Maenhaut, W., and Dams, R.: Instrumental neu-tron activation analysis of dry atmospheric fall-out and rainwater, Anal Chim. Acta, 100, 75–85, 1978.
Sciare, J., Bardouki, H., Moulin, C., and Mihalopoulos, N.: Aerosol sources and their contribution to the chemical composition of aerosols in the Eastern Mediterranean Sea during summertime, Atmos. Chem. Phys., 3, 1–12, 2003a,
SRef-ID: 1680-7324/acp/2003-3-1.
Sciare, J., Cachier, H., Oikonomou, K., Ausset, P., Sarda-Est`eve, R., and Mihalopoulos, N.: Characterization of Carbonaceous Aerosols during the MINOS campaign in Crete, July–August 2001: a multi-analytical approach, Atmos. Chem. Phys., 3, 1743–1757, 2003b,
SRef-ID: 1680-7324/acp/2003-3-1743.
Seinfeld, J. H. and Pandis, S. N.: Atmospheric chemistry and physics: From air pollution to climate change, 1360 pp., John Wiley, Hoboken, N.J., 1998.
Slater, J. F. and Dibb, J. E.: Relationships between surface and column aerosol radiative properties and air mass transport at a rural New England Site, J. Geophys. Res., 109, D01303, doi:10.1029/2003JD003406, 2004.
Sloane, C. S.: Effect of composition on aerosol light scattering effi-ciencies, Atmos. Environ., 20, 1025–1037, 1986.
Speer, R. E., Edney, E. O., and Kleindienst, T. E.: Impact of or-ganic compounds on the concentrations of liquid water in ambi-ent PM10, J. Aerosol Sci., 34, 63–77, 2003.
Traub, M., Fischer, H., de Reus, M., Kormann, R., Heland, J., Zieris, H., Schlager, H., Holzinger, R., Williams, J., Warneke, C., de Gow, J., and Lelieveld, J.: Chemical characteristics as-signed to trajectory clusters during the MINOS campaign, At-mos. Chem. Phys., 3, 459–468, 2003,
SRef-ID: 1680-7324/acp/2003-3-459.
Trijonis, J. C., Malm, W. C., Pitchford, M., White, W. H., Charlson, R., and Husar, R.: Visibility: Existing and historical conditions-causes and effects, in: State of Scientific Technology, Rep. 24, Natl. Acid. Precip. Assess. Program, Washington, D.C., 1990. Tuncel, G., G¨ull¨u, G., Tuncel, S. G., and Aras, N. K.: Atmospheric
transport of pollutants to the Eastern Mediterranean Basin, IAE-TECDOC, IAE, Vienna, 1997.
Turpin, B. J. and Lim, H. J.: Species contribution to PM2.5 mass concentrations: revisiting common assumptions for estimating organic mass, Aerosol Sci. Technol., 35, 602–610, 2001.