Seasonal and mesoscale variability of oceanic transport of anthropogenic CO2
Texte intégral
Figure


Documents relatifs
The decomposition of the salt trans- port, as demonstrated here, allows us to link the atmospheric forcing and the transport of salt by the different components of the ocean
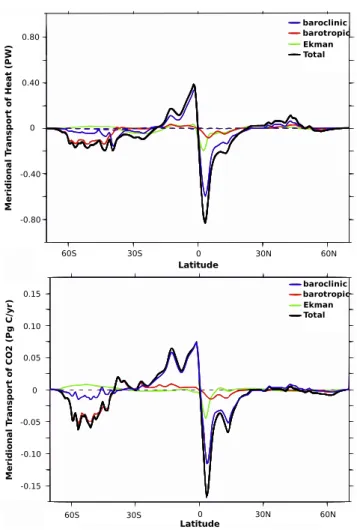
Following the recommendation of Bryden and Imawaki (2001) for the heat transport we decompose the meridional salt transport into three contributions, one of which is directly related
In 2001 in the reference model, a total of 1.5 Pg C of anthropogenic carbon had entered the Mediterranean Sea with 52 % from the air–sea flux and 48 % from Atlantic Wa- ter
macrophages deficient in DRP1 (also known as Drp-/- BMM; Wang et al., 2017), we showed that while DRP1 knockout results in constitutively elongated/fused mitochondria (Figure
The fact that single-feature harmonies, like anteriority harmony, fail to show similarity effects, which are a central aspect of the correspondence or linking
We investigate the strength of this method on a set of WMAP nine-year simulated data for three types of primordial power spectra: a near scale-invariant spectrum, a spectrum with
Finally, Figure S10 also reveals that using an alternative estimate for the anthropogenic CO 2 storage in 1994, i.e., by using the ocean inversion based estimate of ref (14)
Variability and stability of anthropogenic CO2 in Antarctic Bottom Waters observed in the Indian sector of the Southern.. Ocean Science, European Geosciences Union, 2020, 16
